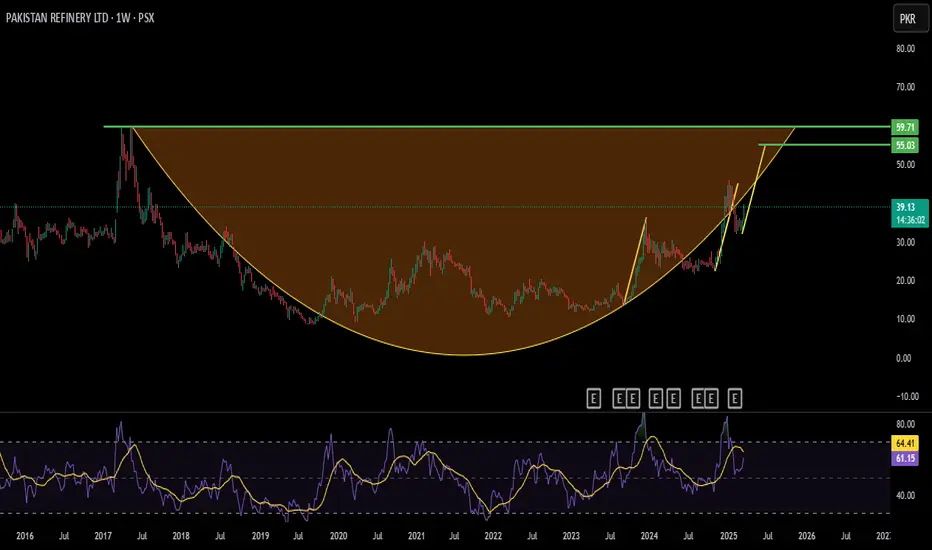
PRL WEEKLY CHART TOWARDS 60 ??PSX:PRL
1. Weekly chart suggests that price is working in cup shape.
2. AB:CD pattern is in play since 2023.
3. DEC23 : 35, Dec24: 45
4. Safe bet for PRL with current patterns is 55-60
at Important Support LevelCurrently at a Good Support Level.
Potential to touch 66 - 67.
However, if it breaks 57 , we may witness further
Selling Pressure.

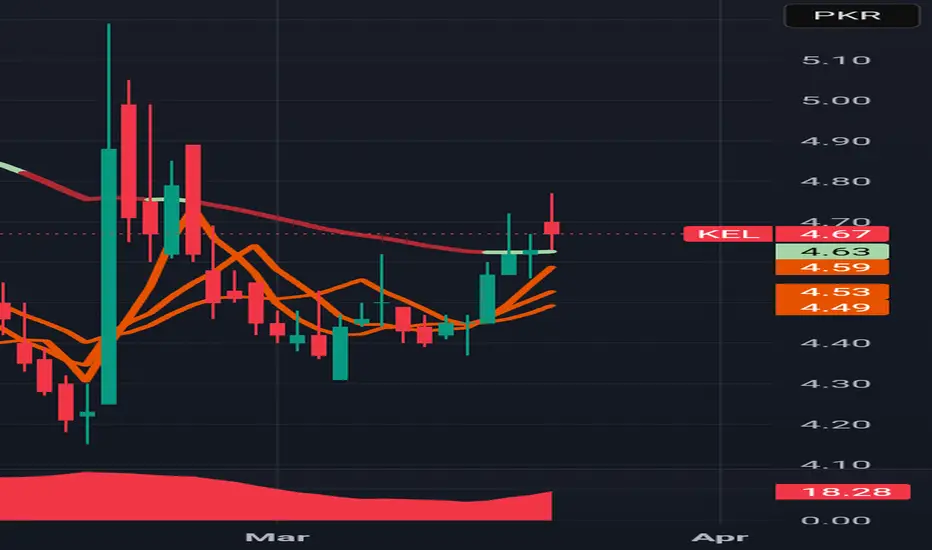
KEL is heading to 5KEL technically enters in bullish trend and it is expected to cross 5 level.
Note: this is not a buy sell call. Use SL too.
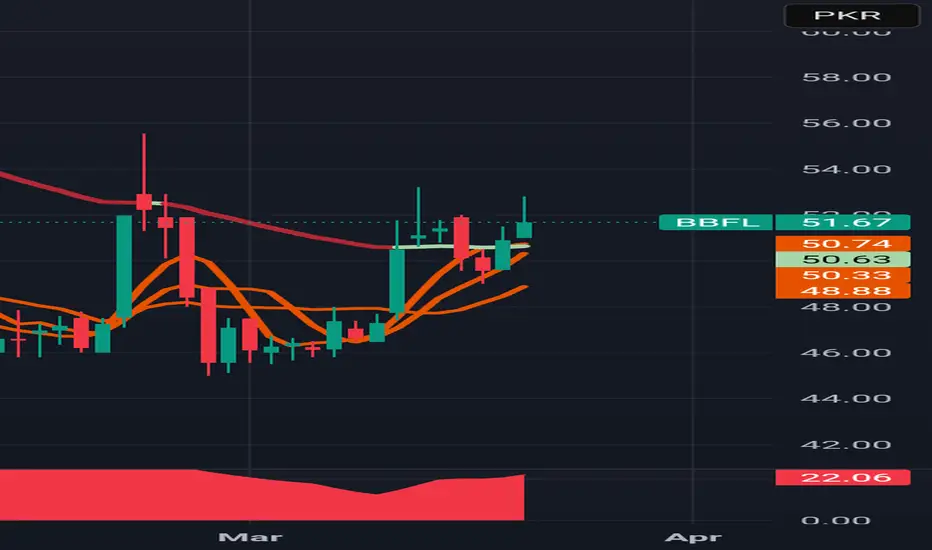
BBFL is heading to 55BBFL is in bullish zone and it is expected to cross 55 level
Note. This is not a buy sell call use stop loss.
Sys is heading to 600+Sys is in bullish trend and it is technically in strong bullish trend and it is expected to cross 600 and 620 level
Note. This is not a buy sell call and use stop loss too.

Efert could drop to 200 to 188Technically efert is dropping its support level and it is expected to more drop to 200 and 188 level
Note; This is not a buy sell call, use stop loss too.

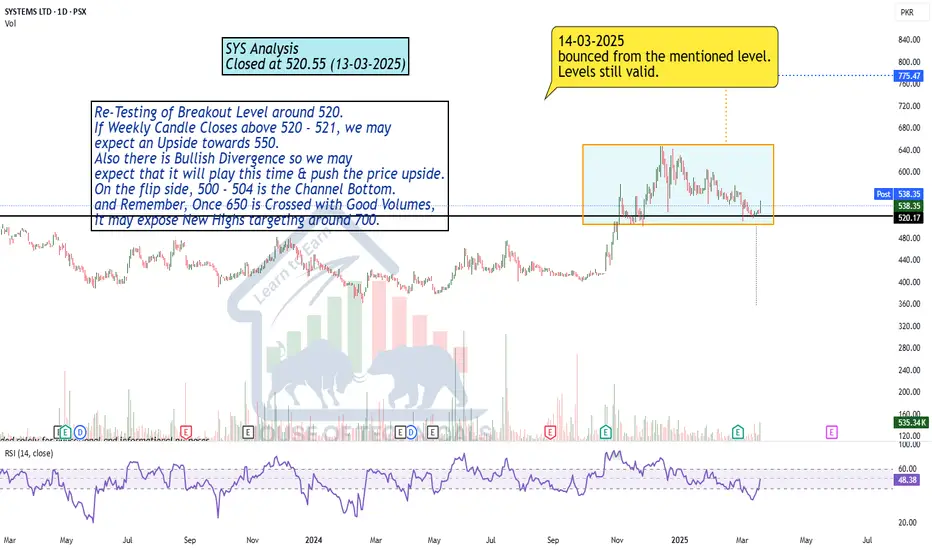
Re-Testing of Breakout Level around 520.Re-Testing of Breakout Level around 520.
If Weekly Candle Closes above 520 - 521, we may
expect an Upside towards 550.
Also there is Bullish Divergence so we may
expect that it will play this time & push the price upside.
On the flip side, 500 - 504 is the Channel Bottom.
and Remember, Once 650 is Crossed with Good Volumes,
it may expose New Highs targeting around 700.
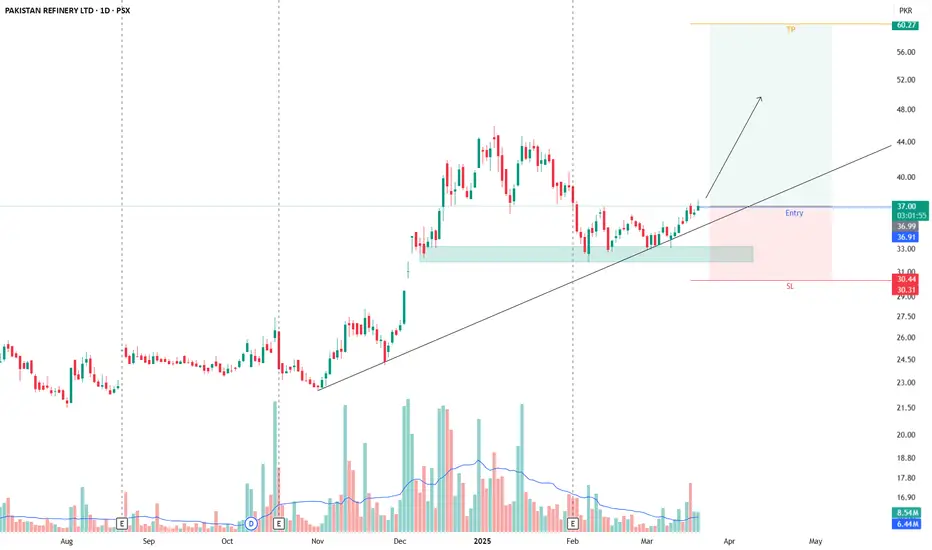
PRL is at a buy pricePRL is at a buy price and ready to shoot. Taking support from it's trend line and accumulation phase is almost over.
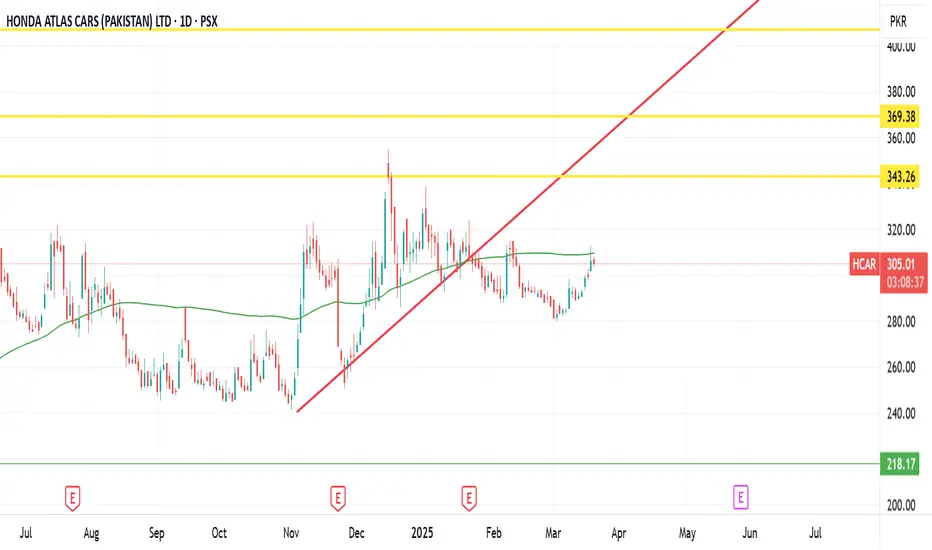
HCAR - LongThe auto sector as a whole has seen movement, but HCAR has yet to perform, primarily due to the lack of new product launches, making it less competitive against peers. However, sales for the January–March quarter have shown a significant increase , which is expected to reflect positively in profitability.
From a technical perspective, the stock needs to close above 312 with a strong green candle to gain momentum. All target levels are marked on the chart.
Please conduct your own research before making any investment decisions.
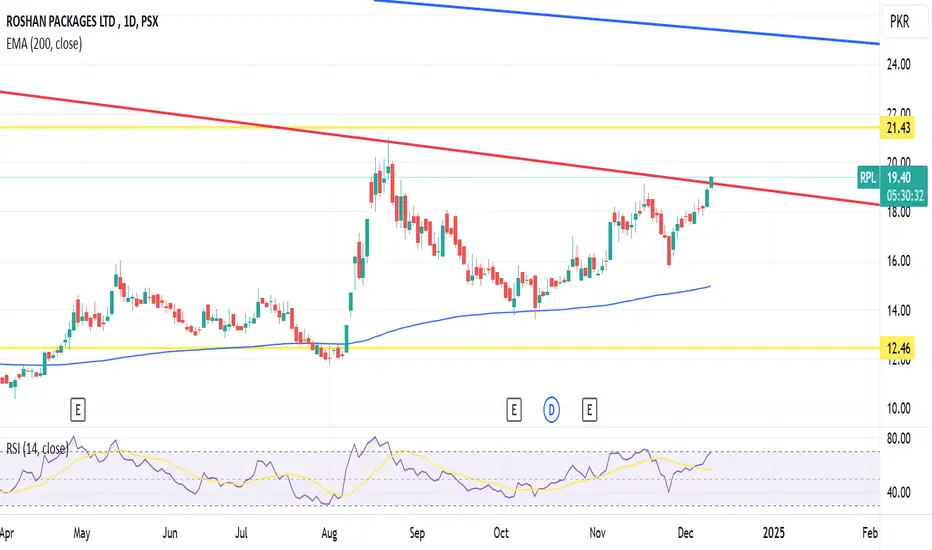
RPL - LongLooking good as the weekly trendline is broken. In a bullish market, this share needs to catch up so I am giving this long call based on market psychology. Do your own research
TP 1: 21.2
TP2: 22.3
Tp 3: 24
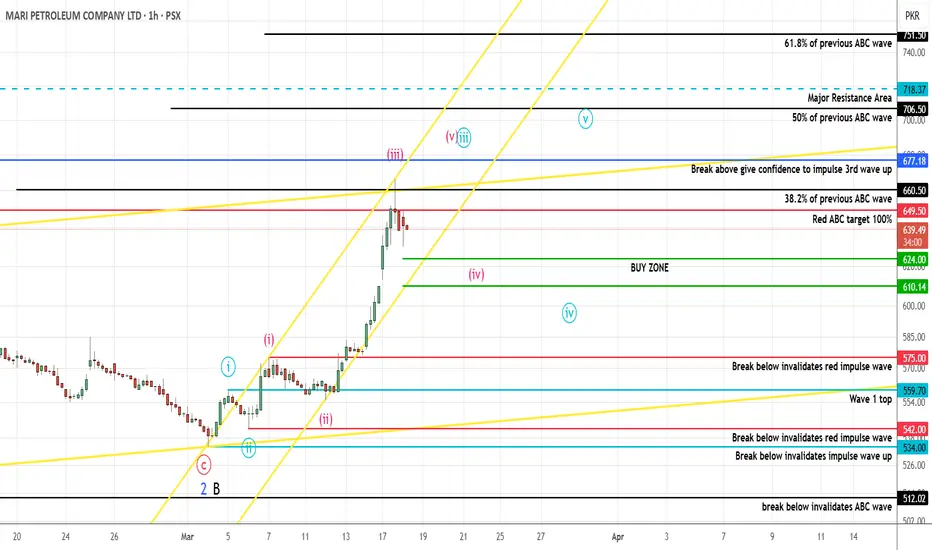
MARI PROBABLY IN WAVE '' 4 '' - LONGThis is in continuation to our ongoing tracking of MARI C or 3 wave structure.
If the wave count is correct then we are in the 4th wave of a bigger C or 3 wave, as wave 4 can be any corrective patterns it is hard to predict them. They can be sharp or complex and can be frustrating at times.Currently the wave structure look smooth and it doesn't seem like that it will get complex but you never know what market will do.
We will buy long positions once price reach our buy zone range 624 - 610, however if the sentiments get very bullish prices might not even get to this range and start rising for the 5th red wave but we should not act greedy chasing every move.
If you are an aggressive trader you can enter long positions as the over all direction is up but we will wait for the price to come into our buy zone range 624 - 610 or touch/breach the below yellow trendline.
Let see how this plays, Good Luck !
Disclaimer: The information presented in this wave analysis is intended solely for educational and informational purposes. It does not constitute financial or trading advice, nor should it be interpreted as a recommendation to buy or sell any securities.
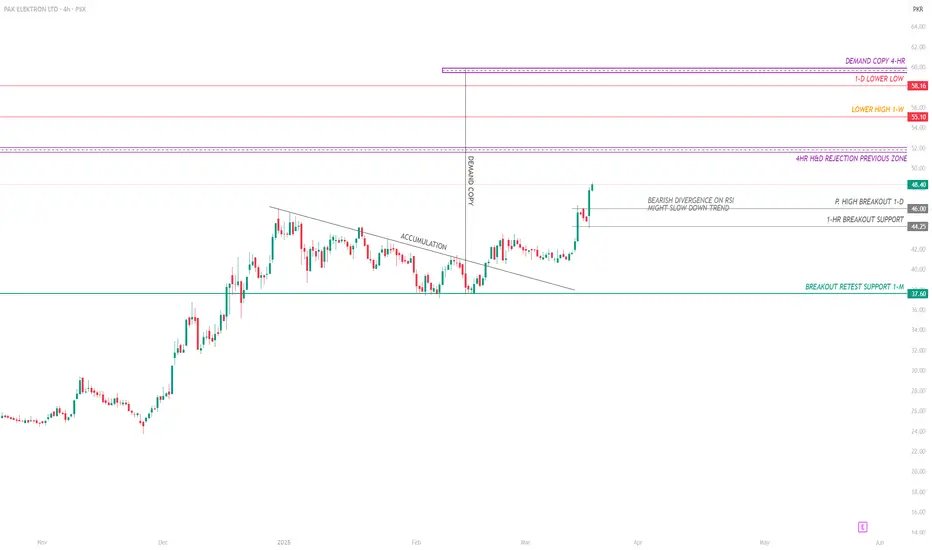
PAEL - THE BEST SETUPPAEL has always been my favorite stock as it plays very well on price action and technical.
Right now the trending accumulation has ended and its time for a move.
if we take the simple and basic previous demand copy. It gives the target of 60 which everyone is expecting. but there might be some trick played to take out the retails. so be careful around 55 and 59 level you might see the trend slowdown in short term due to divergence on RSI.
right now if you want to accumulate more wait for the intraday retest levels around 46 to 44.
I HAVE ALREADY ENTERED THIS SETUP AROUND 43.
THE TAKE PROFIT IS 55 AND THEN 58 TO 59 ACCORDINGLY.
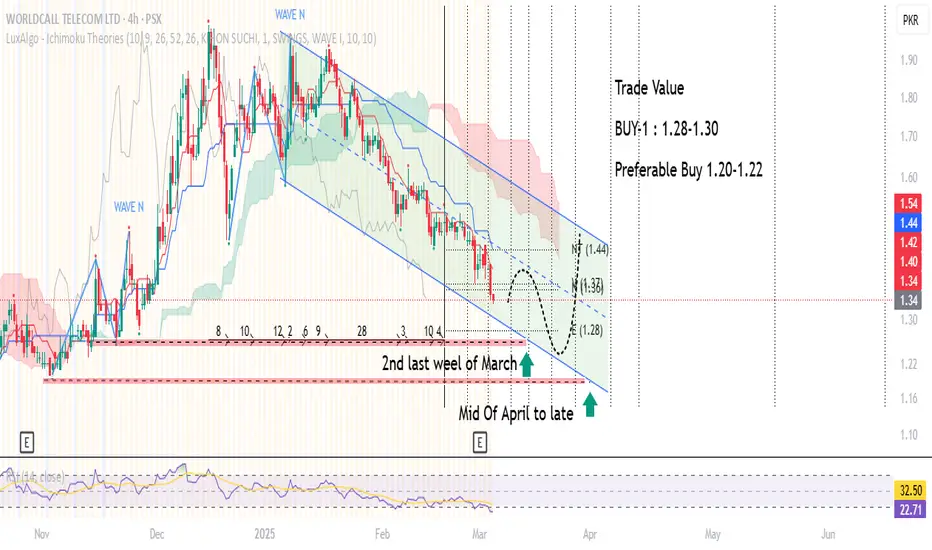
WTL Stock Ready for a Bounce? Levels to Watch in Mar & AprMarket Outlook :
The stock has been in a downtrend, trading within a descending channel. It has been forming lower highs and lower lows, indicating bearish momentum. Currently, the price is near the lower boundary of the channel, which might act as a support level.
Trading Strategy
1.28 - 1.30 PKR (First Buy Zone/temporary support)
1.20 - 1.22 PKR (Strong preferable buy zone)
Govt. to Clear HUBCO’s Pending Payments Within 90 DaysBullish Breakout: Price has cleared a key resistance zone at 144-46 PKR, signaling an upward trend.
Buying Momentum: As long as the price stays above the trendline, the bullish trend remains intact.
Overbought : Currently stock at Overbought zone, A short-term pullback and consolidation is due before another rally.


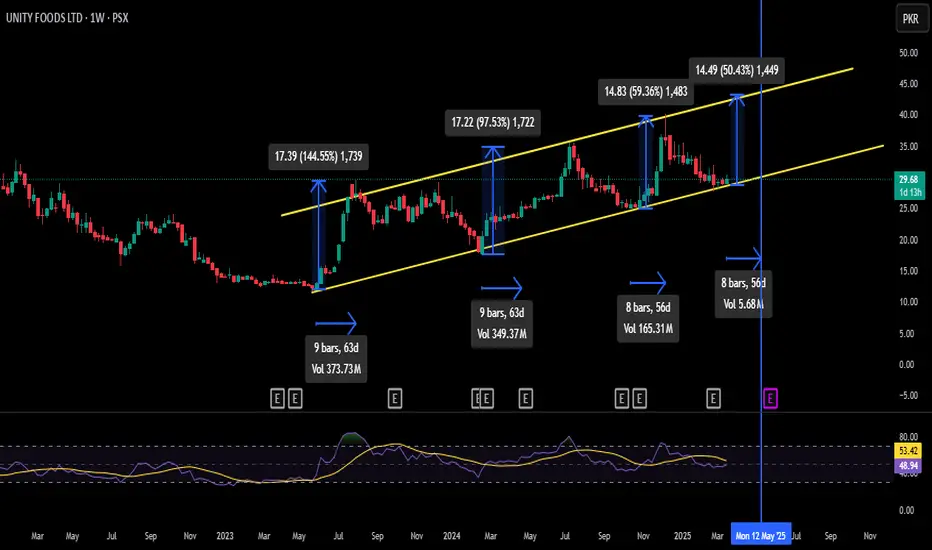
Unity Foods at top of the channel in May25 ??PSX:UNITY
Weekly upward channel suggests that;
1. when it hits channel bottom and forms a bullish candle,
2. it needs 8-9 weeks for upside move and hits channel top,
3. this time, it is coming around 42+ or 48% gain from CMP.

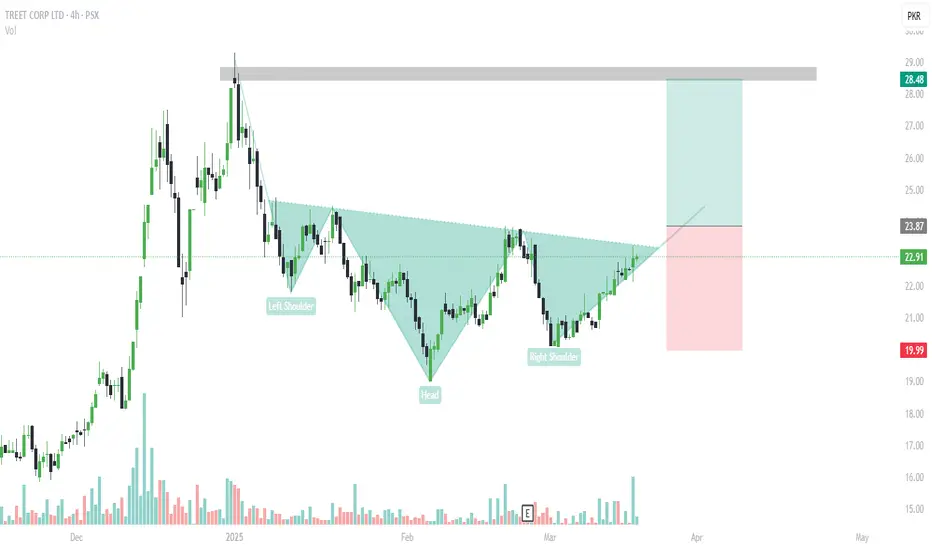
Treet PSXPattern,
Volums,
stop-loss defined,
Assume the Corrective phase completed,
Entry on break of Lower high,

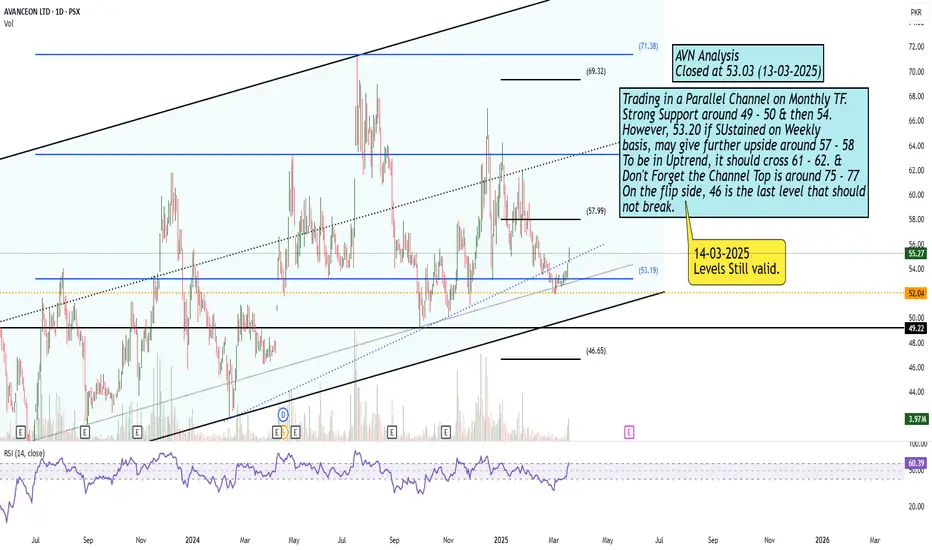
Trading in a Parallel Channel on Monthly TF.Trading in a Parallel Channel on Monthly TF.
Strong Support around 49 - 50 & then 54.
However, 53.20 if SUstained on Weekly
basis, may give further upside around 57 - 58
To be in Uptrend, it should cross 61 - 62. &
Don't Forget the Channel Top is around 75 - 77
On the flip side, 46 is the last level that should
not break.
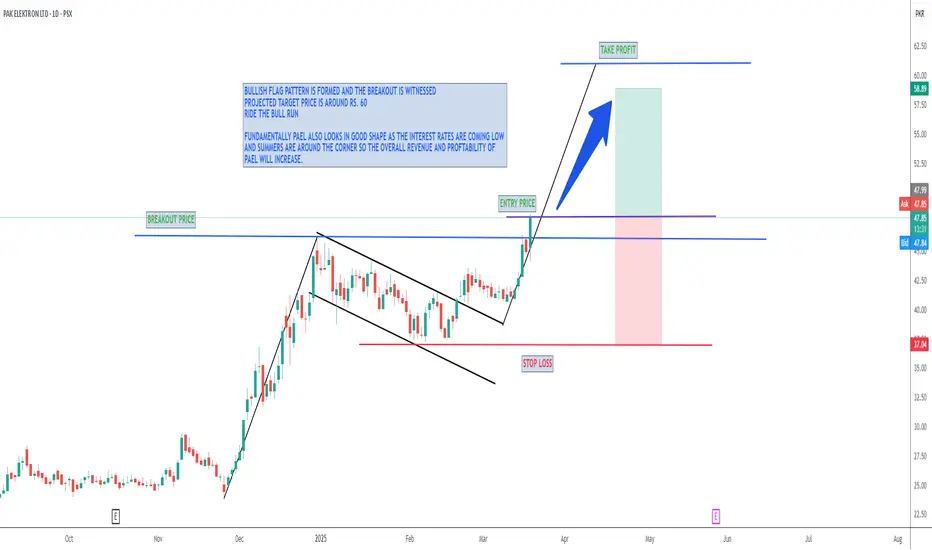
BULLISH FLAG PATTERN FOR THE PAEL LOVERS The script of PAEL looks in a good shape and forming bullish flag pattern. The price has triggered the breakout and now it seems it will touch the Rs. 60 mark soon.
The share is also fundamentally very strong and in the favorable time of the year to ride the trend.
Still BullishImportant to Sustain 675 - 680 to Reach
upside towards 700 - 725.
However, Immediate Support seems to be
around 630 - 633; and in Extreme case, it may touch
596 - 612.

Earnings, Trendlines, & Cyclic Momentum: PAEL at a Turning PointPre :
PAEL has shown strong financial growth, with Q1 2024 net profit surging 1,090% YoY to PKR 444.9 million, driven by eased import restrictions and market stability. For the nine months ending September 2024, profit after tax rose 97% YoY to PKR 1.863 billion, supported by a 35% revenue increase due to higher sales volumes and price adjustments.
Post :
the stock is trading in rising wedge pattern with support levels at PKR 43.58 and 40.50 and RSI indicates near overbought levels, potential short-term volatility. Main future outlook depends on government upcoming energy policies, increasing home solar systems market demand will intact,
Key on eyes upon 46-levels breaks above levels rally towards 54-58 PKR, aligning with the projected 15-20% gain.
