Bullish on Bigger TFImmediate Support is around 605 - 610
else, around 590 - 591
2 Possibilities:
1. If reverses from the current level, it may
touch 690 - 730 range.
2. If it does not sustain 590, it should come
down towards 570 ~ 555 range.
Weekly Support 558 should not break as this is
also the HL.

Hidden Bullish Divergence appeared.Hidden Bullish Divergence appeared.
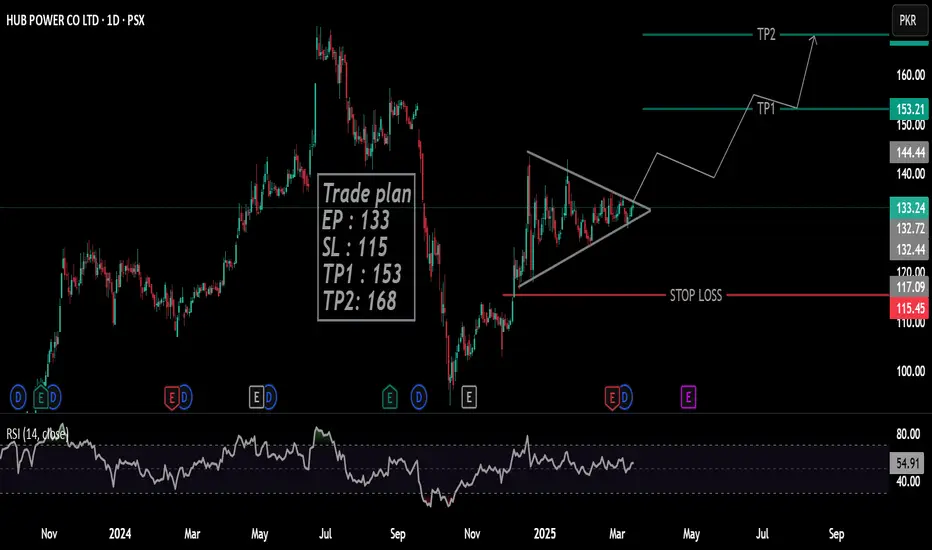
Breaking Out a long Consolidation Box around
145 - 149.
164 - 169 is a Strong Resistance zone.
If this Level is Sustained, we may witness
200+
However, if 135 - 136 is broken, more Selling
Pressure will be witness & it may drag the price
towards 113 - 115.

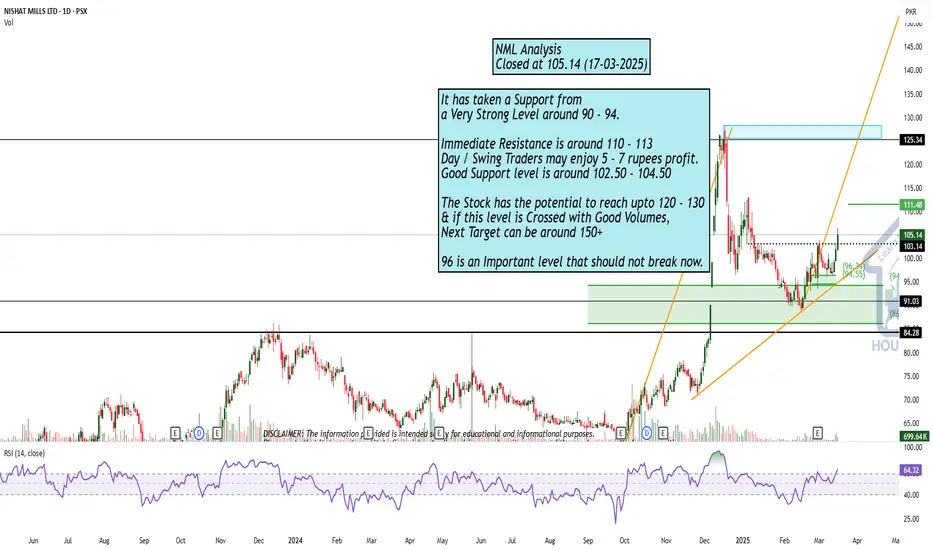
Good Trade SetupIt has taken a Support from
a Very Strong Level around 90 - 94.
Immediate Resistance is around 110 - 113
Day / Swing Traders may enjoy 5 - 7 rupees profit.
Good Support level is around 102.50 - 104.50
The Stock has the potential to reach upto 120 - 130
& if this level is Crossed with Good Volumes,
Next Target can be around 150+
96 is an Important level that should not break now.
PIBTL Price Forecast: Buy the Breakout or Wait for a Pullback?Current Price: PKR 9.71
Trading Strategy:
Entry Point: If the stock successfully breaks above the trendline (~PKR 10.00) with strong volume, enter a buy position.
Target Price: First target PKR 12.50, second target PKR 14.00.
Stop-Loss: Below the recent swing low (~PKR 8.50) to limit downside risk.

Mari-Nears Key Support – Potential Rebound Ahead?" ANSWER : YES
The price is approaching this trendline support, indicating a potential upward trend over time.

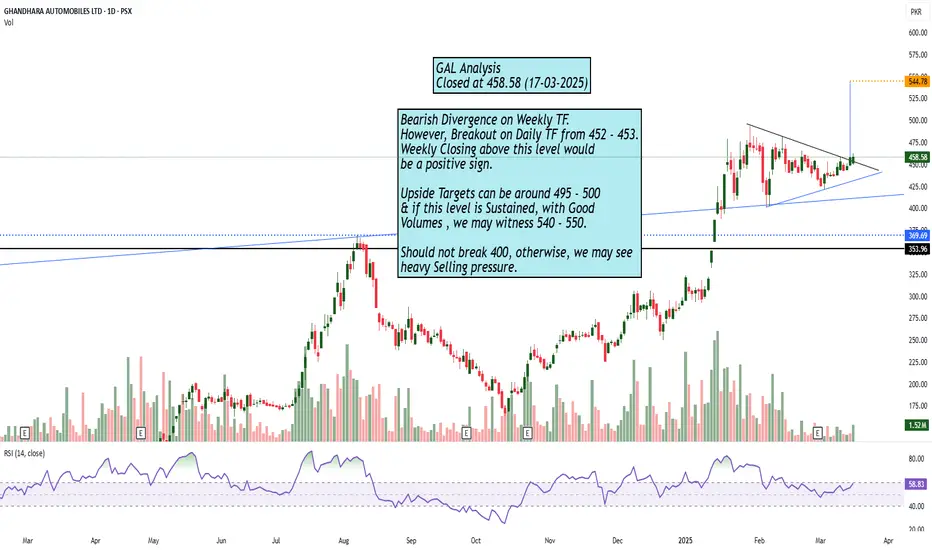
Bearish Divergence on Weekly TF but... there is a Breakout..Bearish Divergence on Weekly TF.
However, Breakout on Daily TF from 452 - 453.
Weekly Closing above this level would
be a positive sign.
Upside Targets can be around 495 - 500
& if this level is Sustained, with Good
Volumes , we may witness 540 - 550.
Should not break 400, otherwise, we may see
heavy Selling pressure.
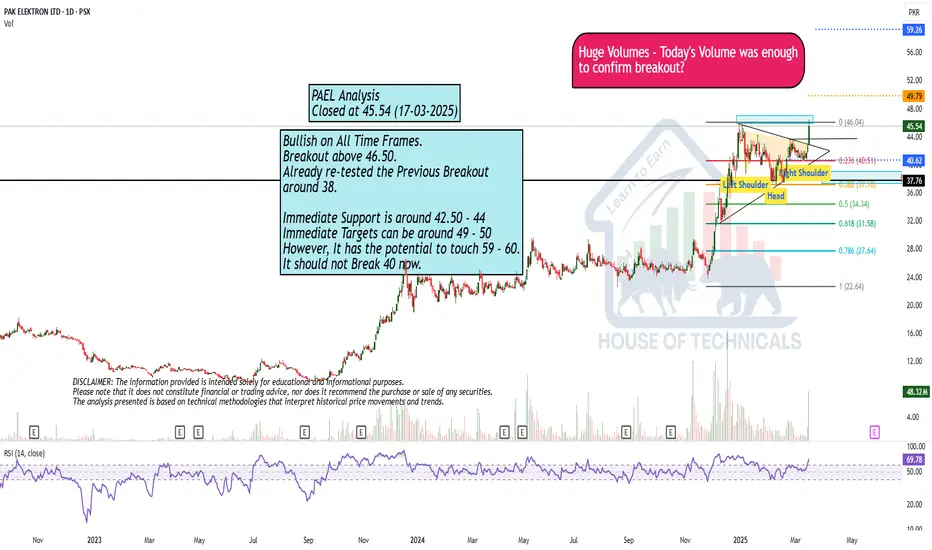
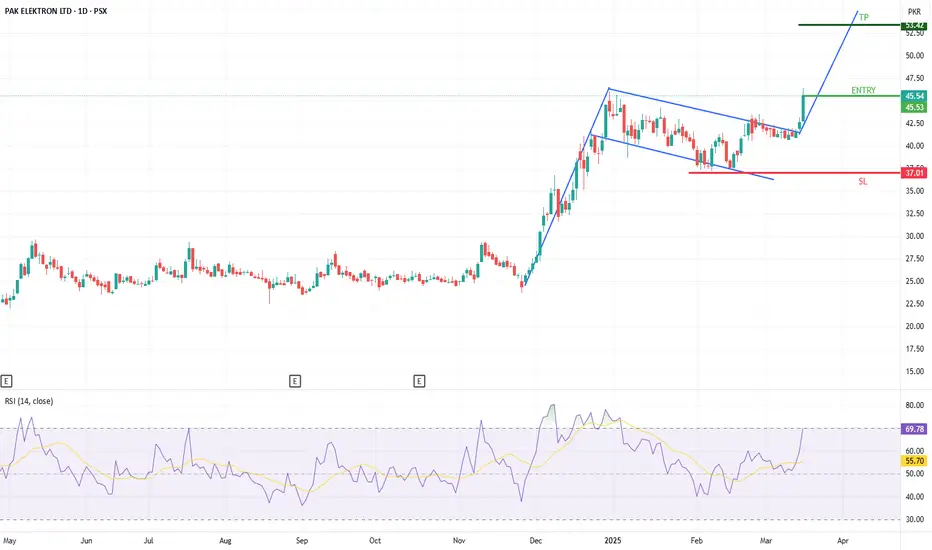
Bullish on All Time Frames.Bullish on All Time Frames.
Breakout above 46.50.
Already re-tested the Previous Breakout
around 38.
Immediate Support is around 42.50 - 44
Immediate Targets can be around 49 - 50
However, It has the potential to touch 59 - 60.
It should not Break 40 now.
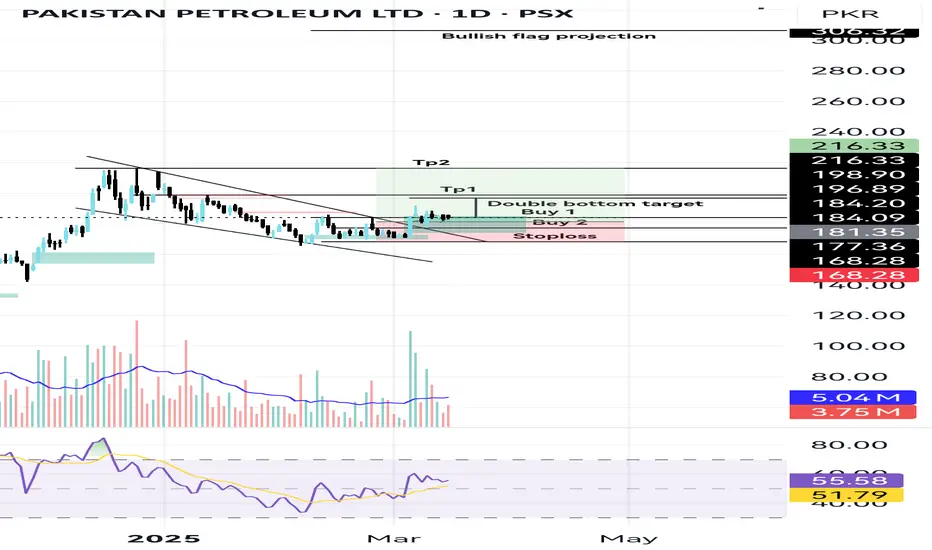
Pakistan Petroleum Limited. Trade PlanPpl has formed a falling wedge pattern. It has a given a breakout and also retested it.
Bullish on Monthly and Weekly timeframes.
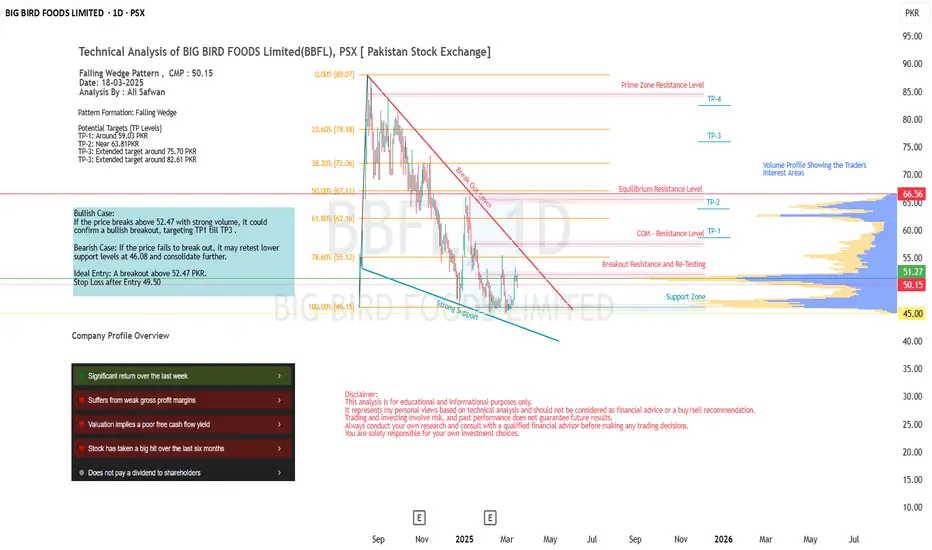
Technical Analysis of BIG BIRD FOODS Limited(BBFL), PSX
Technical Analysis of BIG BIRD FOODS Limited(BBFL), PSX
Falling Wedge Pattern , CMP : 50.15
Date: 18-03-2025
Analysis By : Ali Safwan
Pattern Formation: Falling Wedge
Potential Targets (TP Levels)
TP-1: Around 59.03 PKR
TP-2: Near 63.81PKR
TP-3: Extended target around 75.70 PKR
TP-3: Extended target around 82.61 PKR
Bullish Case:
If the price breaks above 52.47 with strong volume, it could confirm a bullish breakout, targeting TP1 till TP3 .
Bearish Case: If the price fails to break out, it may retest lower support levels at 46.08 and consolidate further.
Ideal Entry: A breakout above 52.47 PKR.
Stop Loss after Entry 49.50
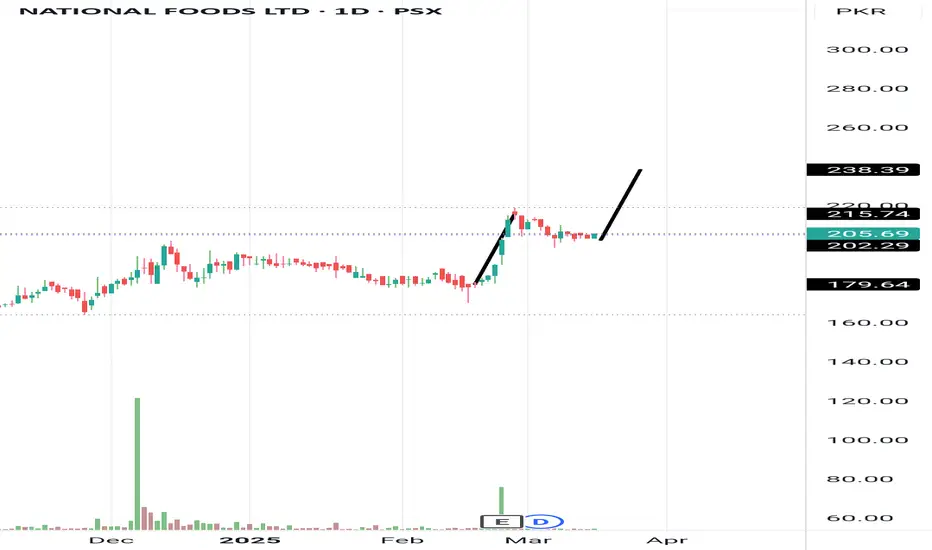
NATF - PSX - SHOWING a Flag PatternNATF Stock Analysis:
- *Buying Opportunity:* NATF is providing a buying opportunity.
- *Buying Range:* 205-200
- *Stop Loss:* 195
- *Target Levels:*
- Initial target: 215
- Final target: 238
- *Key Notes:*
- Hold the position until the target is reached.
- Use stop loss to minimize potential losses.
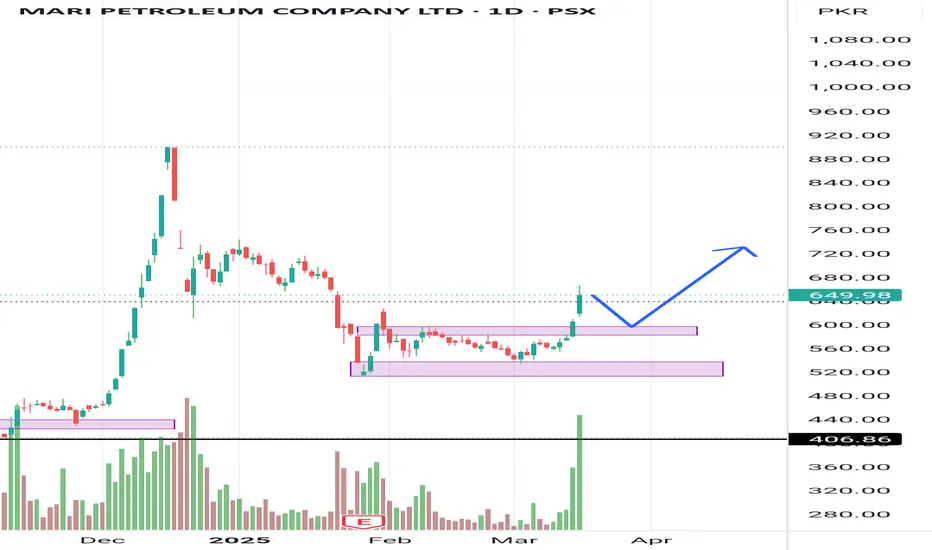
MARI ENERGYMARI Stock Analysis:
- *Bullish Movement:* MARI is showing a bullish movement.
- *Buying Opportunity:* Any weakness in the stock price is a buying opportunity, especially for new buyers.
- *Buying Range:* 600-580
- *Target Levels:*
- Initial target: 670
- Final target: 720
- *Stop Loss Strategy:* Use a trailing stop loss to lock in profits and minimize potential losses.
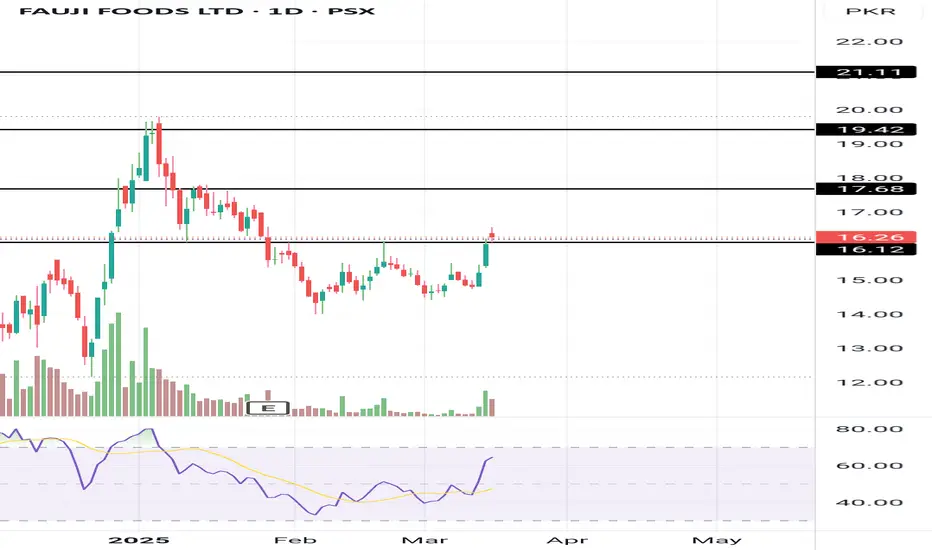
FFLFFL Stock Analysis:
- *Buying Opportunity:* FFL is providing a buying opportunity.
- *Strategy:* Adopting a "buy on dip, sell on strength" strategy.
- *Buying Range:* 16.26 - 15.30
- *Stop Loss:* 14.70
- *Target Levels:*
- First target: 17.50
- Second target: 19
- Final target: 21
PAEL formed bullish flag patternpael has submitted breakout on daily time frame formed bullish flag pattern which indicates bullish momentum, buying is recommended at current levels.
MARI - PSX - Beginning of a Bull Run MARI is the market leader of PSX. Historically, on time cycles it has shown consolidation period of 43 days before going into a bull run spanning around 32 days. Price after making the falling wedge has broken the structure upwards and now has even crossed the recent Lower High 627.40 as well - which signals a trend reversal towards bull run.
Very good volumes are also experienced which are also confirmed by KVO which is a volume-based oscillator (blue line is almost at 60 degree angle going up). RSI is at 70 without any sign of reversal. Therefore, it would be a fair bet that we might see another cycle of bull run which should cross the previous all-time high (900.23) calculated on the basis of AB=CD or Fib based Extension tool.
A minor retrace at key levels is expected where one should book profit.
Trade Values
Buy-1: 649
Buy-2: 630 (if price dips)
TP-1: 740
TP-2: 840
TP-3: 900
TP-4: 1030
SL: 535

BreakoutBreakout on Daily TF.
Good Buying Range: 98 - 99
It has the potential to touch
110 - 113 initially.

MARI PROBABLY IN WAVE 'C' or '3' - LONGMARI is most probably in wave C or 3 which will be clarified will volume, as 3rd waves have the highest volume in general. We already have an active trade in this which I missed out to publish earlier but I'm doing my best to post it now.
If either wave C or 3 count is correct then we are heading up but as I've taught we should always have an alternate wave count and in this case the best alternate count is a wave B correction.
Wave B corrections can take any corrective pattern shapes therefore are very hard to pin point its wave count until it is completed, however the direction is still same but targets will get squeezed if its a B wave. Also the volume will not be as much of an impulse wave.
Let see how this plays, Good Luck !
Disclaimer: The information presented in this wave analysis is intended solely for educational and informational purposes. It does not constitute financial or trading advice, nor should it be interpreted as a recommendation to buy or sell any securities.

THCCLTHCCL analysis
Trying to in into daily channel
If successful then will touch channel top around 310

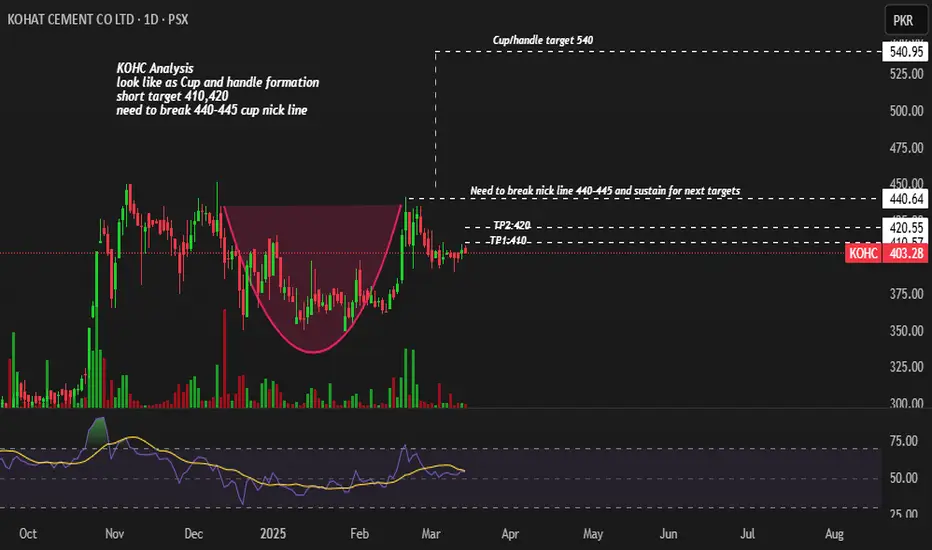
KOHCKOHC Analysis
look like as Cup and handle formation
short target 410,420
need to break 440-445 cup nick line
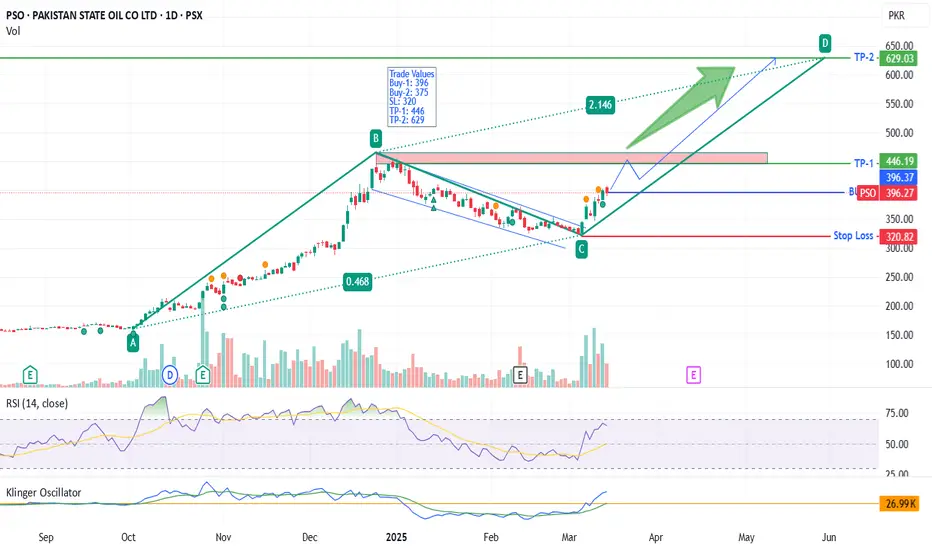
PSO - PSX - SWING Trade CallOn daily TF, PSO has broken the falling wedge and now is moving upwards.
Only likely resistance zone is close to previous all-time high.
AB=CD Harmonic pattern has been drawn. KVO is moving upwards indicating bull run with RSI also testing 60.
It is a good opportunity for getting into the SWING trade now spanning over around three months.
Trade Values
Buy-1: 396
Buy-2: 375
SL: 320
TP-1: 446
TP-2: 629
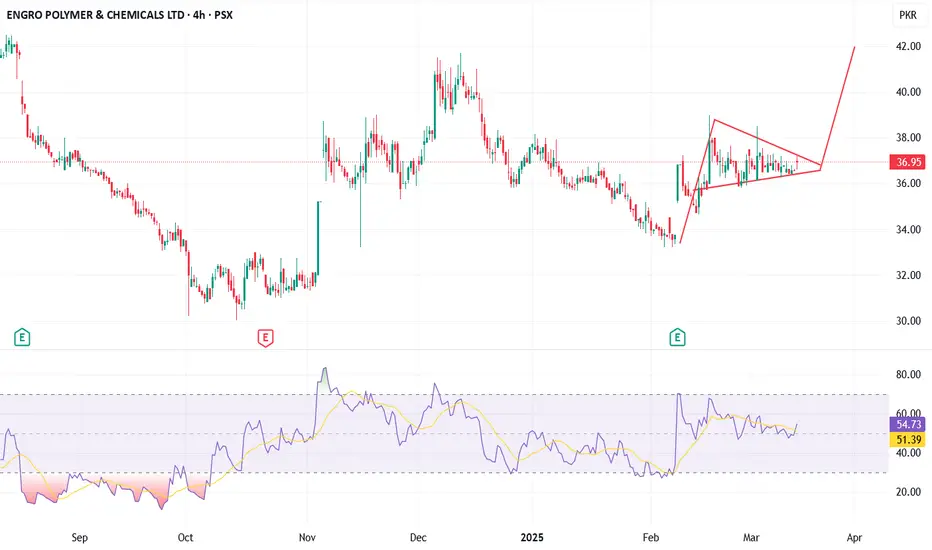
EPCLA symmetrical triangle trade involves entering a position after price breaks out of a converging triangle pattern. Trade with confirmation (volume increase) and set stop-losses outside the pattern to manage risk.
ATRL*ATRL Analysis
*AB=CD Pattern formed in daily time frame
*660 Important Resistance if break then will go up
*Till Now no any Negative sign formed

PSX - SSGC - Starting Bullish Trend PSX - SSGC - Starting Bullish Trend on daily time frame, and posting HH
