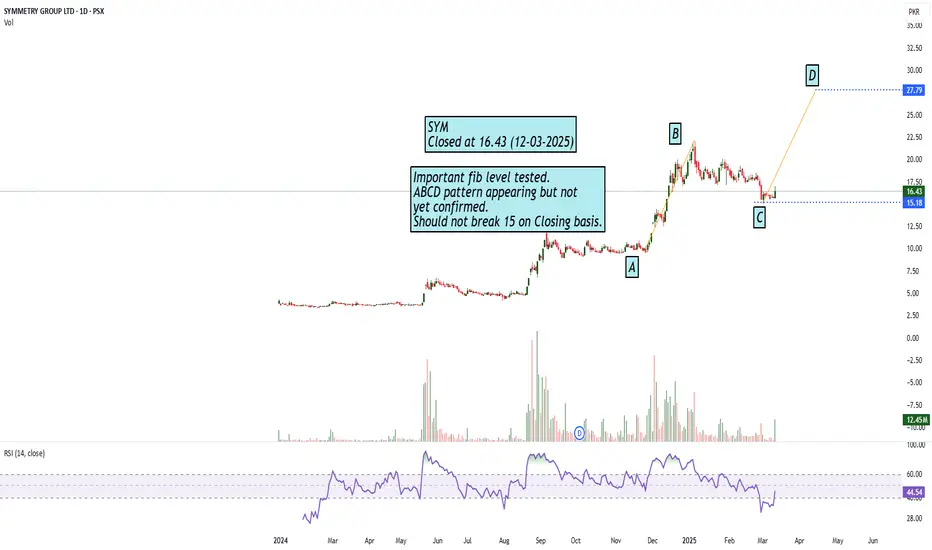
ABCD Pattern appearingImportant fib level tested.
ABCD pattern appearing but not
yet confirmed.
Should not break 15 on Closing basis.
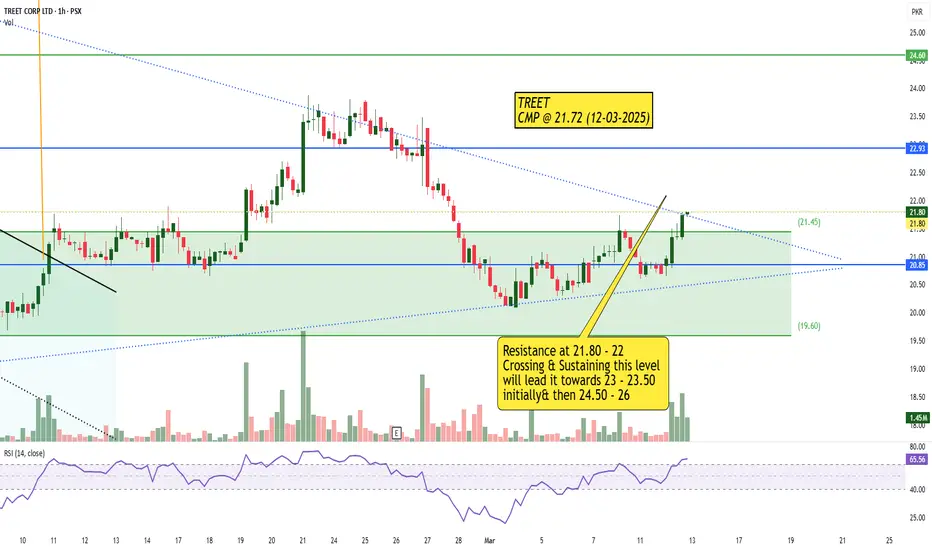
Breakout ExpectedResistance at 21.80 - 22
Crossing & Sustaining this level
will lead it towards 23 - 23.50
initially & then 24.50 - 26
Double BottomDouble bottom with Bullish Divergence
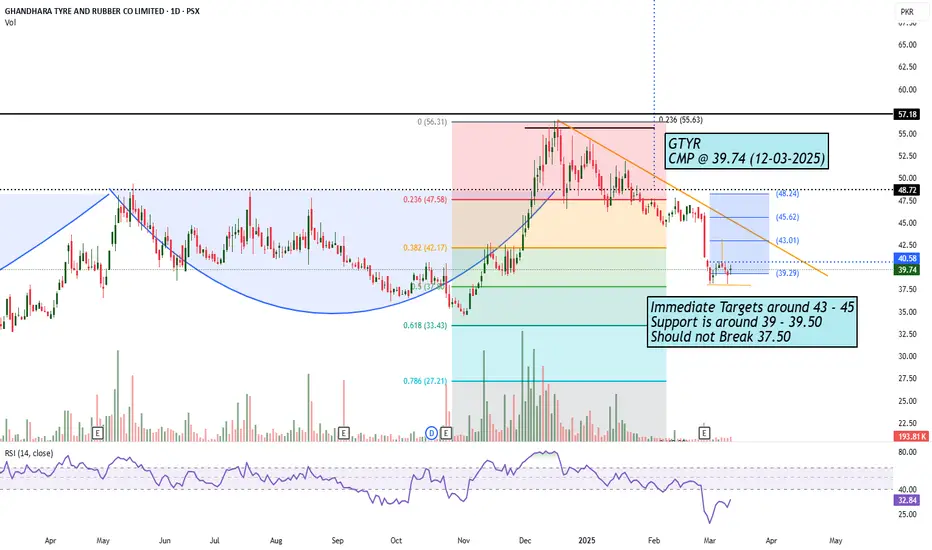
Immediate Targets around 43 - 45
Support is around 39 - 39.50
Should not Break 37.50
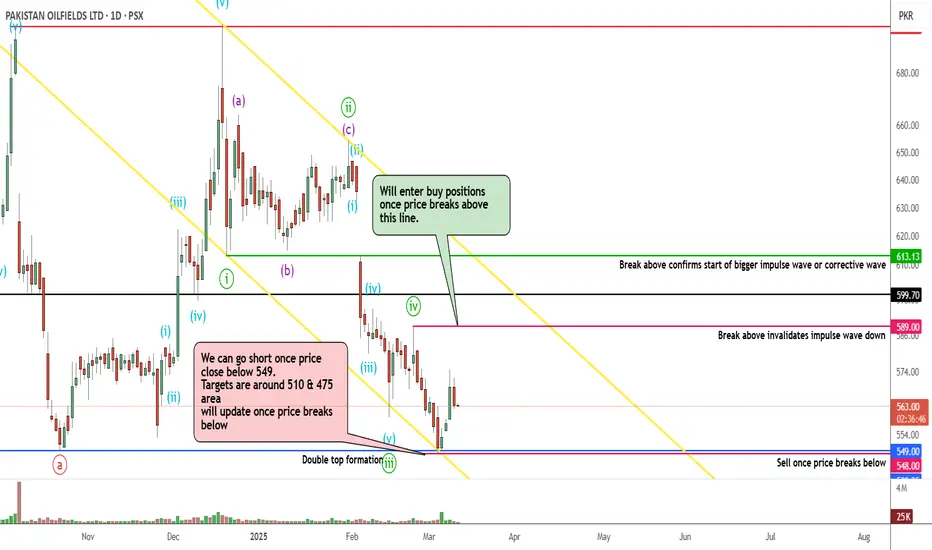
POL PROBABLY IN WAVE 'C' OF CORRECTIVE PATTERN DOWNPOL is most probably in a corrective wave down which has started after a strong impulse wave up. Currently the market is in wave C of the corrective pattern downwards.
As per our prefer count, on the minor level we are currently in the 5 wave of Wave C, which is either complete or will get extended further down. Once the price closes below 549 it will open targets for wave 5 extension levels as per Elliott wave rule. Also in addition it will give confidence in the Double Top pattern and we can use the chart pattern as well to determine the targets. Remember volume is the key indicator here.
On the other hand if the wave 5 of Wave C is over, then we are in 1 or A wave of an impulse or corrective wave up. The formation of the wave will help us determine the upside targets if price does break above last swing high.
Let see how this plays, Good Luck !
Disclaimer: This is for informational purposes only; anyone taking trades using this idea will be liable for their own profit or loss.
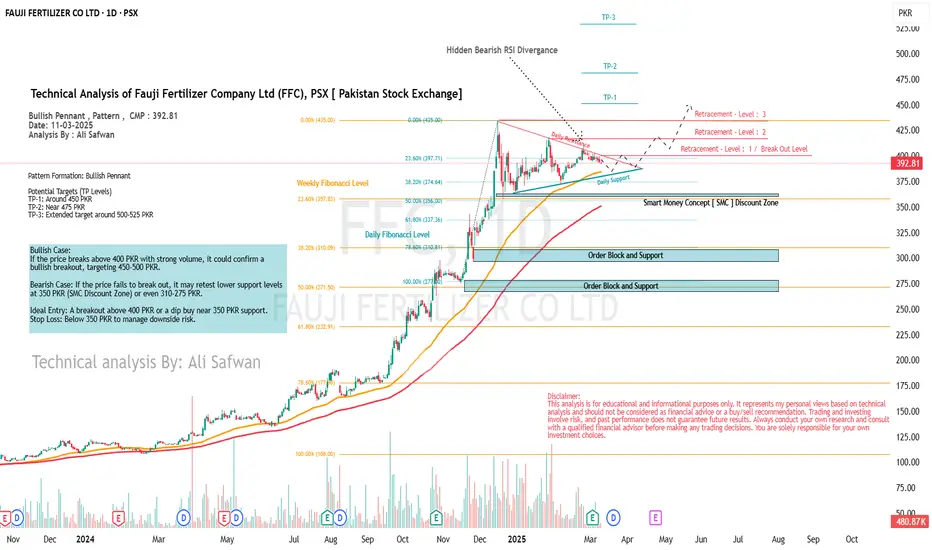
Technical Analysis of Fauji Fertilizer Company Ltd (FFC), PSX
Technical Analysis of Fauji Fertilizer Company Ltd (FFC), PSX
Bullish Pennant , Pattern , CMP : 392.81
Date: 11-03-2025
Analysis By : Ali Safwan
Pattern Formation: Bullish Pennant
Potential Targets (TP Levels)
TP-1: Around 450 PKR
TP-2: Near 475 PKR
TP-3: Extended target around 500-525 PKR
Bullish Case:
If the price breaks above 400 PKR with strong volume, it could confirm a bullish breakout, targeting 450-500 PKR.
Bearish Case: If the price fails to break out, it may retest lower support levels at 350 PKR (SMC Discount Zone) or even 310-275 PKR.
Ideal Entry: A breakout above 400 PKR or a dip buy near 350 PKR support.
Stop Loss: Below 350 PKR to manage downside risk.
Disclaimer:
This analysis is for educational and informational purposes only. It represents my personal views based on technical analysis and should not be considered as financial advice or a buy/sell recommendation. Trading and investing involve risk, and past performance does not guarantee future results. Always conduct your own research and consult with a qualified financial advisor before making any trading decisions. You are solely responsible for your own investment choices.
PSX PRL : Entry Points, Targets (Gain 15%--30%)Current Price: PKR 34.18
Entry Point: Around PKR 31 - 33, as this is a key demand zone
First Target: PKR 38 (Short-term resistance level)
Second Target: PKR 42 (Major resistance zone, where selling pressure might appear)
Risk Consideration:
If the stock fails to hold PKR 30, it may enter a further bearish phase.

GTYR LongRespected its Channel Bottom and will now move upwards towards its next targets i.e. 60
Breaking 60 will lead to its new highs i.e. 73 and 95. Stop loss remains at 38

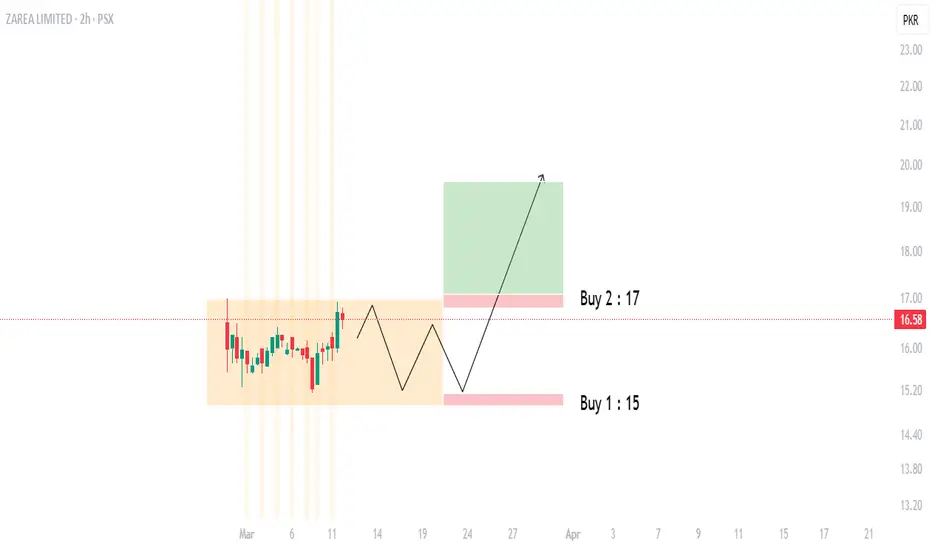
Zarea Limited (ZAL) : From Accumulation Phase to Bullish Phase Accumulation Phase:
Currently The stock is consolidating in a range-bound phase, A breakout above PKR 17 could trigger bullish momentum .
Demand Zone 1 : 15
Demand Zone 2 : 17
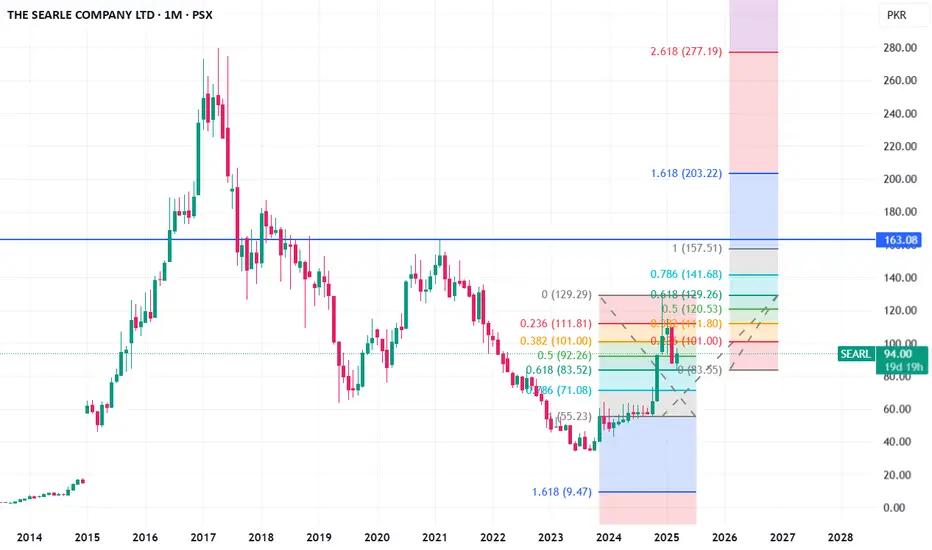
SEARL LongTouching 129 recently, SEARL retraced back to Fib 0.618 level (84) and now in an upward trajectory.
Next targets will be 129, 163, 203 and then 277 (Its all time high).
Immediate resistance levels are 101, 112 and 120
Support levels are 84 and 71. Stop loss is 71
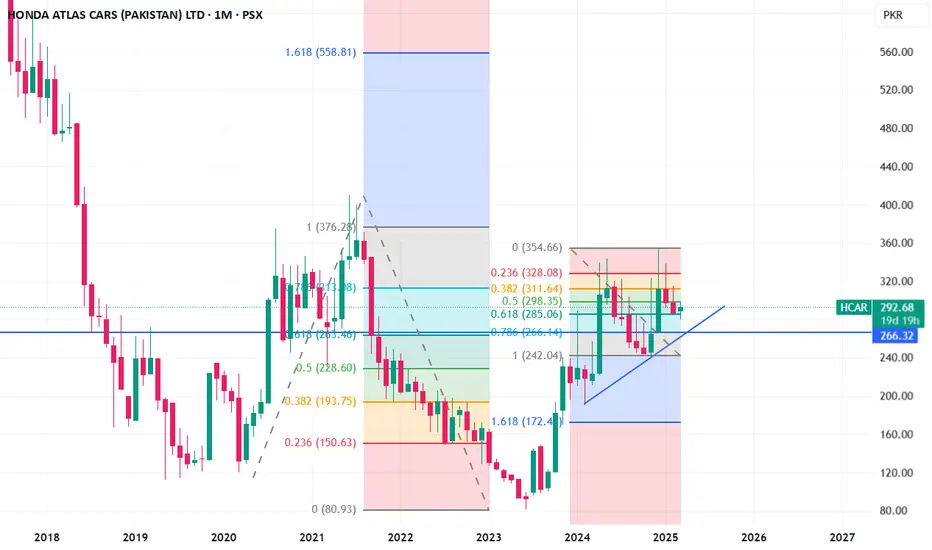
HCAR Way ForwardRespecting its trend line, HCAR can take a correction till 266.
Its Next targets can be 558 once it breaches its recent high of 355.
Short term resistance areas are 298, 311, 328 and 355.
Support areas are 285 and 266. Stop loss 244.
Short term trade in PIOC , H1 time frameBuy PIOC@ 220, near trendline support , for TP @220 and stoploss below 295

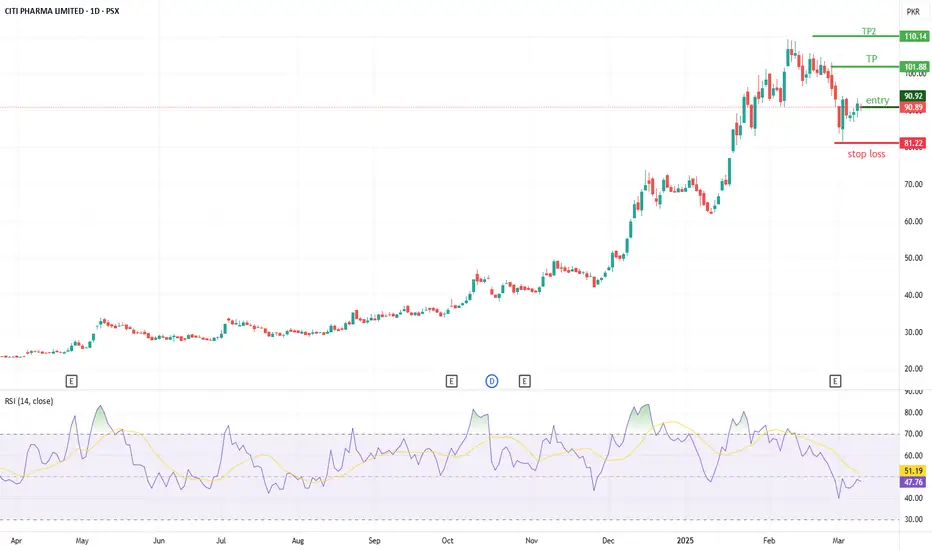
CPHL is showing upward momentumCPHL is in upward trend, currently price has taken good correction and know showing upward signs. Good time to buy at current price.
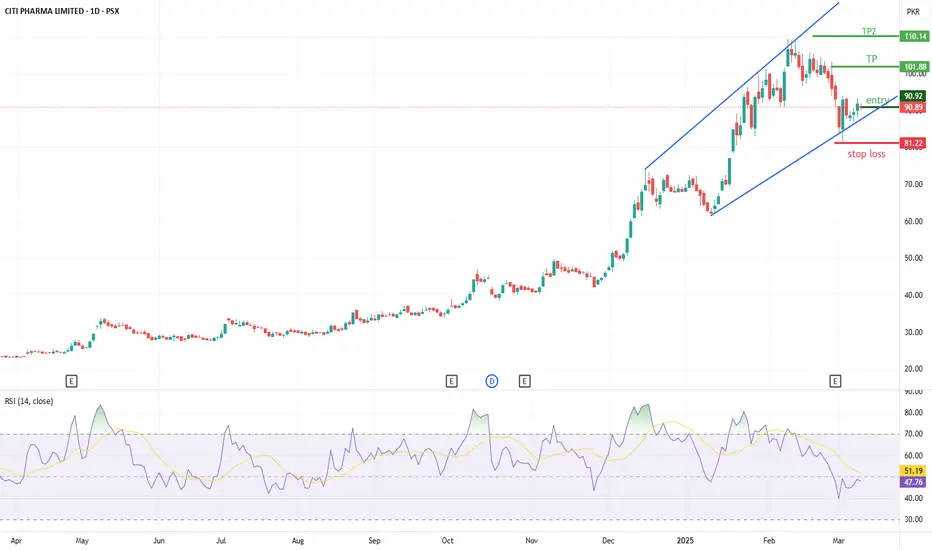
CPHL is showing upward momentumCPHL is in upward trend, currently price has taken good correction and know showing upward signs.good time to buy at current price.
THCCL - PSX - Daily TF - LONG (Buy) Trade call RSI 14 indicator is above 70 line and there is no bearish divergence yet.
Klinger Oscillator is above '0' indicating a bullish state; however, Klinger Oscillator (Blue) is yet to cross over the trigger line (green).
EMA 89 line is also below the price chart indicating a bull run.
AB=CD Pattern has been drawn for TP1.
Pole and Flag pattern has been drawn for TP2.
THCCL - LONG (Buy Call)
Buy : Instant @ Market price : 94~95
TP1: 120.35 (Expected TP 22 Oct 2024 )
TP2: 130.25

FCCL - PSX - Technical AnalysisFauji Cement Co Ltd (FCCL) share price is almost at Daily Channel Support Level. Technically, price may bounce from this support.
However, a SHARK Harmonic pattern has been drawn (93% compliant) which if followed will drop the prices significantly. KVO is dipping below zero level indicating a Bear run; additionally RSI is also dipping which supports the dropping of prices. Until and unless some fundamental element or good news kicks in price should go till Buy-2 level. In case price drops below 29 then price will free fall till 29.27.
Trade Values
Buy-1: 34.07
Buy-2: 33.87
SL: 29.27
TP-1: 40
TP-2:47

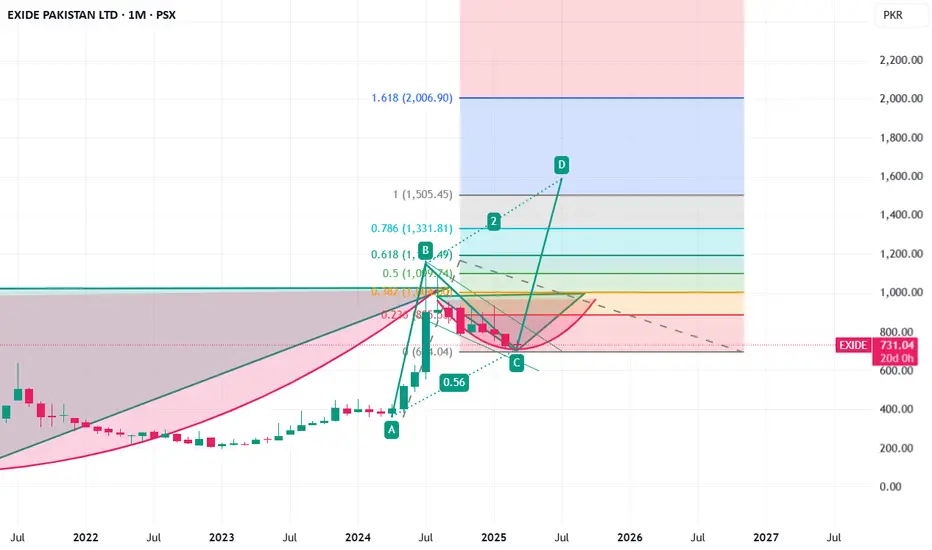
Exide Pakistan - LongExide is making multiple bullish patterns
1- Inverse head and shoulder
2- Cup and Handle
3- Bullish Flag
4- ABCD pattern
It may go down to 670 at the worst, but may also revert back from here to complete CD leg which may touch 1600.
Short term target: 1100
Medium term target: 1600
Long term target: 2000
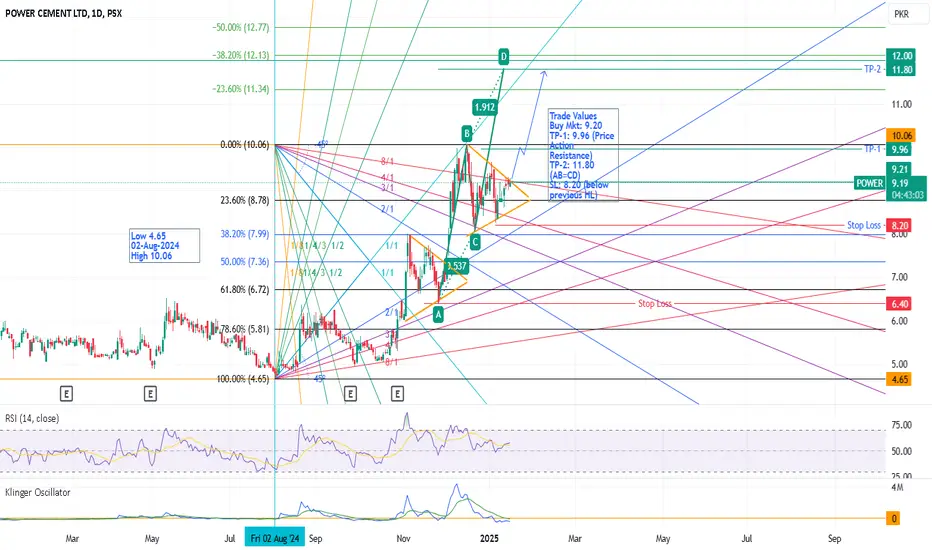
POWER - PSX - Tech AnalysisPower after the pressure of selling has started to recover.
Price is just under the 8/1 resistance line of upper Gann fan. Once price crosses it then this line will start acting as support. Just see the repetition of the triangle pattern (Orange).
RSI is also moving upwards and at present it is around 57, therefore, there is sufficient room to consider retracement which previously happened at 75 and 86 respectively.
KVO is just below zero level but likely to catch up.
Trade Values
Buy Mkt: 9.20
TP-1: 9.96 (Price Action Resistance)
TP-2: 11.80 (AB=CD)
SL: 8.20 (below previous HL)
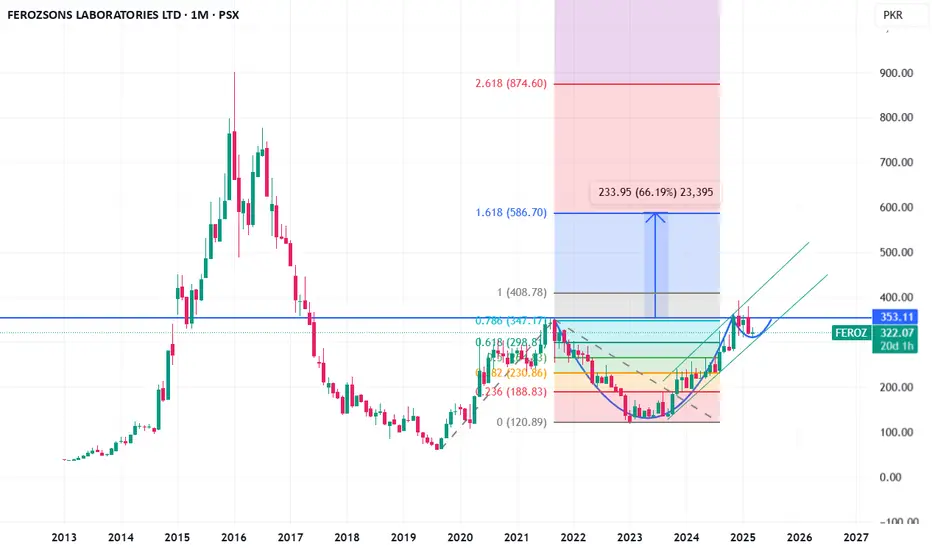
Feroz - Long Feroz is making cup and handle formation. Further, it is in an upward trend, breaking which may lead it to go beyond 550 (Exact medium term targets mentioned in chart). In the longer run, (1.5 to 2 years), it may again touch its all time high (900+).
FCCL - PSX - Buy Trade CallFundamentally, FCCL is progressing steadily. Its recent quarterly report ending Dec 2024 is a little bit better than previous quarter ending Sep 2024. Similarly, as compared to previous year same quarter, its revenue has almost jumped 25% (from 20B Dec 2023 to 25B 2024). Historically, Quarter ending March shows some lesser revenue due to bit lesser sales during winter season whose impact is depicted in March. Therefore, it should not be a big surprise if earnings drop in quarter ending Mar 2025. However, share price might take a minor correction before moving up. This is potentially a very good SCRIPT whose share price may be doubled in next 10 months by end Dec 2025. Therefore, it can be kept as an Investment stock.
Technically analyzing the script, we see that it is moving upwards in a regression channel. Also Daily Support line has always been honored by the SCRIPT since going into bull run in Aug 2024. Price is well above EMA 89 suggesting continuation of bull run. Presently the price is above EMA 21 and since it is likely to act as a magnet, therefore, price should drop a little to test this line (BUY-1). Additionally, potential Cypher Harmonic pattern has been drawn, which if complied then price can even test that zone too (BUY-2).
There is no divergence on RSI and RSI still has some room to get into potential reversal zone. However, volumes are a bit low. KVO indicator is dipping on trigger line below Zero level also suggest minor dipping in price is expected to test Buy-2 level.
Trade Values
Buy-1: 40.66
Buy-2: 38.74
SL: 36.02
TP-1: 49
TP-2:59

Some Positivity Seen...0.5% Fib level retracement &
Also, Confirmed HL around 29 - 30.
Important Support lies around 32.50 - 34.70
Should not Break 29, otherwise, we may witness
further Selling Pressure.
If 36.30 is Sustained, we may witness 38 - 38.50
which is again a Strong Resistance.
Stock will be in uptrend again if is Sustains 38.50
& it may hit 49 - 50 again. Also because , it seems
as now it is Re-testing the Breakout level around 34.50 - 35.

HBL PROBABLY IN WAVE 'A' OF CORRECTIVE PATTERN DOWNHBL is most probably in a corrective wave down which has started after a strong impulse wave up. Currently the market is in wave A of the corrective pattern downwards.
As a good practice one should always look into an alternate wave count, my alternate count
suggests that we are in a bigger WXYXZ corrective wave upwards and currently are in wave Y
which is almost complete and suggest price to move upwards.
My preferred wave count is ABC pattern down with a target price range around 122, We will
enter long positions around that range OR We will enter long positions once price break above blue resistance line of wave Y
Also in addition to our ABC wave count down a Double Top pattern has emerged, double top pattern has a high pullback percentage therefore anyone who wants to short sell the stock should wait for the price to break below the last swing low.
Remember volume is the key indicator here if the price does break the last swing low.
Let see how this plays, Good Luck !
Disclaimer: This is for informational purposes only; anyone taking trades using this idea will be liable for their own profit or loss.

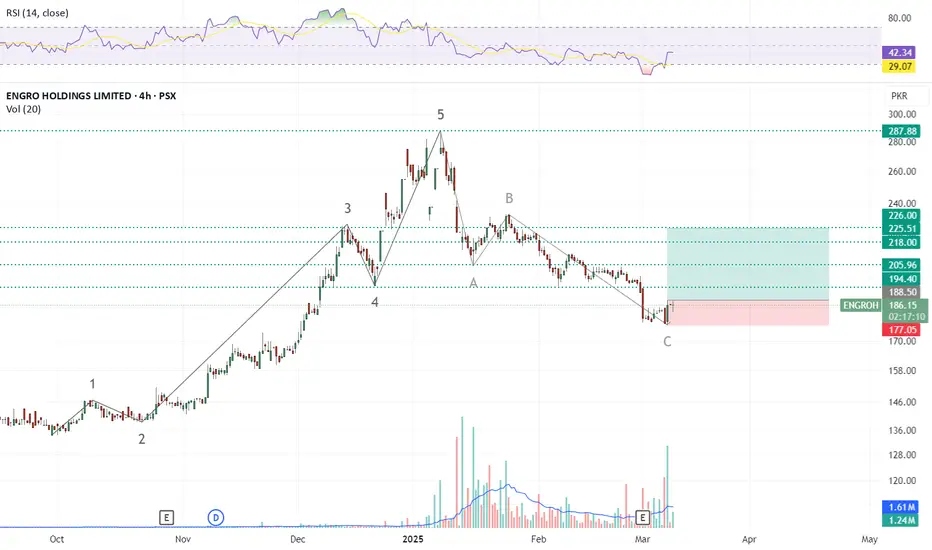
ENGROH Possibly Established A LowENGROH (184.50) has completed the 61.8% Fibonacci retracement of its 134.36 to 287.88 rally at 179.76, marking a decline of over 35% from its January 2025 high of 287.88. Based on my wave count, the correction appears to be complete, with a potential low established at 177.05.
A sustained move above 188.50 would confirm emerging strength, initially targeting 194.60. Such a move would reinforce the bullish reversal structure, setting the stage for a minimum upside towards 206.30, with the potential to extend to 226.
Traders should closely monitor price action above 188.50, particularly on expanding volume, as this would provide a strong buy signal for further upside.
GGL- PSX - Symmetrical TriangleGGL has formed a symmetrical triangle in the 1D time frame. Look for the upward breakout or downward breakdown for bullish or bearish entry accordingly.
