HL Confirmed on Weekly.HL Confirmed on Weekly TF around 92.
Bullish Divergence on Daily TF.
Crossing 107 with Good Volumes
may lead it towards 112 & then 120+

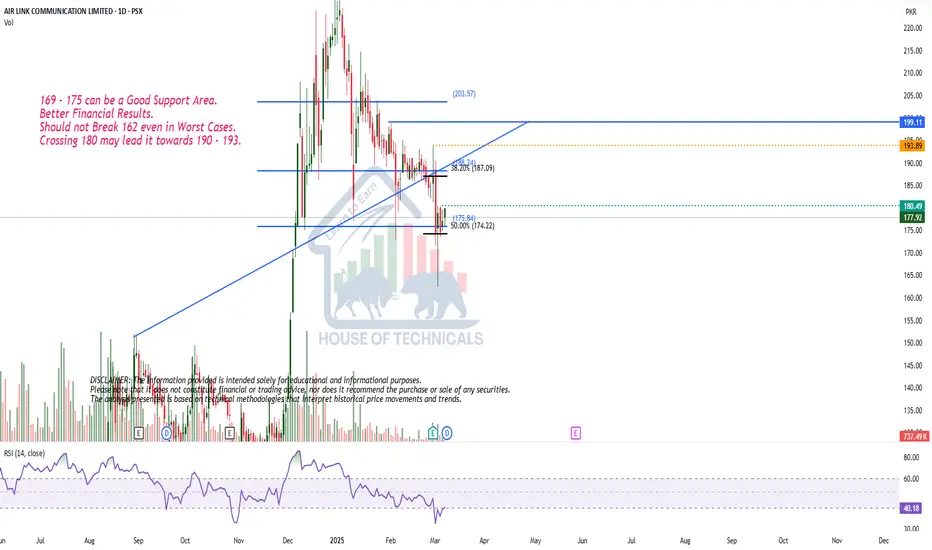
Good Financial Results.169 - 175 can be a Good Support Area.
Better Financial Results.
Should not Break 162 even in Worst Cases.
Crossing 180 may lead it towards 190 - 193.
THCCL- PSX - Technical AnalysisTHCCL price has made a wedge which is an indication of price going up any time. RSI has already bounced from 30 and moving upwards. Klinger is just hinting at likely beginning of the bull run for this SCRIPT.
Fundamentally, from cement sector, this will show progress as sales will be substantial during post Ramadan and pre-monsoon (April ~July). Coupled with company has already shifted its power requirements to solar energy, therefore manufacturing cost cutting is eminent.
This SCRIPT can be kept in portfolio for investment point of view as well since prices are already very discounted.
Trade Values:
Buy-1 :189.58
Buy-2: 167.08
TP-1: 233.36
TP-2: 255.66
TP-3: 305.41 (For SWING TRADE 6 months Plus)
TP-4: 336.62 (For SWING TRADE 6 months Plus)
SL: 159.88

PAEL - PSX - Daily - Technical AnalysisPAEL is in sideways zone. It has established a support zone at Fib 38.20% by bouncing twice from there. Another dip is quite possible. Resistance zone is quite large and it is expected that it may take a month to break across it.
Therefore, Buy on dip will be the way to go.
Trade Values
Buy-1: 38.11
SL: 36.80
TP-1: 43.49
Buy-2: 46.61
SL-2: 43.20
TP-2: 57.10
TP-3: 59.24

CNERGY - Daily - Technical AnalysisCNERGY has been in the consolidation for quite some times and it may continue to play in that zone. Technically very correct Buying (Buy-2) is recommended once price breaks the resistance zone.
However, price has been following ascending parallel channel as well, and at the moment it is close to the support line. Therefore, it may continue to go up. However, if this line is breached than price may slip to further lower values. Therefore, for day trading at CMP (BUY-1), a tight SL is recommended.
RSI indicator is also moving slowly upwards and Klinger is also laying low close to zero. Therefore, these are in a neutral zones hinting at the reluctance of traders in this SCRIPT.
Trade Values
Buy-1 (CMP) : 7.58
TP-1: 7.90
SL-1: 7.08
Buy-2: 8.20 (Technically better)
TP-2: 11.00
SL-2: 7.95

MLCF WEEKLY TIME FRAME AND TRADE IDEAMLCF GAVE A BREAKOUT AT THE ACCUMULATION BOX. THE STOCK IS HEADING TO WEEKLY STRONG RESISTANCE AT 50.92
BUT EXPECTED TO BREAKOUT DUE TO THE SENTIMENT AND THE DESECENDING ACCUMULATION JUST BEFORE THE WEEKLY BREAKOUT LOOKS LIKE A CONFIRMATION. LOOKS LIKE THAT
THE BIG PLAYERS HAVE FILLED UP THIER BAGS AND READY FOR THE BREAKOUT
HOWEVER THIS MIGHT BE PLAYED NEXT WEEK OR IN THESE NEXT FEW DAYS
WATCH FOR PRICE ACTION ON H2 AND H4
BREAKOUT AT 50.92 will start a new quick rally however a retest might be possible at the breakout level at 50.92 to 5. The next target will be 58 to 59.
watch for order flows in orderbook. and look for the 5m timeframe above vwap session near breakout

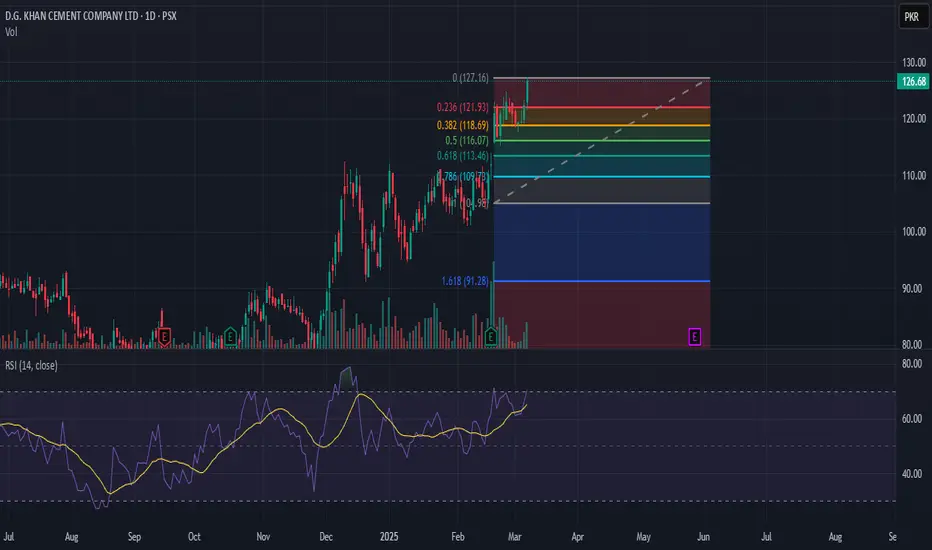
DGKC Hits New Highs! Breakout or Reversal Ahead?D.G. Khan Cement (DGKC) is showing strong bullish momentum, breaking past key resistance levels. Currently trading around 126.68 PKR, the stock is hovering near a crucial breakout zone at 127 PKR. If it sustains above this level with volume, we could see further upside. However, a failure to hold could lead to a pullback towards key Fibonacci retracement levels.
The Golden Ratio (0.618 level at 113.46 PKR) is a significant support zone, often considered an ideal level for potential reversals. Other support levels include 121-118 PKR (0.236 and 0.382 Fibonacci levels), which could act as strong demand zones if a correction occurs.
Meanwhile, the Relative Strength Index (RSI) is near overbought territory, indicating strong buying pressure but also a potential risk of short-term exhaustion. If bulls maintain control and push beyond 127 PKR, DGKC could enter a new rally phase. However, if the price faces resistance, we might see a healthy retracement before another move higher.
With the stock at a decisive point, traders must watch whether this breakout sustains or turns into a false signal. Will DGKC continue its bullish trend, or is a correction on the horizon? Let me know your thoughts below!
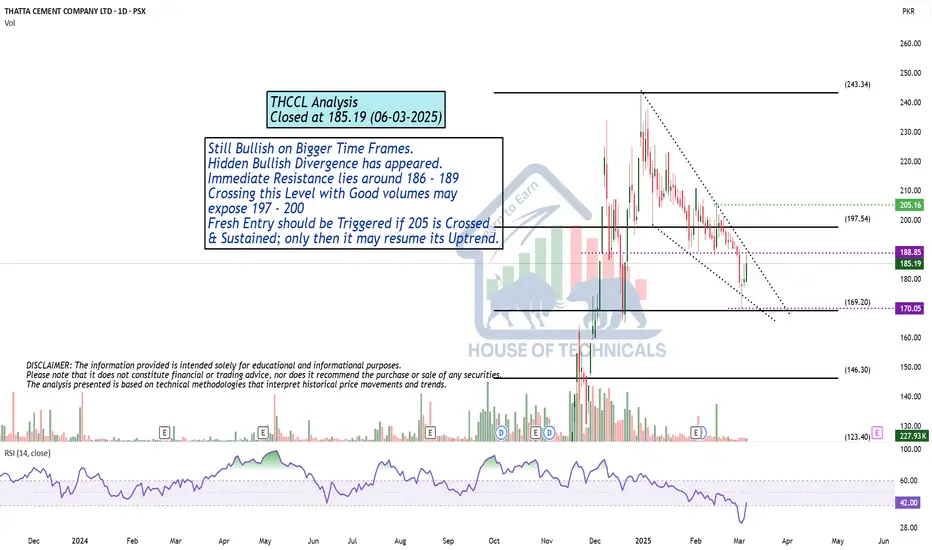
Still Bullish on Bigger Time Frames.Still Bullish on Bigger Time Frames.
Hidden Bullish Divergence has appeared.
Immediate Resistance lies around 186 - 189
Crossing this Level with Good volumes may
expose 197 - 200
Fresh Entry should be Triggered if 205 is Crossed
& Sustained; only then it may resume its Uptrend.
Same Support level tested againUpdate as on 06-03-2025
Support level that was
mentioned a month ago, again played
well.
Now again 600 - 630 is the resistance for now.

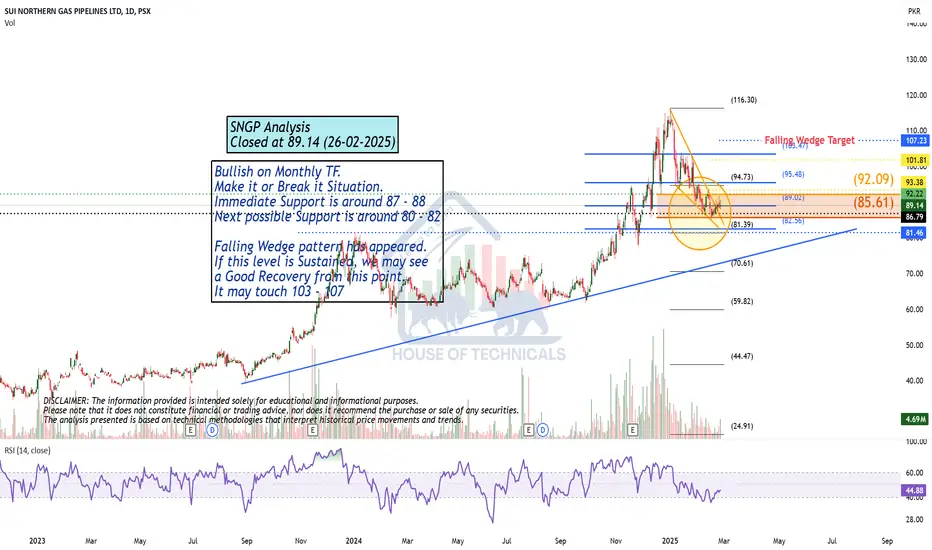
Bullish on Monthly TF.Bullish on Monthly TF.
Make it or Break it Situation.
Immediate Support is around 87 - 88
Next possible Support is around 80 - 82
Falling Wedge pattern has appeared.
If this level is Sustained, we may see
a Good Recovery from this point.
It may touch 103 - 107
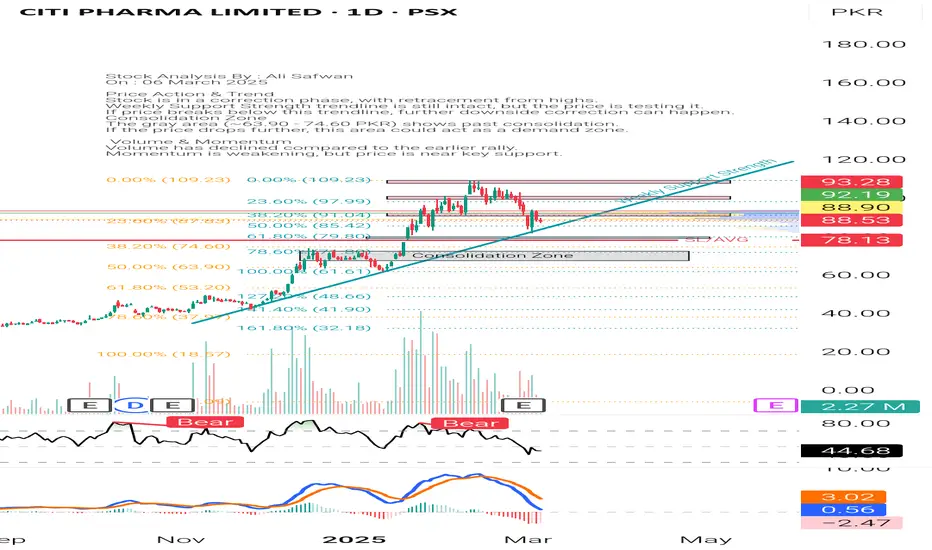
CPHL Analysis Stock Analysis By : Ali Safwan
On : 06 March 2025
Price Action & Trend
Stock is in a correction phase, with retracement from highs.
Weekly Support Strength trendline is still intact, but the price is testing it.
If price breaks below this trendline, further downside correction can happen.
Consolidation Zone
The gray area (~63.90 - 74.60 PKR) shows past consolidation.
If the price drops further, this area could act as a demand zone.
Volume & Momentum
Volume has declined compared to the earlier rally.
Momentum is weakening, but price is near key support.
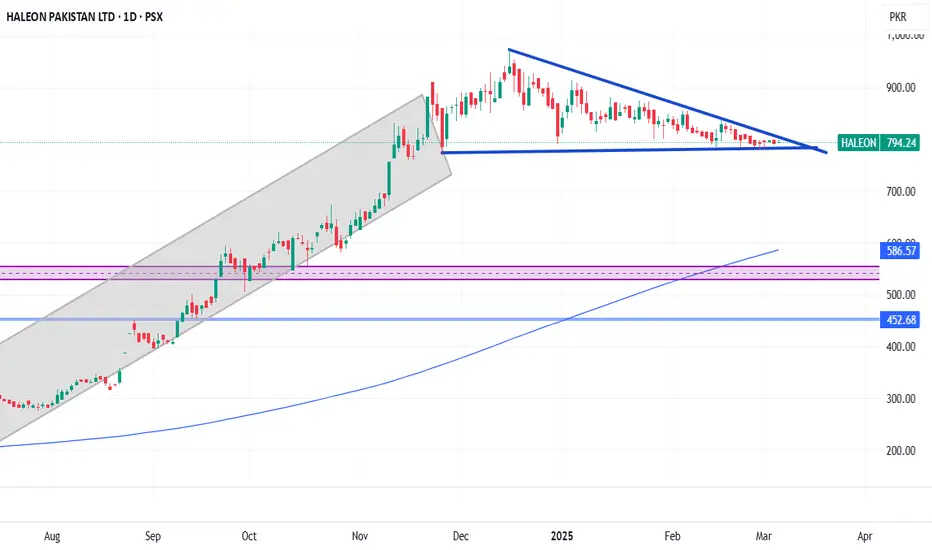
Good 2024 result. Price action is waiting for sentimentThe company gave good EPS for the year ended Dec 2024.
Now it is waiting for the micro economy fundamentals. A lower interest rates will lead the price to break the triangle up side. the target price is 1170
Else going more down till 580 area
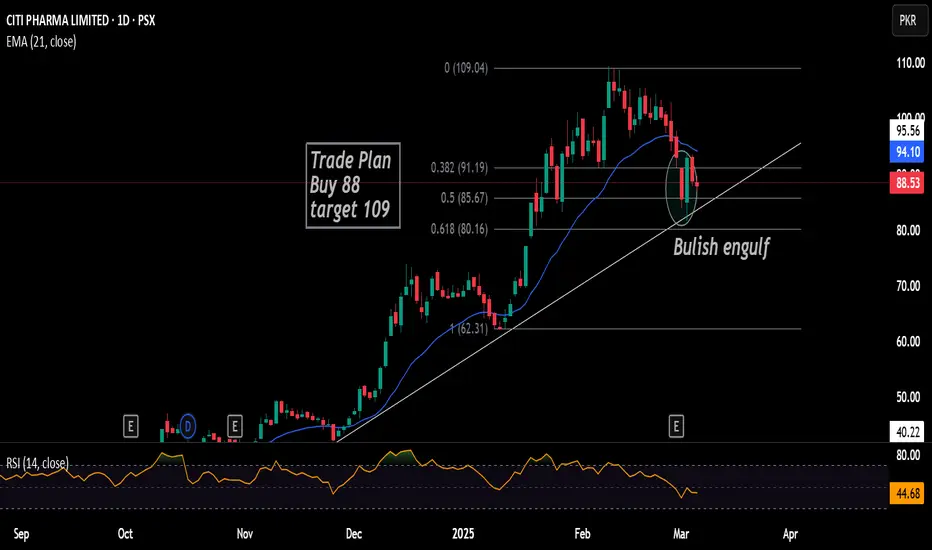
CPHILtrendline test and print bulish engulf candle. aslo fib level 0.50%
Trade Plan
Buy 88
target 109
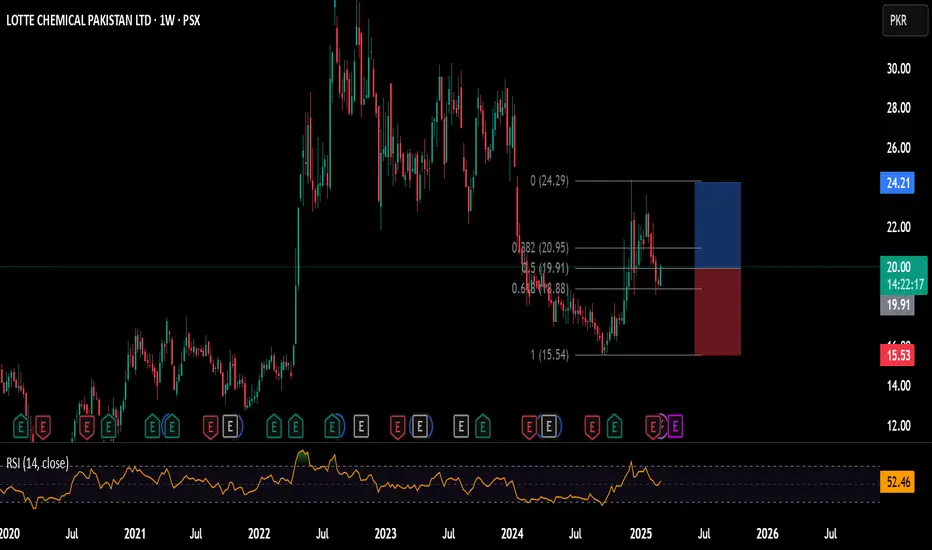
LOTCHEM Gearing Up for a Bullish Comeback? OTCHEM appears to be forming a potential bullish reversal after finding strong support near 18.50-19.00. The stock is attempting to break out of its consolidation phase, with RSI stabilizing near 50, signaling a possible shift in momentum. A decisive move above 20.50-21.00 with strong volume could trigger a rally toward 23.50-24.00, making it a key breakout zone for traders. With volume still on the lower side, a spike in buying interest could confirm the uptrend. Keep an eye on this level—LOTCHEM might just be setting up for its next big move!

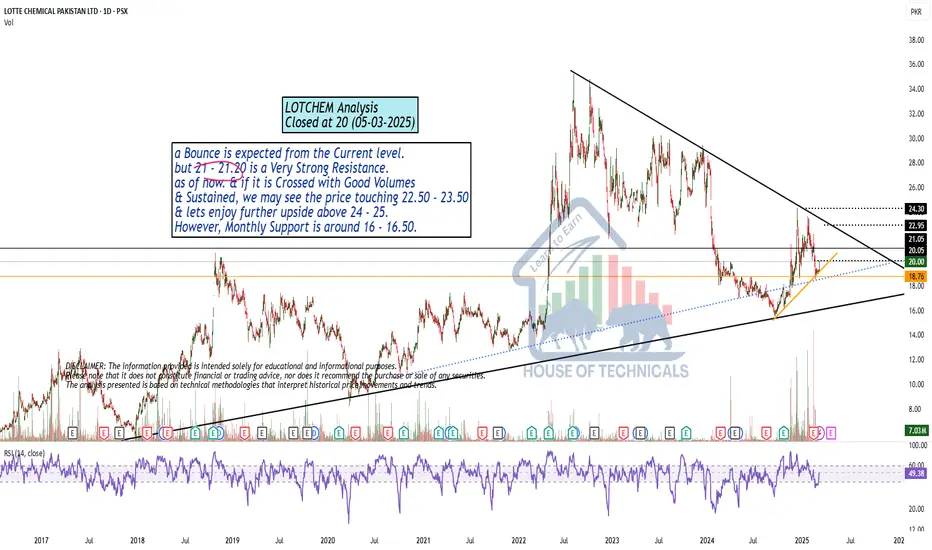
a Bounce is expected from the Current level but Resistance aheada Bounce is expected from the Current level.
but 21 - 21.20 is a Very Strong Resistance.
as of now. & if it is Crossed with Good Volumes
& Sustained, we may see the price touching 22.50 - 23.50
& lets enjoy further upside above 24 - 25.
However, Monthly Support is around 16 - 16.50.
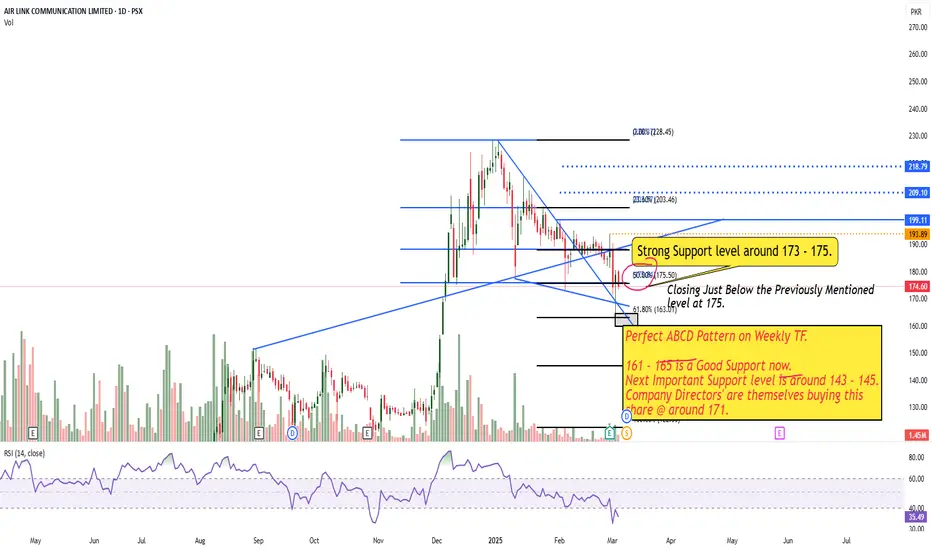
Perfect ABCD Pattern on Weekly TF.Perfect ABCD Pattern on Weekly TF.
161 - 165 is a Good Support now.
Next Important Support level is around 143 - 145.
Company Directors' are themselves buying this
share @ around 171.
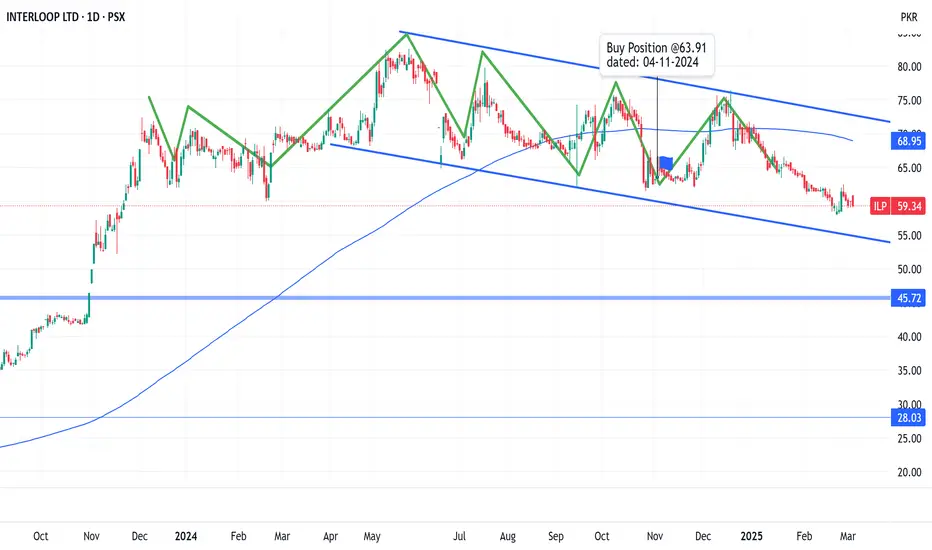
BEST BUY AT 45 LEVEL AFTER Q3 2025 RESULStill the buy is conditional, subject to good result in next quarter, Q3 2025.
Previous quarter result was not satisfactory so i myself adjusted my porftolfio.
ILP deserve rest and i put in my reserved player. Will look for a bullish signal in Apr-May 2025 after Quarter 3 result announcement.
It has a good suppoer at 45 area.
If fall down then we are looking it at 28 area.
Its my potentional player for my portfolio but for now, ILP is not in my Best of 20 players for 2025.
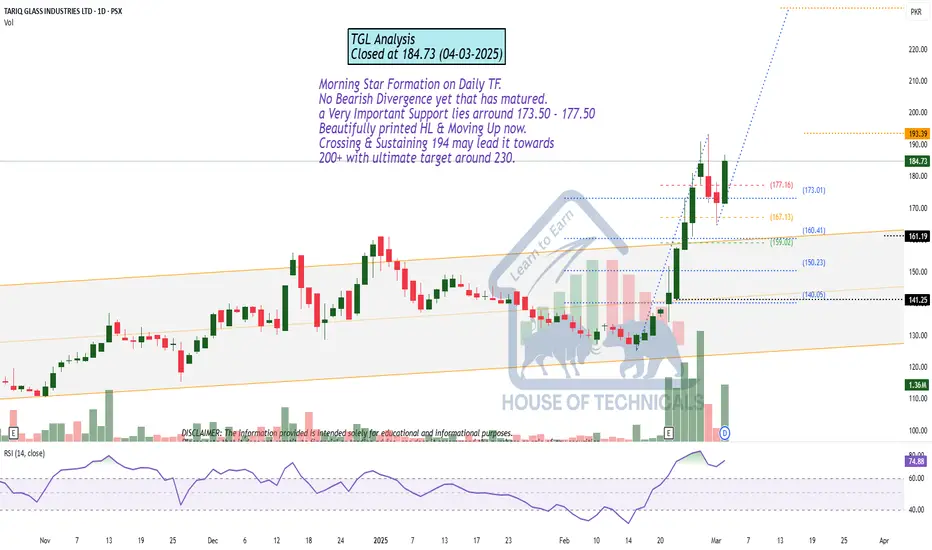
Morning Star Formation on Daily TF.Morning Star Formation on Daily TF.
No Bearish Divergence yet that has matured.
a Very Important Support lies arround 173.50 - 177.50
Beautifully printed HL & Moving Up now.
Crossing & Sustaining 194 may lead it towards
200+ with ultimate target around 230.
Bullish Divergence on Shorter TFImmediate Support seems to be
around 82 - 84.
If this level is not sustained, we
may witness 65 - 72 range.
However, Bullish Divergence on Shorter
time frame may give it a spike of 3-5 rupees.

PSX FCCL Analysis: Entry Points, Targets (Gain 8%-15%-22%)Market Structure & Trend
The stock is maintaining an uptrend, supported by a rising trendline. The price is currently near a potential support level, making it an interesting point for buyers.
Buy Zones & Targets:
Buy-1: 34-36 PKR → Target 40 & 46 PKR
Buy-2: 40-42 PKR → Target 44 & 48 PKR

Airlink Technical Analysis: Potential Bullish SetupAirlink is moving in an uptrend, holding above a trendline, and is currently testing the 0.5 Fibonacci retracement level, a common area of support where buyers often step in. Price is also testing the 89-day EMA, a Fibonacci number that has historically acted as support, reinforcing the bullish outlook. Airlink is also a fundamentally strong company.
Trading Recommendations:
Buy 1 (CMP): 178
Buy 2: 166
Stop-Loss (Conservative): Closing below 118 (below the most recent higher low)
Stop-Loss (Aggressive): Closing below 140 (horizontal support level & below trendline)
Take Profit 1: 226
Take Profit 2: 268
Take Profit 3: Open
Happy trading!

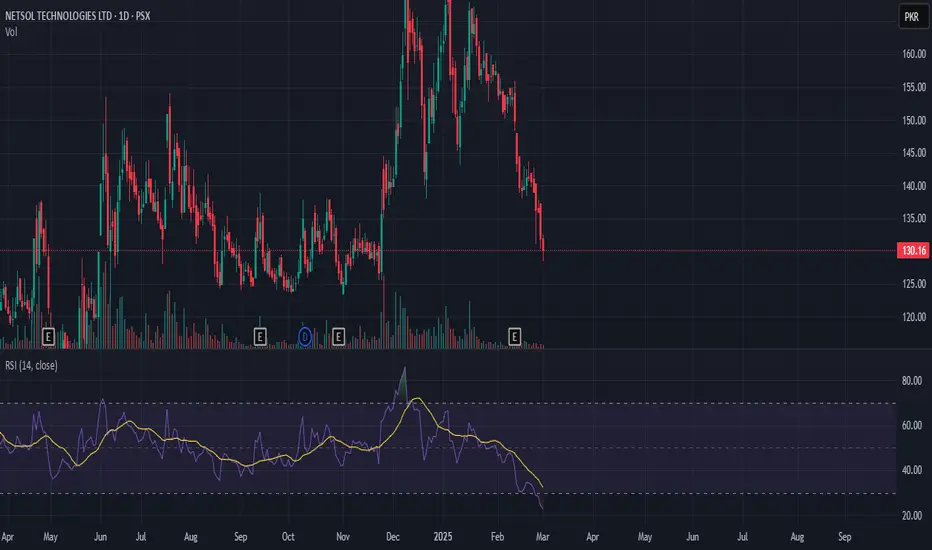
NETSOL Technologies (PSX) Hits Oversold Levels NETSOL Technologies Ltd. (PSX: NETSOL) is currently trading at 130.16 PKR, testing a critical support zone after a prolonged downtrend. The stock has been forming lower highs and lower lows, signaling persistent selling pressure.
📉 Technical Breakdown:
RSI (14) at 22.92 – Deep in the oversold zone, indicating a possible short-term bounce.
Price nearing a key support level at 130 PKR – A break below this could push the stock towards 120–125 PKR.
If a bullish RSI divergence or reversal pattern (e.g., hammer, bullish engulfing) appears, a rebound toward 135–140 PKR may be possible.
🚨 Trading Plan:
🔹 Bullish Case: Wait for confirmation of reversal with increasing volume before entering long positions.
🔹 Bearish Case: A breakdown below 130 PKR with strong volume could signal further downside.
📊 Keeping a close watch for a potential trend shift! What’s your outlook? Comment below! 👇🔥 #PSX #NETSOL #Trading #TechnicalAnalysis.