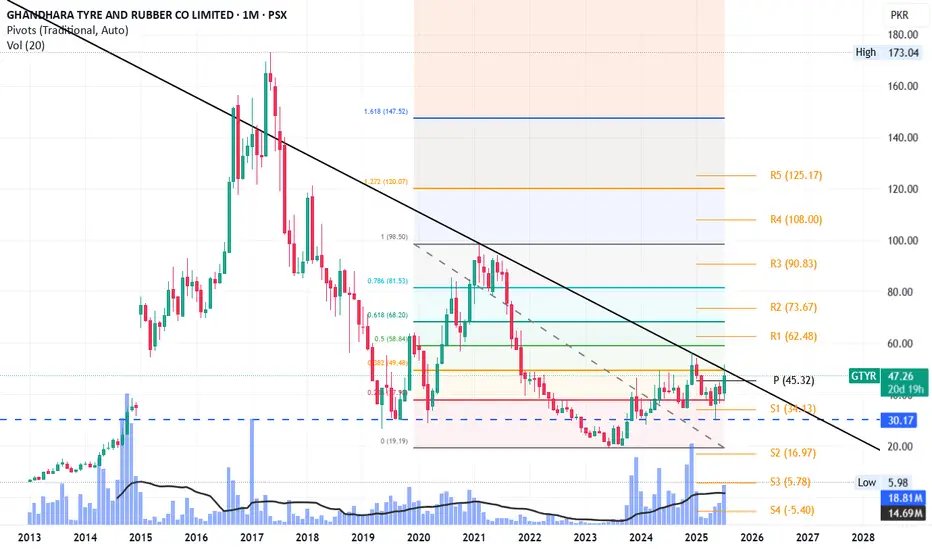
GTYR at the cusp of breakoutFib 0.236 level from last peak and trend line is the main hurdle. Once it breaks, resistances on pivots and other Fib levels will be the targets.
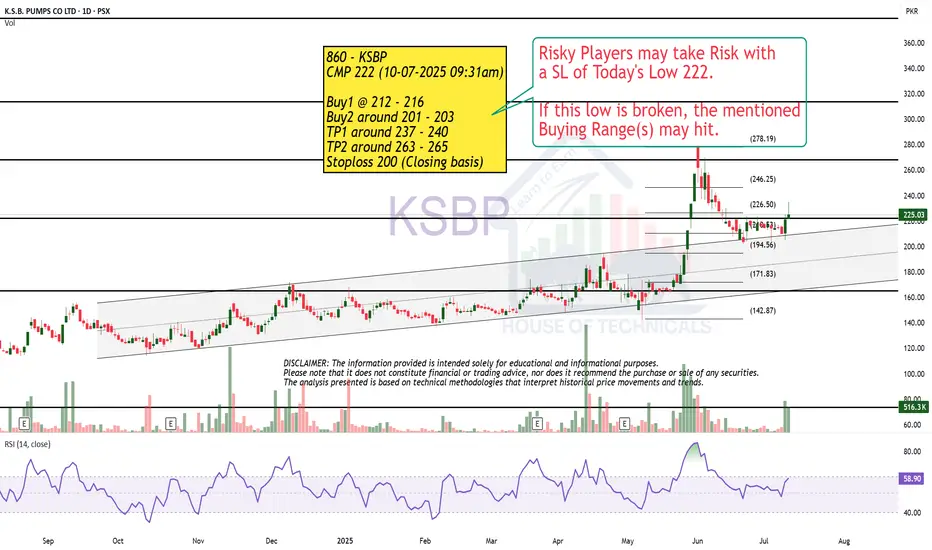
Play on Levels!860 - KSBP
CMP 222 (10-07-2025 09:31am)
Buy1 @ 212 - 216
Buy2 around 201 - 203
TP1 around 237 - 240
TP2 around 263 - 265
Stoploss 200 (Closing basis)
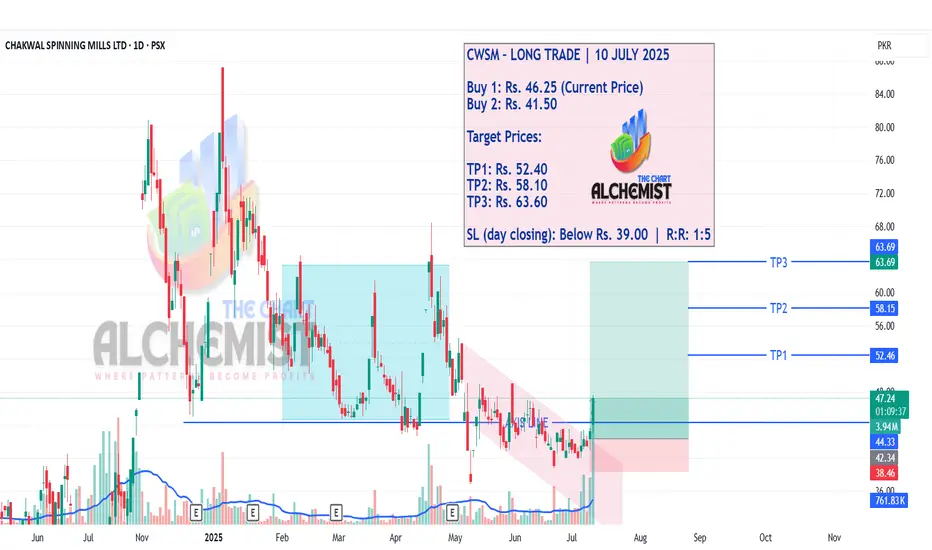
CWSM – LONG TRADE | 10 JULY 2025CWSM – LONG TRADE | 10 JULY 2025
CWSM previously traded in a distribution phase (light blue channel) before descending into a bearish downtrend (light pink channel). The price has now rebounded from an extreme low (blue line), forming a compelling long-term entry setup. The structure indicates a potential shift in control, with momentum building toward multiple quantified upside targets.
📢 Disclaimer: Do not copy or redistribute signals without prior consent or proper credit to The Chart Alchemist (TCA).
✨ Kindly support our efforts by boosting and sharing this idea!
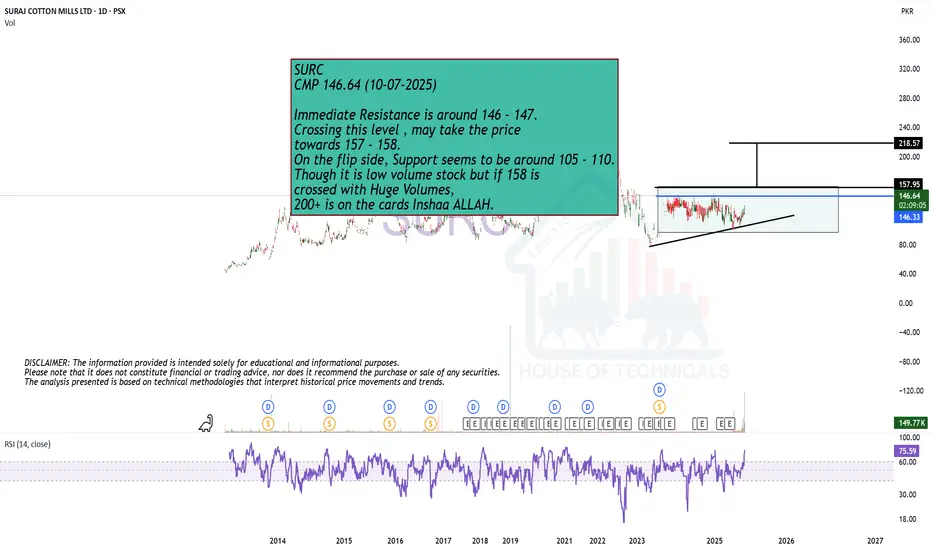
Breakout Expected.SURC
CMP 146.64 (10-07-2025)
Immediate Resistance is around 146 - 147.
Crossing this level , may take the price
towards 157 - 158.
On the flip side, Support seems to be around 105 - 110.
Though it is low volume stock but if 158 is
crossed with Huge Volumes,
200+ is on the cards Inshaa ALLAH.
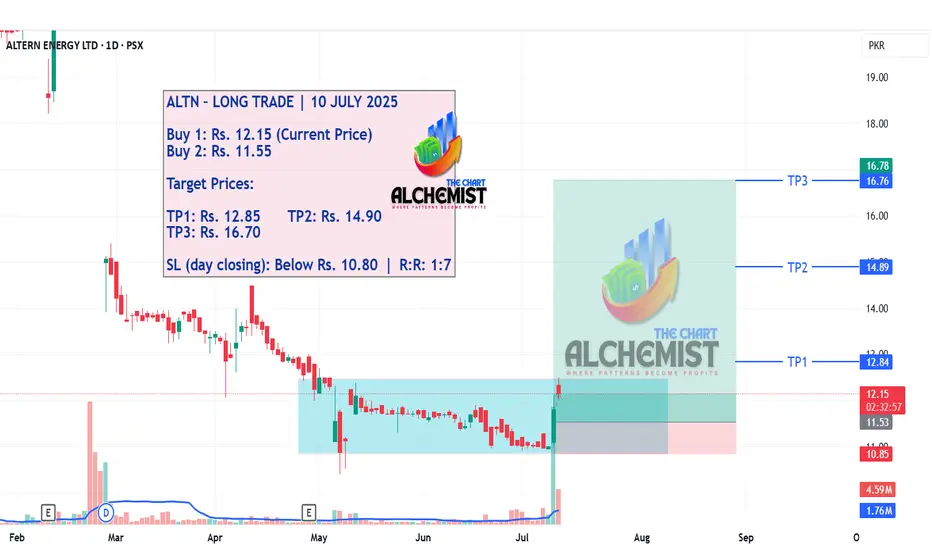
ALTN – LONG TRADE | 10 JULY 2025ALTN – LONG TRADE | 10 JULY 2025
ALTN has been in a prolonged downtrend with multiple selling climaxes on declining volume. After a Wyckoff-style stopping action, the stock marked a low of Rs. 10.40 and entered a consolidation phase within a light blue channel. The latest price action shows early signs of reversal, suggesting the beginning of an upward leg.
📢 Disclaimer: Do not copy or redistribute signals without prior consent or proper credit to The Chart Alchemist (TCA).
✨ Kindly support our efforts by boosting and sharing this idea!
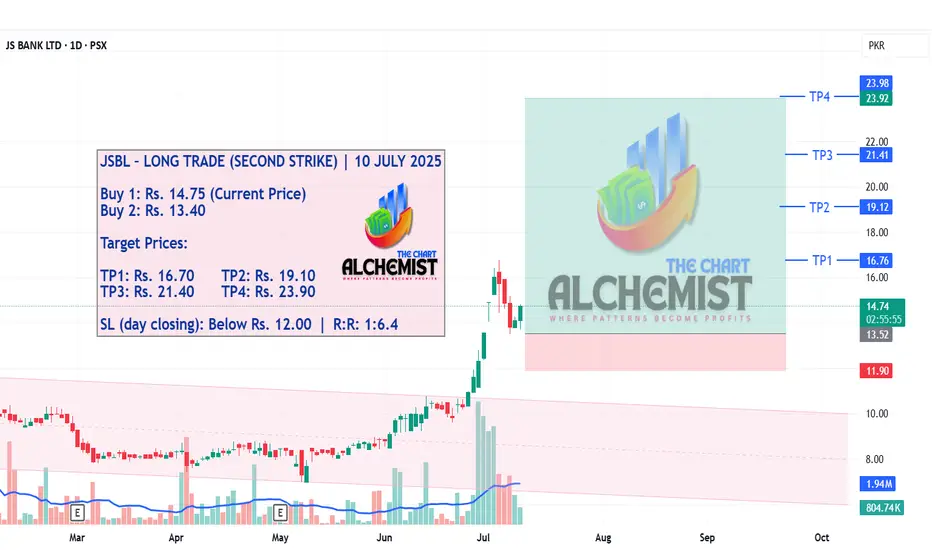
JSBL – LONG TRADE (SECOND STRIKE) | 10 JULY 2025 HIGH PRBABILITYJSBL – LONG TRADE (SECOND STRIKE) | 10 JULY 2025
We previously issued a successful buy call on JSBL that met all targets. Following a healthy pullback, the stock now looks primed for another upward move. The structure suggests a renewed wave of momentum, targeting fresh highs with an excellent risk-reward setup.
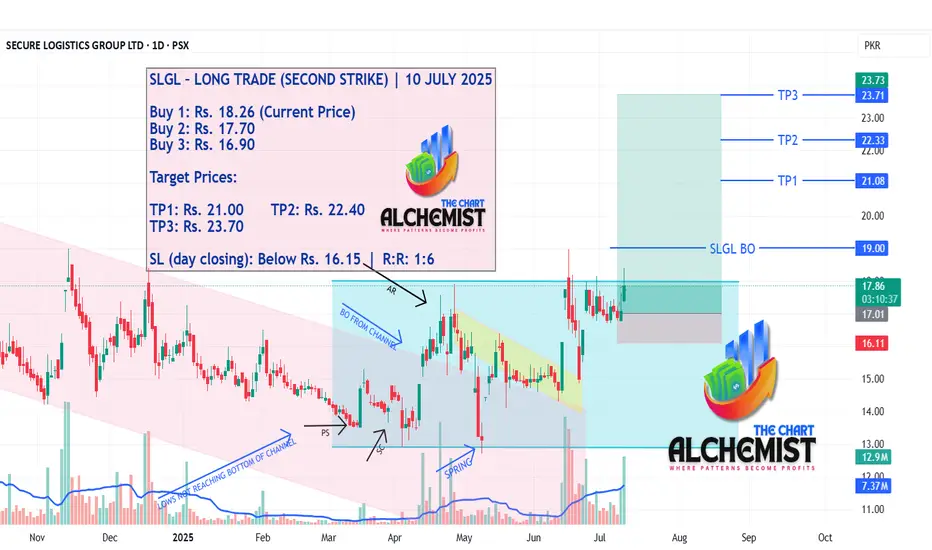
SLGL – LONG TRADE (SECOND STRIKE) | 10 JULY 2025SLGL – LONG TRADE (SECOND STRIKE) | 10 JULY 2025
Our previous buy call on SLGL achieved all targets within a single day. The stock has been trading in multiple embedded channels, with the most critical breakout emerging from a yellow channel. This breakout triggered a new uptrend, and the current setup presents another strong opportunity for a continuation move.
📢 Disclaimer: Do not copy or redistribute signals without prior consent or proper credit to The Chart Alchemist (TCA).
✨ Kindly support our efforts by boosting and sharing this idea!
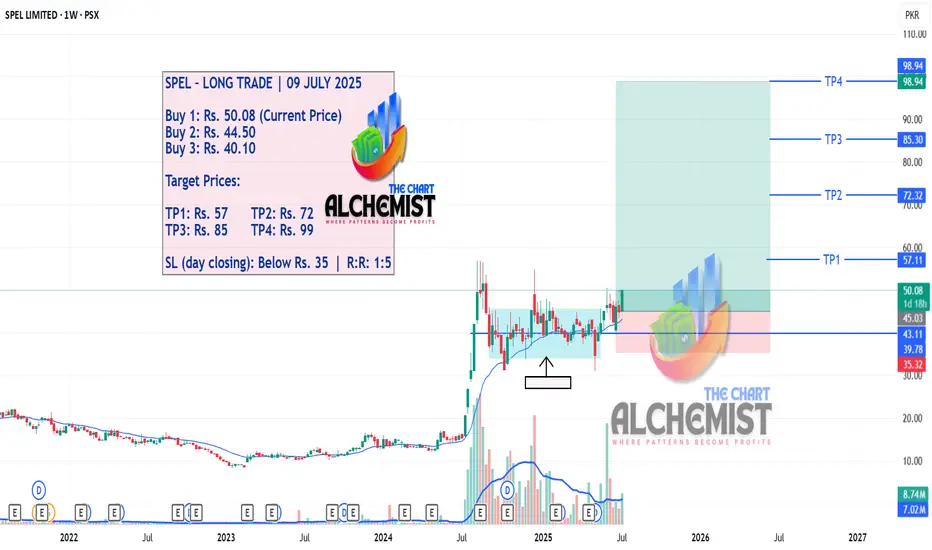
SPEL – LONG TRADE (THIRD STRIKE) | 09 JULY 2025SPEL – LONG TRADE (THIRD STRIKE) | 09 JULY 2025
SPEL is setting up for a third strike entry. On the 1-week timeframe, it has formed a Double Bottom Bull Flag, signaling potential for another strong leg upward. The price action is winding around an excess line with several bullish structures already in place—indicating high probability for larger targets.
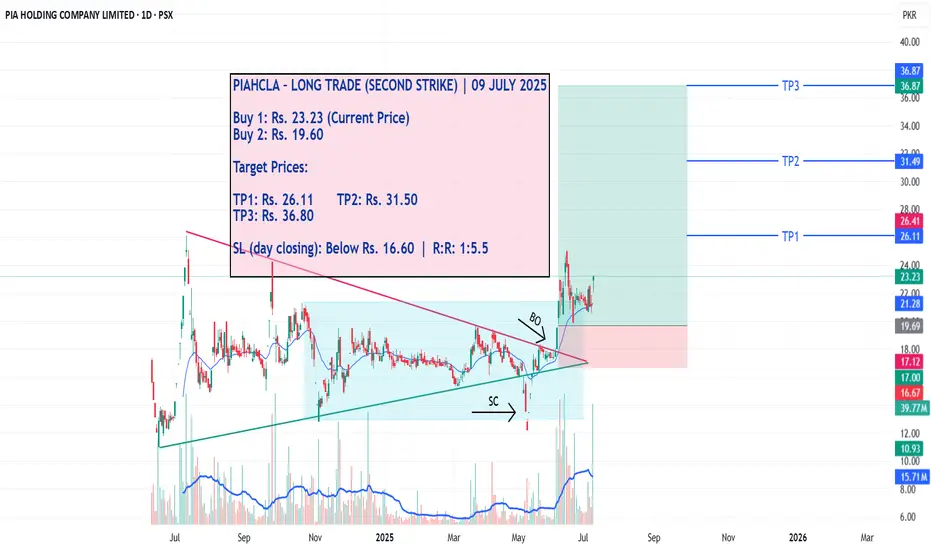
PIAHCLA – LONG TRADE (SECOND STRIKE) | 09 JULY 2025PIAHCLA – LONG TRADE (SECOND STRIKE) | 09 JULY 2025
PIA Holding Company Limited (PIAHCLA) has successfully broken out of an accumulation zone marked by a light blue channel. This upward breakout aligns with a previous triangle breakout, creating a structurally strong case for this second strike entry. Price action confirms bullish continuation, with multiple upside targets now active.
📌 Execution Strategy:
Caution: Please buy in 2 parts within the buying range. Close at least 50% of your position at TP1 and trail your stop loss to protect profits in case of unexpected moves.
📢 Disclaimer: Do not copy or redistribute signals without prior consent or proper credit to The Chart Alchemist (TCA).
✨ Kindly support our efforts by boosting and sharing this idea!
KTML – LONG TRADE | 09 JULY 2025KTML – LONG TRADE | 09 JULY 2025
Kohinoor Textile Mills Limited (KTML) is in a well-established uptrend and has recently formed an inverted head and shoulder pattern. In the context of the ongoing trend, this classic reversal structure is functioning as a continuation pattern, signaling potential for further upward extension.
📌 Execution Strategy:
Caution: Please buy in 2–3 parts within the buying range. Close at least 50% of your position at TP1 and trail the stop loss to protect gains as the trend progresses.
📢 Disclaimer: Do not copy or redistribute signals without prior consent or proper credit to The Chart Alchemist (TCA).
✨ Kindly support our efforts by boosting and sharing this idea!

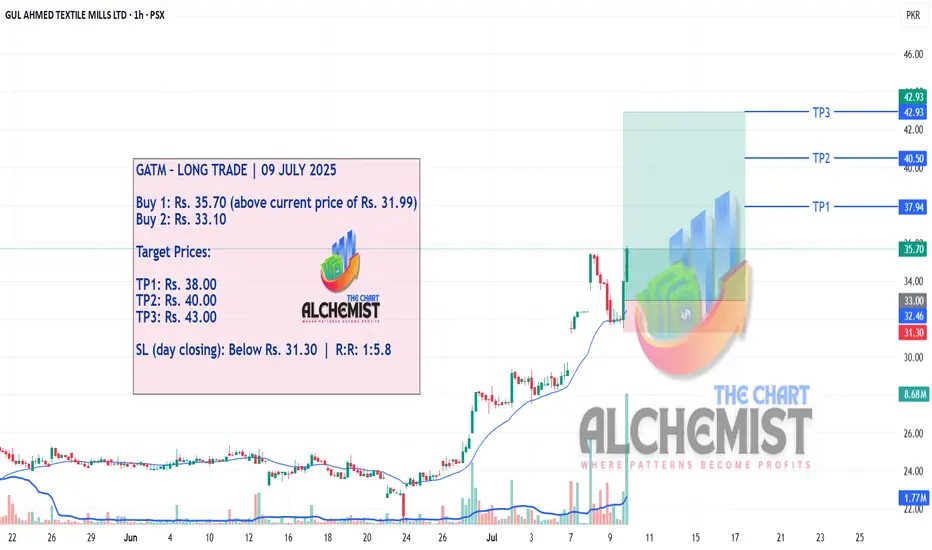
GATM LONG TRADE 09-07-2025GATM – LONG TRADE | 09 JULY 2025
Gul Ahmed Textile Mills Limited (GATM) has completed its previous uptrend leg and recently entered a healthy pullback, which now appears to be ending. With structure reset and bullish momentum building, the stock is poised to aim for extended quantified targets.
Recent technical analysis supports a strong buy rating, and the stock has already delivered a 57.03% return over the past year — positioning it as a high-potential opportunity.
📌 Execution Strategy:
Caution: Please buy in 2–3 parts within the buying range. Close at least 50% of your position at TP1 and trail the stop loss to protect gains in case of volatility.
📢 Disclaimer: Do not copy or redistribute signals without prior consent or proper credit to The Chart Alchemist (TCA).
✨ Kindly support our efforts by boosting and sharing this idea!
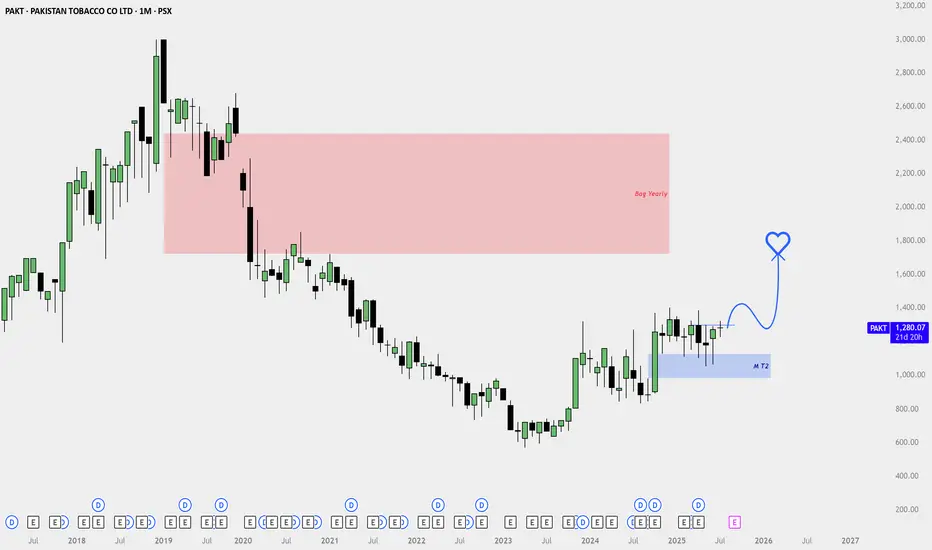
PAKT Monthly Buy Setup – Bullish Reversal Toward Higher Imbalanc🟢 Directional Bias: Bullish (Long-Term Reversal in Play)
Price is emerging from a multi-year downtrend and has now formed a clear higher low and higher high structure.
The monthly candle has shown strength after reacting from a well-defined monthly fair value gap (M T2), indicating institutional interest and demand.
📍 Key Levels
Demand Zone (Entry Area): Monthly fair value gap (M T2)
Current Price: Trading above recent consolidation
Target Area: Higher timeframe imbalance (Bag Yearly)
Resistance Before Target: Slight hurdle just above current breakout zone (may cause short-term pullback)
📈 Price Action Analysis
Price tapped into the monthly FVG and formed a base (accumulation structure).
A breakout candle is now forming above recent highs, which suggests continuation.
Expect a potential minor pullback/retest before rallying toward the higher imbalance zone.
📌 Entry Idea
Entry: Look for dips back into the breakout zone to build long exposure
Stop Loss: Just below the demand zone
Target: Higher imbalance zone
Risk-Reward: Favors swing buyers holding long-term
🧠 Context Note
This is a monthly timeframe swing trade idea, so patience is key.
Ideal for investors or position traders holding for several months.
Watch for strong monthly closes above current structure for added confirmation.
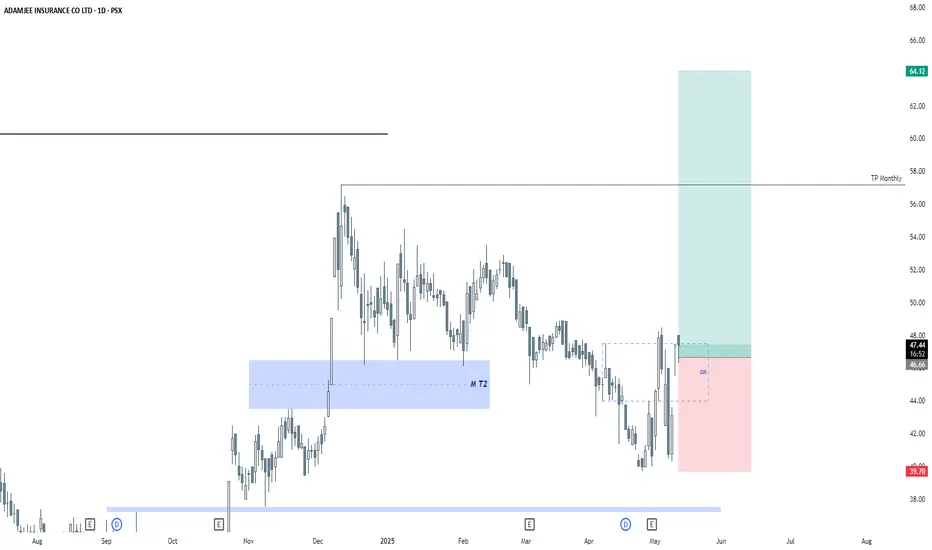
Buy Idea: ADAMJEE INSURANCE CO LTD (PSX) – Daily TimeframeBuy Idea: ADAMJEE INSURANCE CO LTD (PSX) – Daily Timeframe
Price has recently formed a bullish dealing range (DR) after reacting strongly from the monthly demand zone (M T2). The current structure shows price respecting this DR, indicating potential upside movement.
🔹 Entry: Inside the DR box around 46.00
🔹 Stop Loss: Below DR low (~39.70)
🔹 Target: Monthly TP zone around 64.12
🔹 Risk-to-Reward: >2.5R
Confluence:
Price bounced from a strong monthly demand
DR formed and respected, confirming a potential reversal zone
Clean monthly target area aligned with previous highs
Bias: Bullish
Trade Type: Swing trade
Strategy Basis: Demand reaction + DR formation + HTF alignment
MCB Bank Pakistan – Smart Money Concept (SMC) Perspective### **MCB Bank Pakistan – Smart Money Concept (SMC) Perspective 📊🔥**
I Have identified the **Yearly Breaker Block** overlapping with a **Monthly Bullish Order Block (OB)** and a **Fair Value Gap (FVG)**, then this setup signals a potential **liquidity grab** before a strong bullish move. 🚀
#### **1️⃣ Yearly Breaker Block & Monthly Bullish OB 📉➡️📈**
- The **Breaker Block** acting as a resistance suggests that price may need to mitigate unfilled orders before a strong reversal.
- **FVG presence** indicates institutional activity and the need for price to rebalance before continuing higher.
#### **2️⃣ Volume Imbalance & Price Decline 🔻**
- The presence of **Volume Imbalance** suggests that price might push lower to the **Monthly OB**, where Smart Money could accumulate long positions.
- **Liquidity Hunts** below OB could fuel a **bullish reaction** from this level.
#### **3️⃣ Liquidity Grab & All-Time High (ATH) Break 🚀**
- If price taps into **Monthly OB** and shows bullish confirmation (**Market Structure Shift - MSS**), we could see a rally toward **ATH breakout**.
- This move aligns with **Smart Money's agenda** to trap sellers and fuel a strong uptrend.
### **Trading Plan (Execution Strategy) 🎯**
✅ **Confirmation:** Look for **Bullish Engulfing / MSS** at **Monthly OB**.
✅ **Entry:** Use **Limit Orders** in OB or wait for **Lower Time Frame (LTF) Confirmation**.
✅ **Stop Loss:** Below **Monthly OB** to avoid liquidity sweeps.
✅ **Take Profit:** First **Previous High**, then **All-Time High (ATH)**.
📌 **Conclusion:**
This setup suggests a **High-Probability Smart Money Trade**, where price may drop into **Monthly OB**, grab liquidity, and then push to break **ATH**. **Patience & Confirmation** will be key! 🔥💰📈

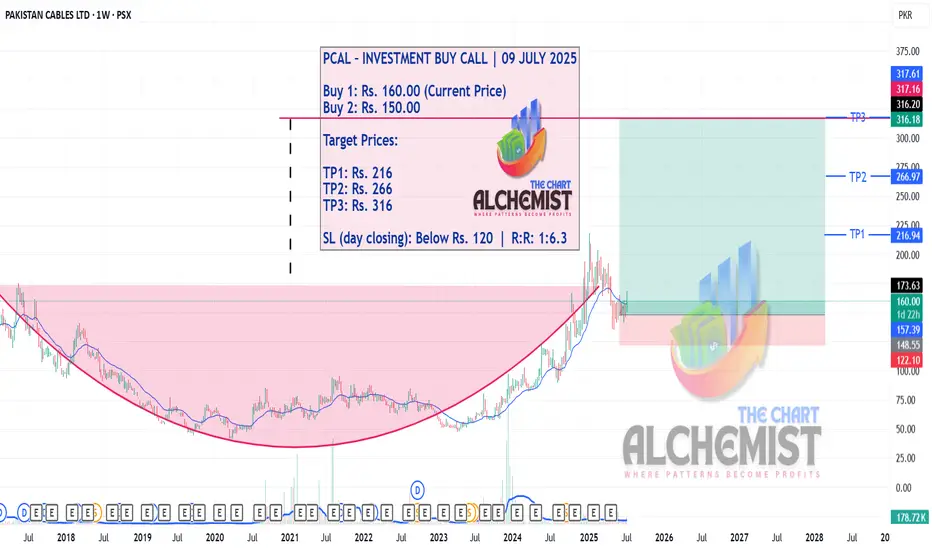
PCAL – INVESTMENT BUY CALL | 09 JULY 2025PCAL – INVESTMENT BUY CALL | 09 JULY 2025
Pakistan Cables Limited (PCAL) has completed a rare 7-year farming and scale-up formation. A major breakout occurred in December 2024, followed by a sharp rally to Rs. 218. The recent pullback appears structurally complete, and the stock is now poised for a major upward move with long-term potential.
📌 Execution Strategy:
Caution: Please buy in 2–3 parts within the buying range. Close at least 50% of your position at TP1 and trail the stop loss to protect gains as the trend develops.
📢 Disclaimer: Do not copy or redistribute signals without prior consent or proper credit to The Chart Alchemist (TCA).
✨ Kindly support our efforts by boosting and sharing this idea!
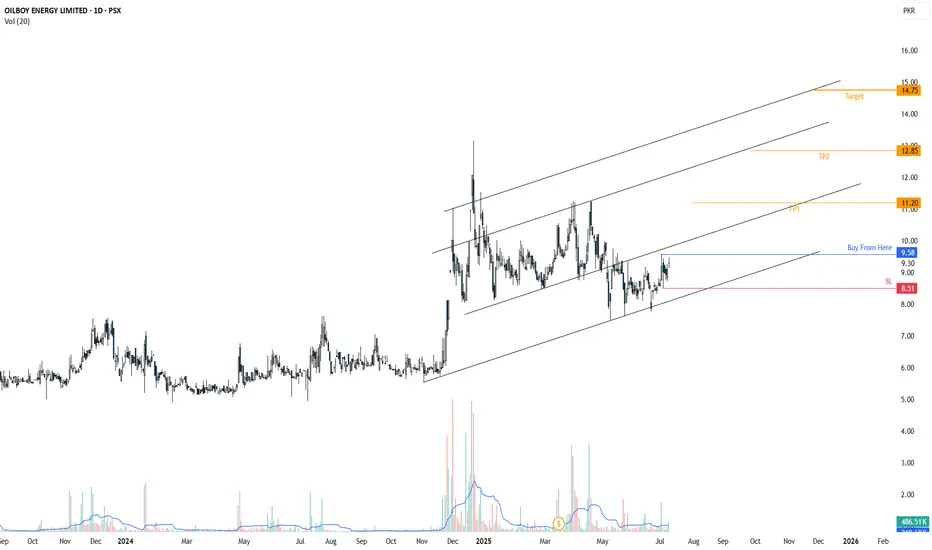
OBOY is in Rising ChannelOBOY is in Rising Channel, it has already taken retracement from golden zone
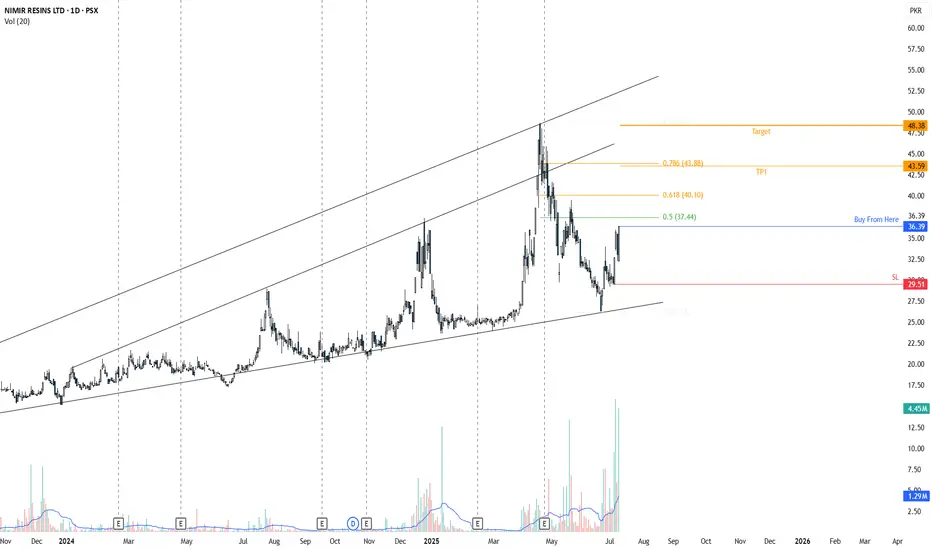
NIMR is in Rising Triangular channelNIMR is in the Rising Triangular channel. It has already given a breakout of recent LH.
can easily chase the target of 45.71 and 50.67.
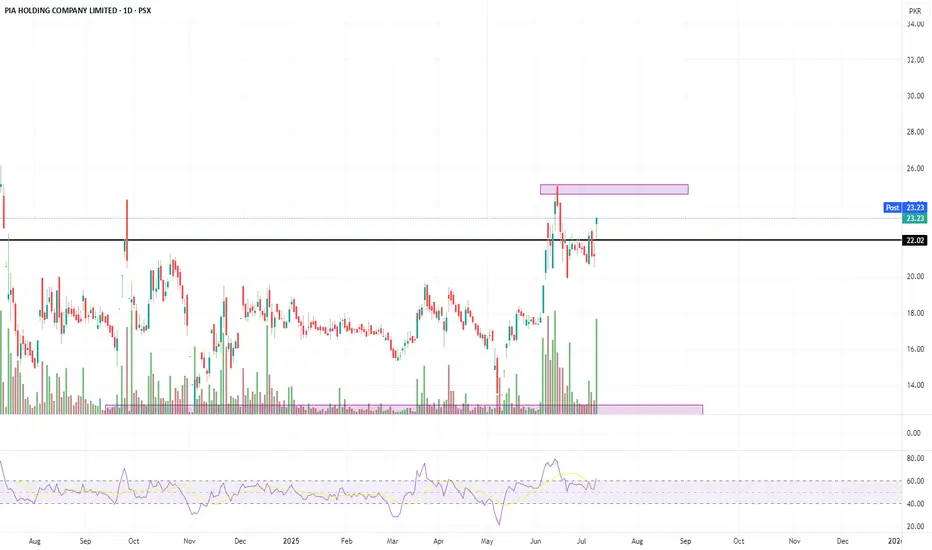
PIAHCLA buying strategyPIAHCLA trading strategy:
1. Buy Range: 23.28 - 22.70
2. Stop Loss: 22
3. Target: 24.60 - 25
Strategy:
The strategy involves buying PIAHCLA when the price is between 23.28 and 22.70, with a stop loss set at 22 to limit potential losses. The target price range is 24.60 to 25, indicating a potential upside of around 6-10% from the buy range.
Risk Management:
The stop loss at 22 would limit the potential loss to around 3-4% from the buy range.
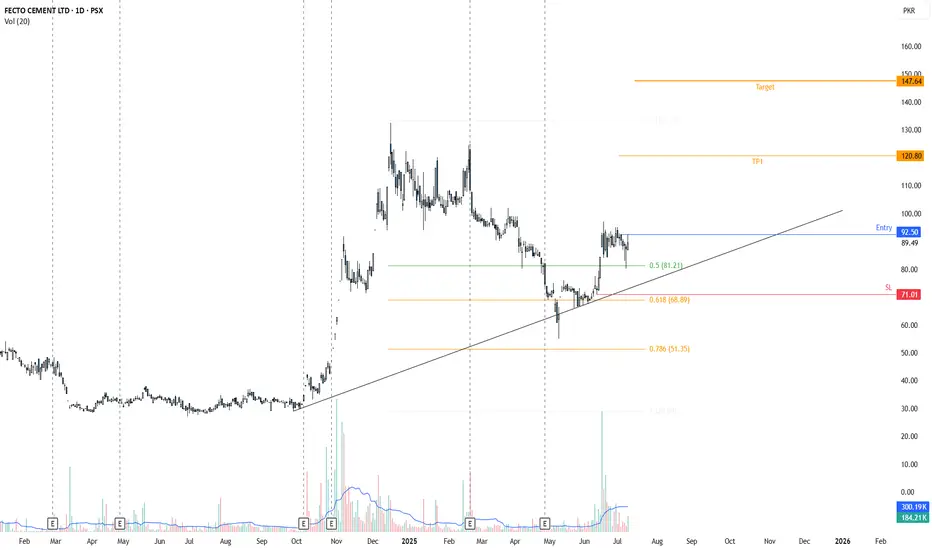
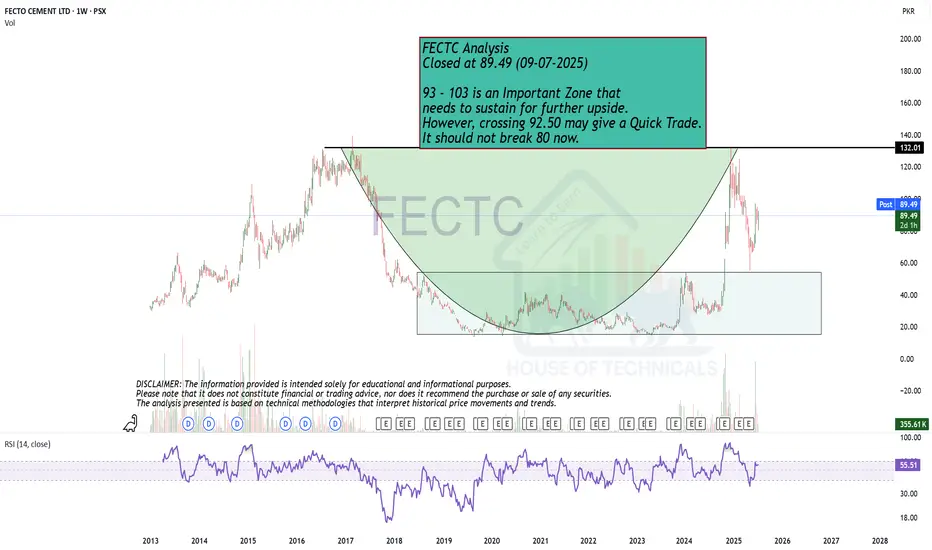
Important ZoneFECTC Analysis
Closed at 89.49 (09-07-2025)
93 - 103 is an Important Zone that
needs to sustain for further upside.
However, crossing 92.50 may give a Quick Trade.
It should not break 80 now.
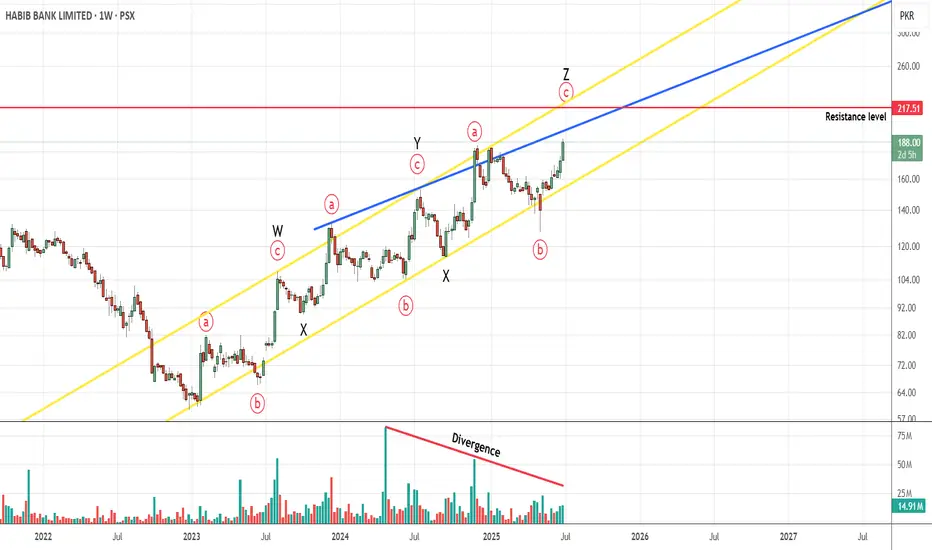
HBL PROBABLY IN WAVE '' C '' OF " Z " - LONGThis is in continuation of our HBL wave count/idea shared earlier.
HBL is most probably in wave C of Z which will take price up towards 214-217 range area, however prices can start declining after reaching the blue trendline at 196-200 level.
We will look forward to short sell HBL once price reach 214-217 level i.e. if the volume divergence remains intact. It is due to volume divergence that we are not marking our alternate impulse wave count, however volume divergence can be easily wiped out with prices forming a high volume bullish day until then we are sticking with our current wave count.
(Posting this with delay as we are already active in this trade at 185)
Trade setup:
Entry price: 185
Stop loss: 152
Targets:
T1: 196 - 200
T2: 214 - 217
Let see how this plays, Good Luck!
Disclaimer: The information presented in this wave analysis is intended solely for educational and informational purposes. It does not constitute financial or trading advice, nor should it be interpreted as a recommendation to buy or sell any securities.
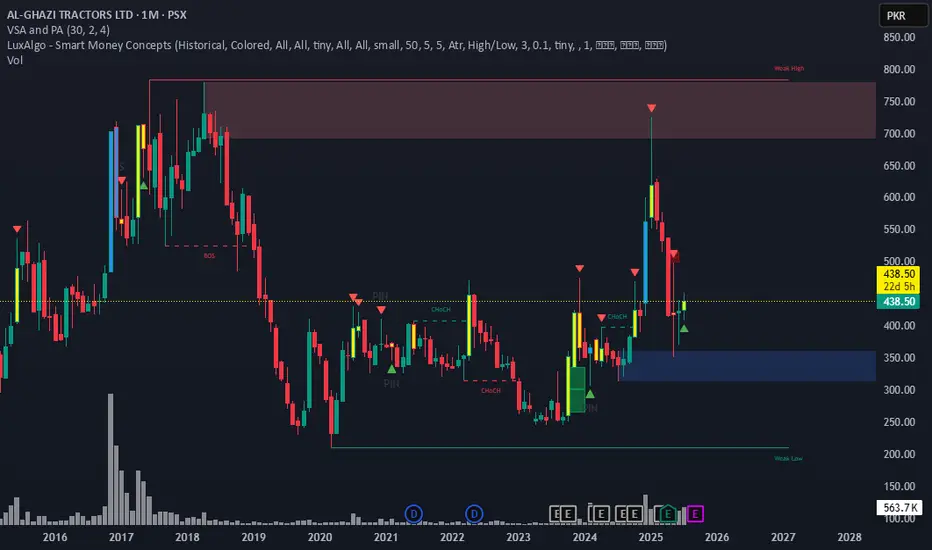
AGTL monthly ChartAGTL is showing good level for buying in monthly chart. it will gives high returns in coming months.