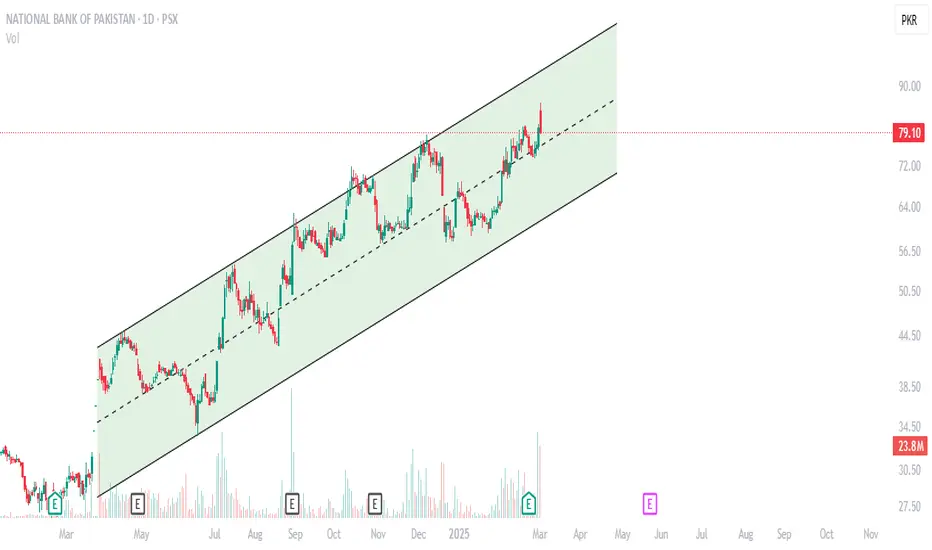
NBP Stock Analysis: Next 25% Gain NBP’s price movement within an upward-sloping channel
Lower Bound (~PKR 60-65) → Strong support zone.
Upper Bound (~PKR 88-90) → Strong resistance zone.
Trading Strategy
Bullish Bias: Buy on dips near mid-channel support (~74-76 PKR) and target 88-90 PKR.
Buy-1 : 74-15%
Buy-2 : 70-20%
Buy-3 : 65-33%
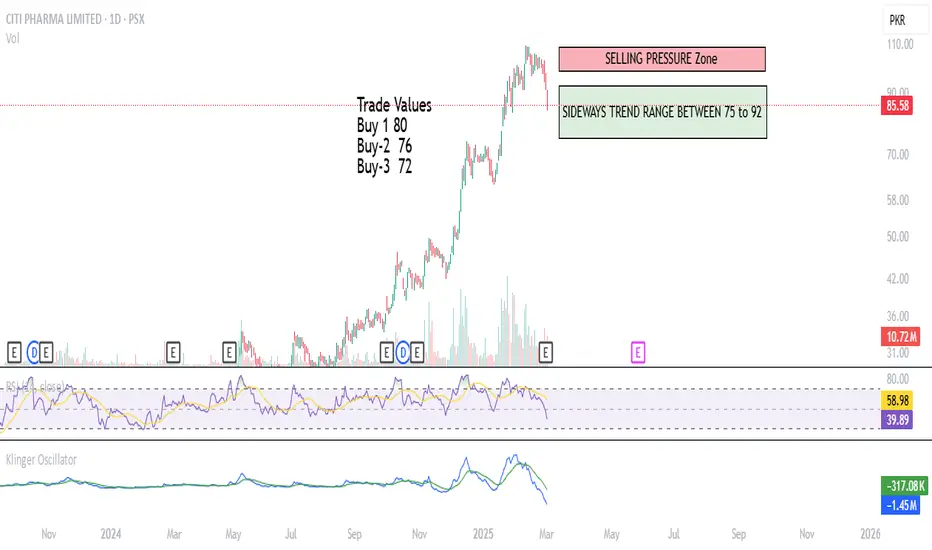
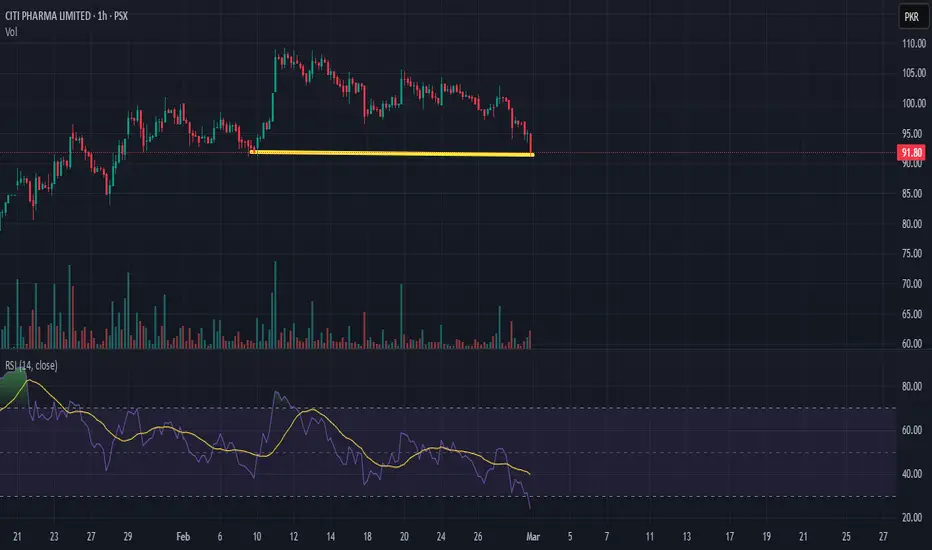
CITI PHARMA-Sideways Trend for 22% & 35% gainShort-Term Outlook: The stock is bearish, as indicated by the RSI, Klinger Oscillator, and price action near support levels.
Potential Entry Points: If the RSI starts climbing above 35-40, and the price holds support at 85.60 or 80.01, it could present a buying opportunity.
Risk Factor: If the price breaks below 80.01, expect further downside towards 72.04 or lower.
Confirmation Needed: Look for increased volume and positive oscillator movement before making bullish trades.
Buy-1: 80
Buy-2: 76
Buy-3: 72
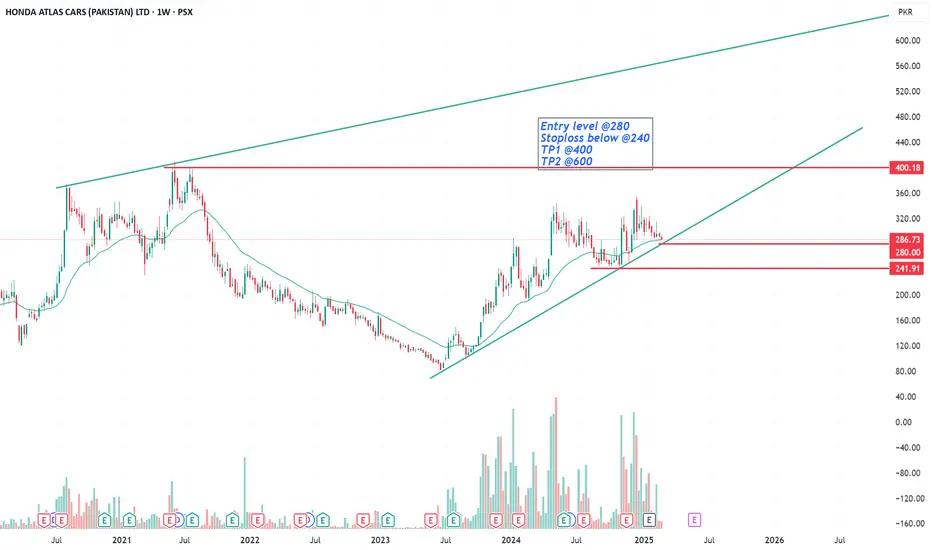
HCAR Weekly AnalysisHCAR is near weekly trend line support , buy attempt can be taken around 280 with stoploss of below 240, reward is much high than risk. TP1@400 and TP 2@600

MLCF Bullish Breakout – Trend Continuation?MLCF is showing bullish strength on the higher timeframe, breaking its previous higher high and signaling trend continuation. If it holds above this breakout level, further upside towards is possible

CPHL Breakdown – Bearish Trend Confirmation?CPHL has broken below a key lower high, signaling bearish momentum on the 1H timeframe. With increasing selling pressure and RSI at 24 (oversold), further downside is possible unless buyers step in. If support at holds, a short-term bounce could occur. However, failure to reclaim resistance may lead to further declines. Watching for confirmation before entering a trade.
What’s your outlook? Drop your thoughts below! 📉🔥

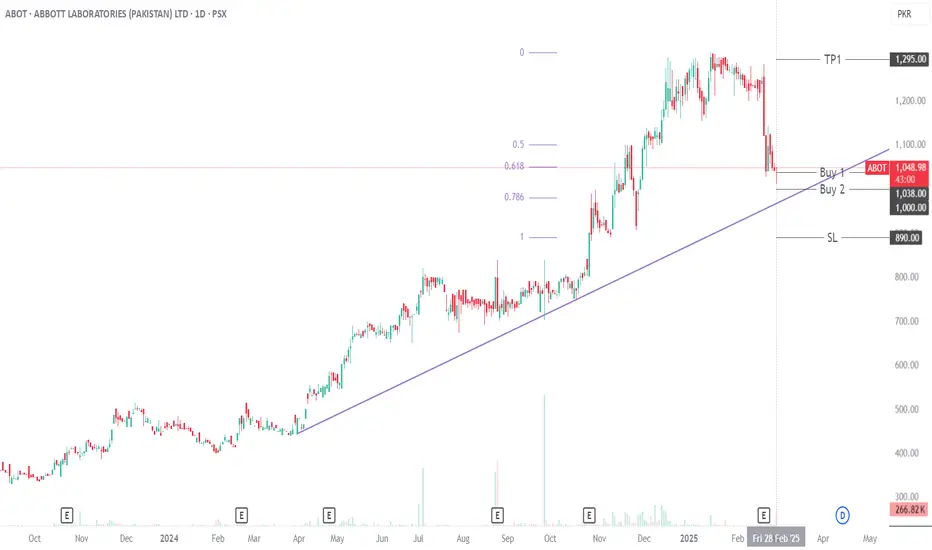
ABOT Technical Analysis: Potential Bullish SetupABOT is showing a solid uptrend, currently holding within the 0.618-0.78 Fibonacci retracement zone—a key support area. It's respecting its trendline, and we're seeing bullish divergence in both volume and RSI, hinting at more buyers stepping in, which is a good sign. Plus, ABOT's fundamentals are strong!
Trading Recommendations:
Buy 1 (CMP): 1038
Buy 2: 1000
Stop-Loss (Closing Basis): 890
Target 1: 1295
Target 2: Open
Happy trading!
PSO at a Critical Juncture: Uptrend Continuation or Deeper Pull?PSO shows a strong uptrend followed by a significant pullback from its recent peak of 465. The price has retraced to 338, aligning with key Fibonacci levels, with 361 (0.382) acting as resistance and 322 (0.5) providing support near a long-term trendline. Holding above this trendline could signal a continuation of the uptrend, while a break below 322 may lead to further downside towards 296 (0.618 retracement) or even 251 (0.786 retracement). A bullish recovery would require reclaiming 361, while failure to hold support levels could extend the correction. Overall, the trend remains bullish in the long run if the price stays above key support zones.

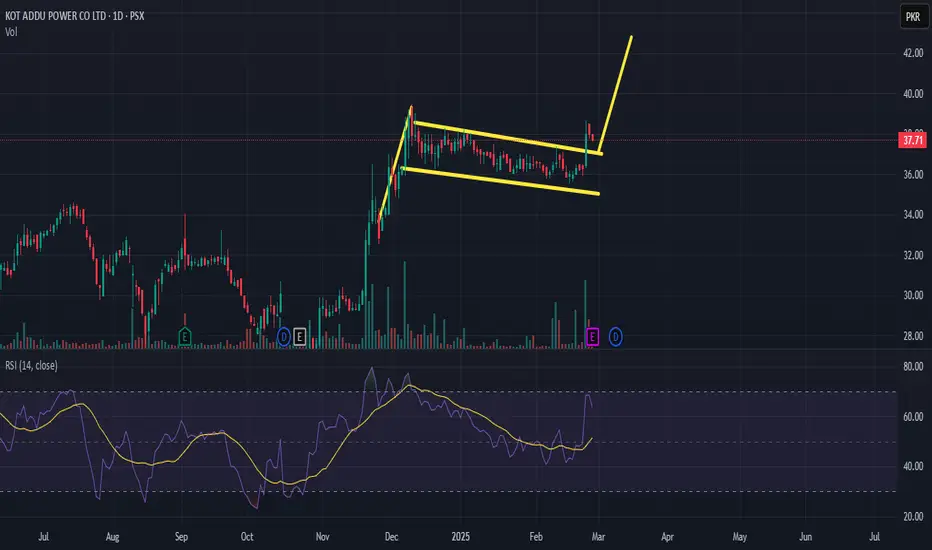
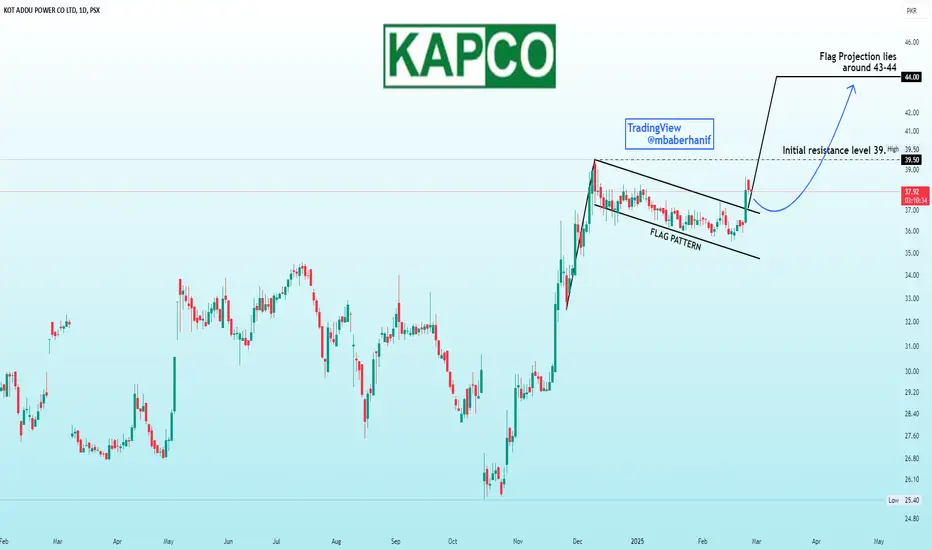
KAPCO – Bullish Flag Pattern Breakout in PlayKAPCO is forming a bullish flag pattern, indicating a strong uptrend continuation. The stock is currently consolidating within the flag, and a break above 39.50 with strong volume would confirm the breakout, potentially leading to a rally towards 42-43. This level also marks a double top resistance, where some short-term rejection could be expected. However, if the breakout sustains with increased buying pressure, it could pave the way for further upside. Traders should monitor volume closely for confirmation before entering a position.
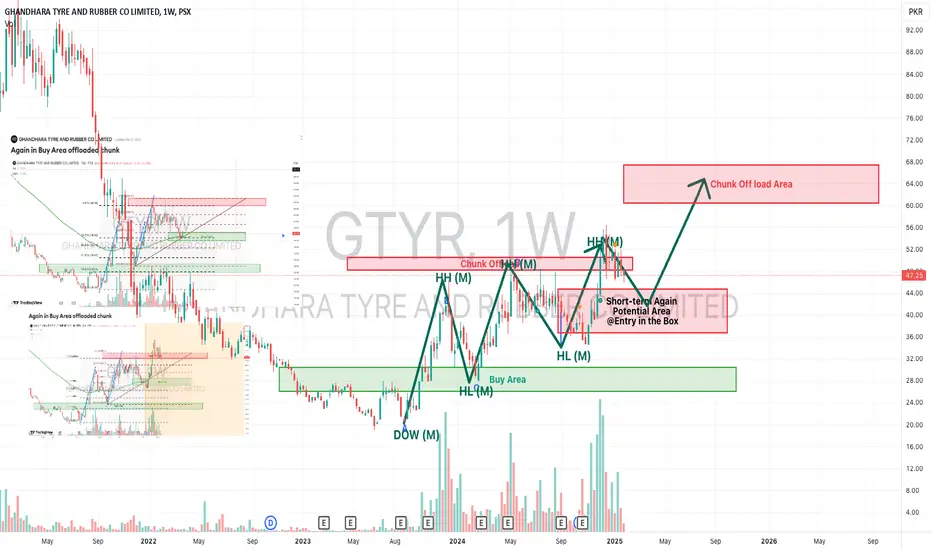
Third time's the Charm? Waiting for Re-Entry on DOW MonthlyAfter successfully buying and offloading chunks twice, I’m now eagerly waiting for the price to revisit my Potential Entry Box to buy back the already offloaded chunk. If the pattern holds, I’ll likely offload again in the next target zone (new offload chunk box). 😊
Before you launch a rocket of anger 🚀 😅 Let me tell you that Last time, I forgot to take a screenshot of the first buy & offload chunk area & updated my chart straight away. 😅
Today, I finally learned how to add an image! 🎉
Note: I’m still learning, this is NOT financial advice. Do your own research, and I’m happy to have constructive criticism! Let’s learn together. 📈
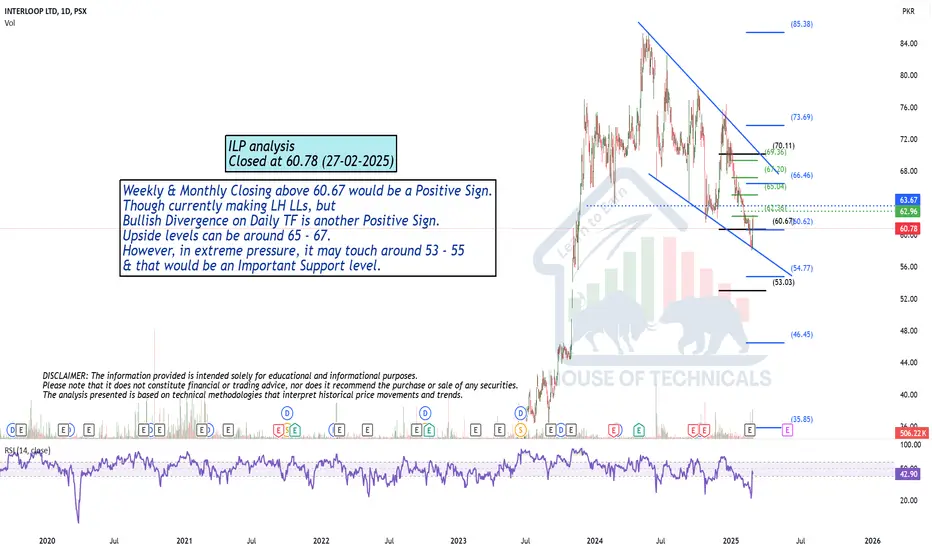
Currently making LH LLs but..Weekly & Monthly Closing above 60.67 would be a Positive Sign.
Though currently making LH LLs, but
Bullish Divergence on Daily TF is another Positive Sign.
Upside levels can be around 65 - 67
However, in extreme pressure, it may touch around 53 - 55
& that would be an Important Support level.
KAPCO - Flag PatternThe stock displays a bullish flag pattern on strong volume, trading confidently above both the 20 and 200-day EMAs, suggesting robust upward momentum. Previous session shows a break out of the flag and price closed +2.45% above it. Initial resistance lies around 39.50 which is the formation of double top pattern from where short term rejection can be seen. However, a decisive break above the resistance level will confirm the continuation of the bullish trend and flag projection lies around 43-44.
PSO could drop todayPSO is cross below my created indicator may be it drop below to 340 and 340. Wait for it to entre bullish zone.
Note: This is not a buy sell call, trade at your own will and use stop loss.

Buy on DipsShort to Medium Term ULTIMATE TARGETS CAN BE 25 - 26
& Then 40 -45
Best Buying Price would be around 11 - 12 (if it comes).

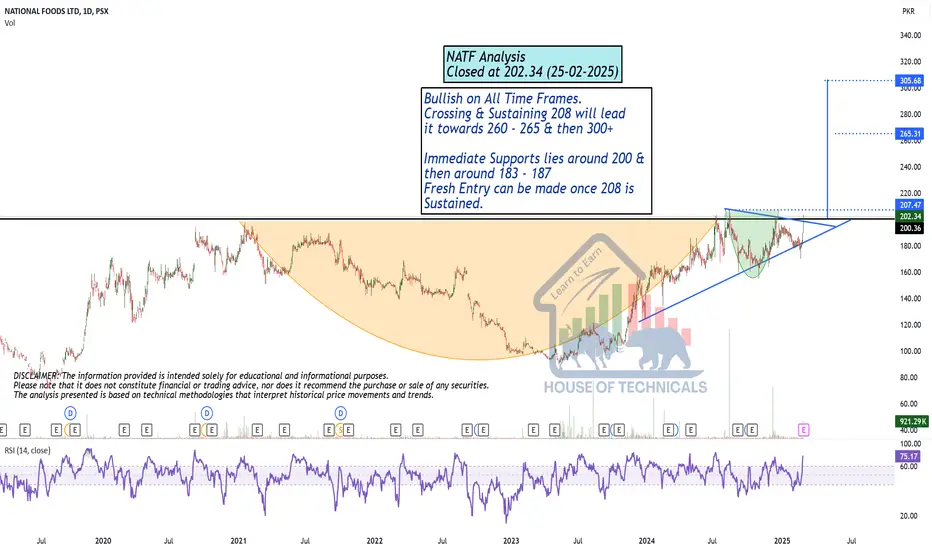
Bullish on All Time Frames.Bullish on All Time Frames.
Crossing & Sustaining 208 will lead
it towards 260 - 265 & then 300+
Immediate Supports lies around 200 &
then around 183 - 187
Fresh Entry can be made once 208 is
Sustained.
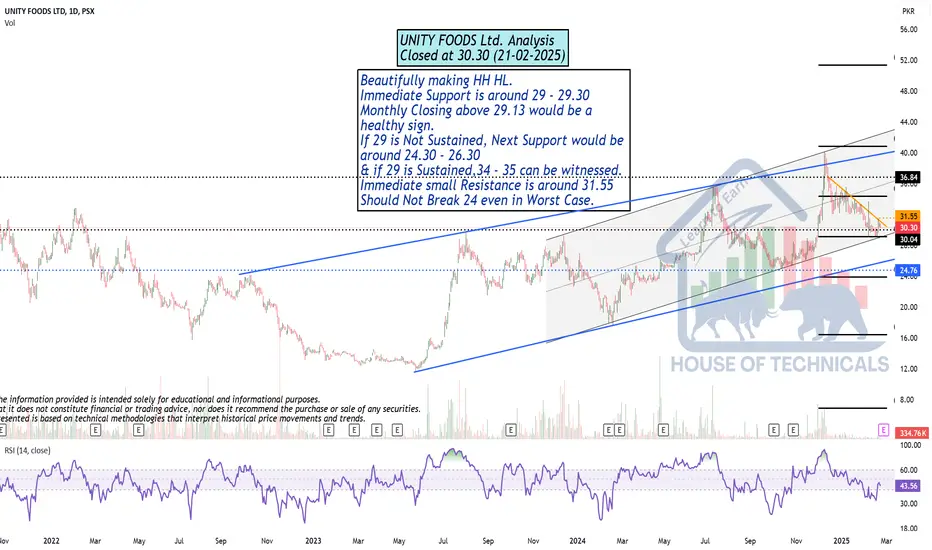
Beautifully making HH HL.Beautifully making HH HL.
Immediate Support is around 29 - 29.30
Monthly Closing above 29.13 would be a
healthy sign.
If 29 is Not Sustained, Next Support would be
around 24.30 - 26.30
& if 29 is Sustained,34 - 35 can be witnessed.
Immediate small Resistance is around 31.55
Should Not Break 24 even in Worst Case.
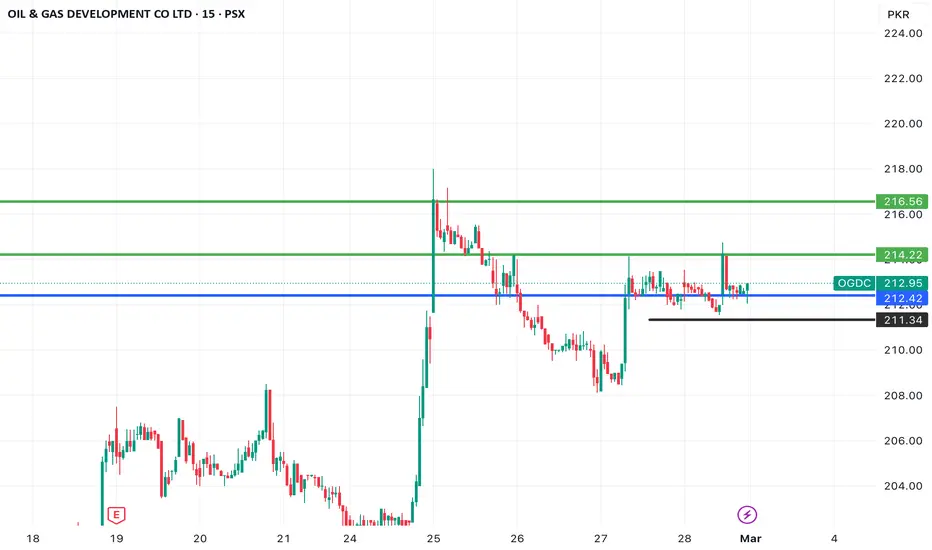
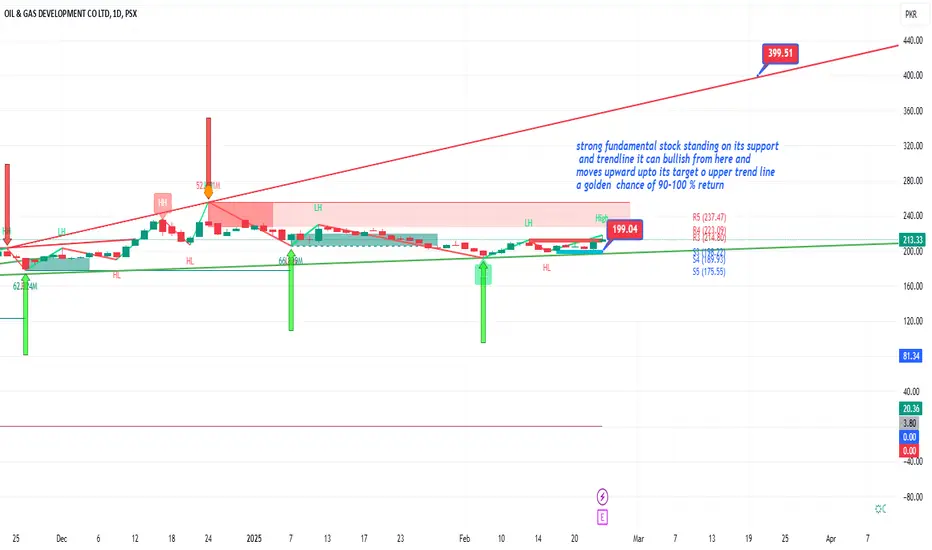
OGDC-LONGstrong fundamental stock standing on its support and Lower trendline it can bullish from here and
moves upward upto its target o upper trend line a golden chance of 90-100 % return
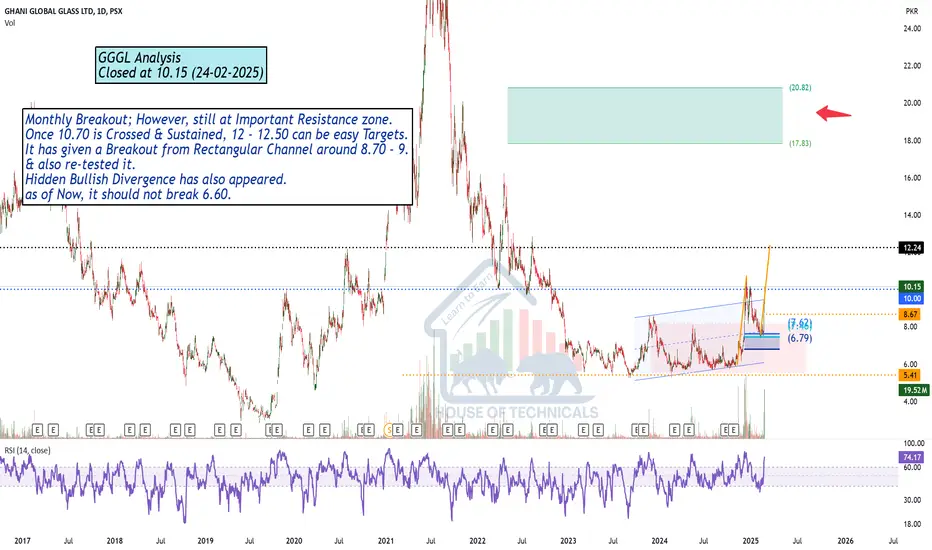
Monthly Breakout but still...Monthly Breakout; However, still at Important Resistance zone.
Once 10.70 is Crossed & Sustained, 12 - 12.50 can be easy Targets.
It has given a Breakout from Rectangular Channel around 8.70 - 9.
& also re-tested it.
Hidden Bullish Divergence has also appeared.
as of Now, it should not break 6.60.
Morning Star Formation on Weekly TF.Morning Star Formation on Weekly TF.
Strong Trendline Support around 9.40 - 9.50
However, Accumulation can be started from
Current Level (10 - 10.50);
Should not Break 8 (even in worst cases)
Upside Targets can be around 13 - 14 & then
16 -18
