LCI - Lucy Core Industries - BuyBuying signal generated yesterday, since the move was big, so a correction was due today, if everything is good it will possibly do small correction and then will move up in coming days. partial profit is at resistance zone, hold for more as it can go sideways after hitting resistance or may come down even.

PSX FFL TRADE IDEA LOOKING STRONG ON H2 AND H4FFL IS LOOKING STRONGON H2 AND H4. The stock retest its equal low where all of the big liquidity was resting at 14.50 Now the stock is heading to the next h2 resistance the breakout at H2 resistance with good volume will start a quick uptrend. Watch for volumes and orderbook.
The next target will be the previous lower low around 16.
Trading above EMA 21 at H2 AND H4.
VOLUME GAINER.
Buy before breakout if the volumes are rising watch on shorter time frame and see how the price reacts near the resistance. WATCH THE ORDERBOOK MUST and see what is being played there.

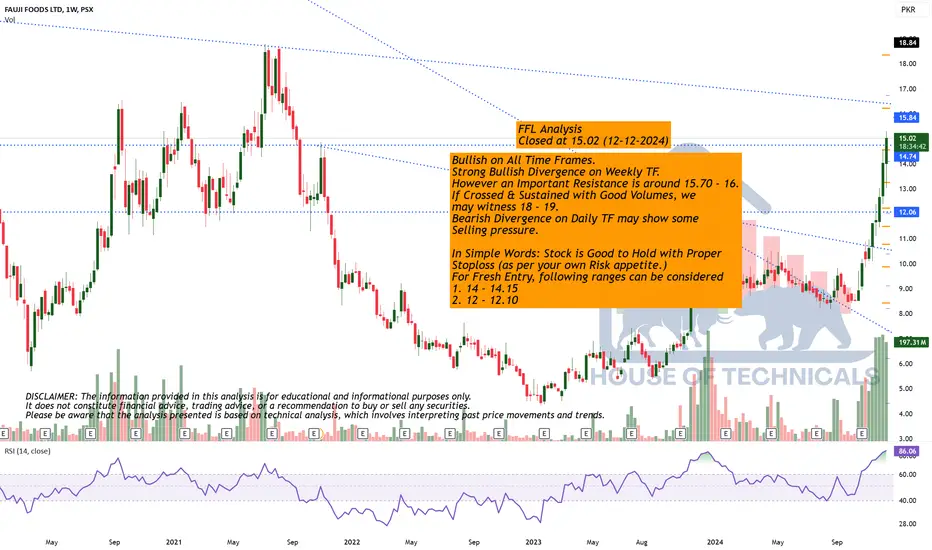
BullishBullish on All Time Frames.
Strong Bullish Divergence on Weekly TF.
However an Important Resistance is around 15.70 - 16.
If Crossed & Sustained with Good Volumes, we
may witness 18 - 19.
Bearish Divergence on Daily TF may show some
Selling pressure.
In Simple Words: Stock is Good to Hold with Proper
Stoploss (as per your own Risk appetite.)
For Fresh Entry, following ranges can be considered
1. 14 - 14.15
2. 12 - 12.10
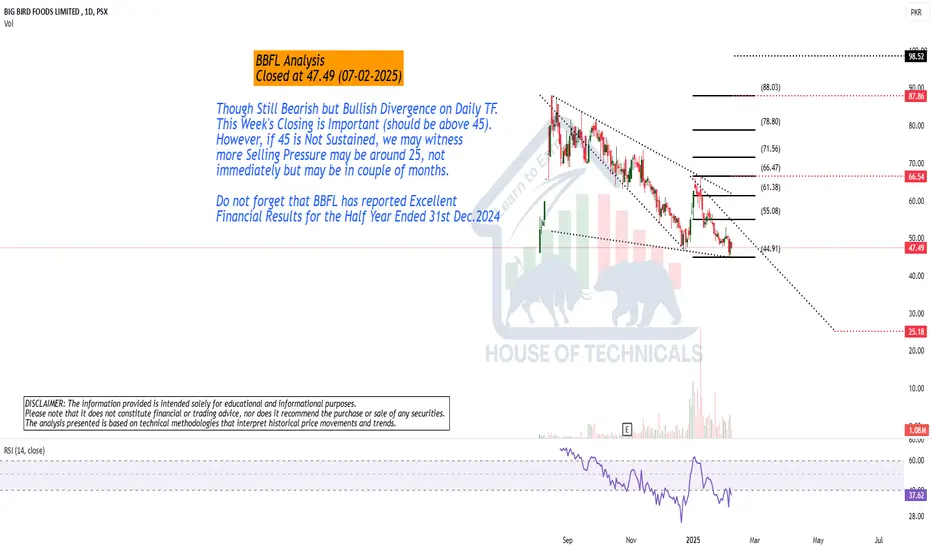
Though Still Bearish but...Though Still Bearish but Bullish Divergence on Daily TF.
This Week's Closing is Important (should be above 45).
However, if 45 is Not Sustained, we may witness
more Selling Pressure may be around 25, not
immediately but may be in couple of months.
Do not forget that BBFL has reported Excellent
Financial Results for the Half Year Ended 31st Dec.2024
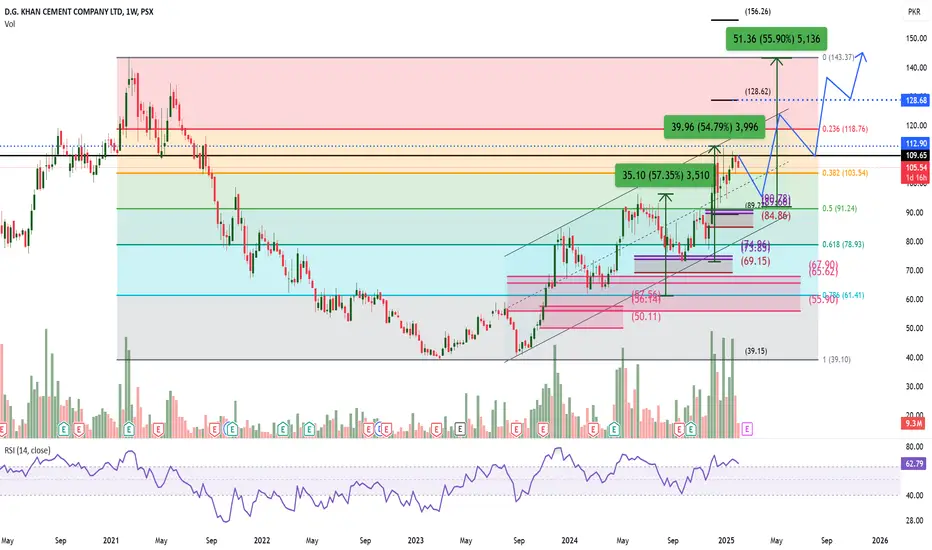
DgkcFinally starting to rally after long consolidation.potential leader if this bull market continues.

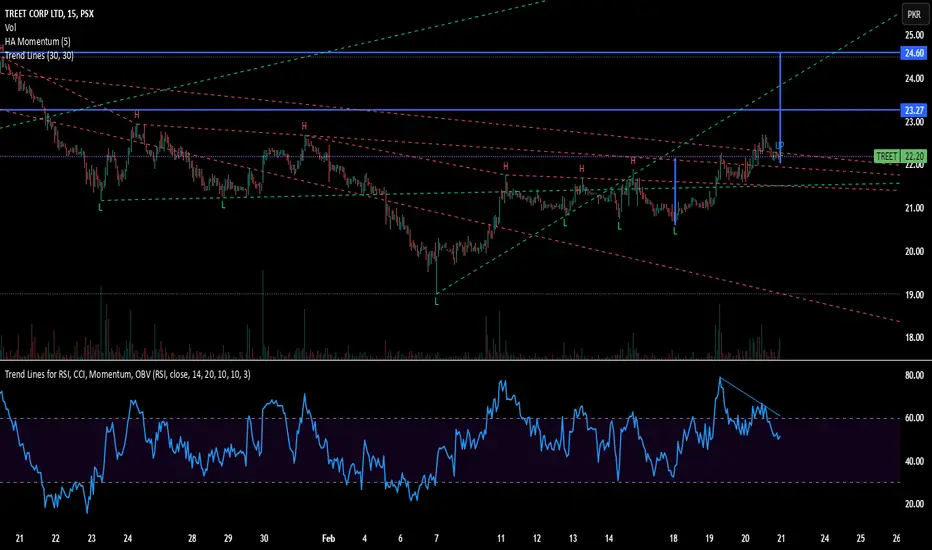
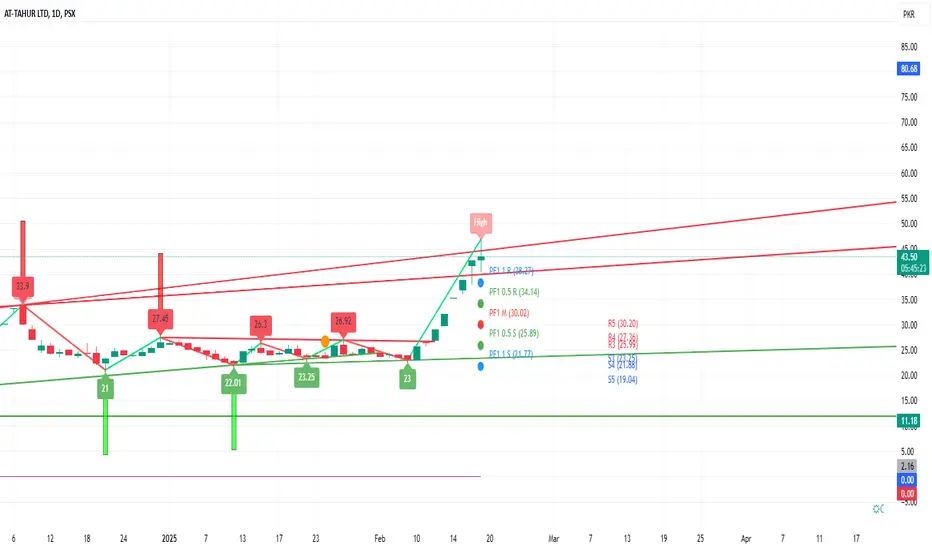
Chart is a technical analysis of TREET Corp Ltd (PSX: TREET).Key Observations:
Price Action:
Current price: 22.20 PKR
Recent high: 23.27 PKR
Resistance level at 24.60 PKR
Support around 21.00 PKR
Price has broken above a trendline, signaling a potential bullish breakout.
Technical Patterns:
Head and Shoulders Formation in the middle of the chart, followed by a breakout.
Trendlines (dashed red and green) indicate a downtrend reversal.
Measured move projection suggests potential targets at 23.27 PKR and 24.60 PKR.
Momentum Indicators:
RSI (Relative Strength Index) is around 51.39, indicating neutral momentum.
Bearish Divergence seen in RSI (lower highs in RSI vs. higher highs in price), which could indicate weakening momentum.
Volume spikes suggest buying interest.
Conclusion:
The price has recently broken out of a consolidation phase and is testing resistance levels.
If TREET sustains above 22.20, it could test 23.27 and 24.60.
However, the RSI bearish divergence warns of possible exhaustion.
If the price falls below 21.00, a retest of lower supports (around 19.00) could occur.
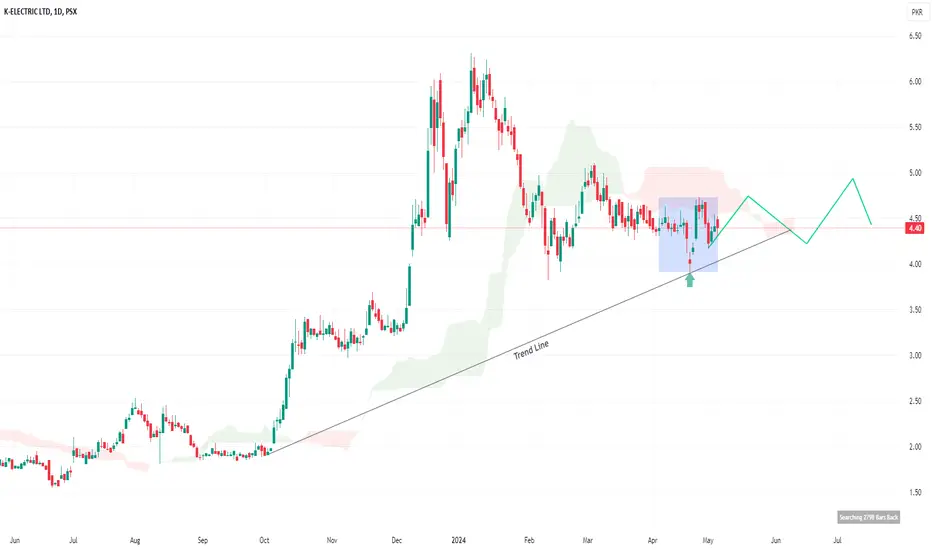
KEL🚀 Stock Alert: KEL
📈 Investment View: Technically Bullish 📈
🔍 Quick Info:
📈 Entry Level: 4.50
🎯 First Target: 5
🎯 Second Target: 5.50
⚠ Stop Loss: 4
⏳ Nature of Trade: Short Term (Scalping)
📉 Risk Level: Medium
☪ Shariah Compliant: YES
💰 Dividend Paying: NO
📰 Technical View: The price action pull back from its trend line and currently trading in a consolidation phase. Upon break out price can test its initial resistance around 5 and upon breaching secondary resistance lies around 5.50. Use stop loss at 4.50 if it breaks downward to manage risk.
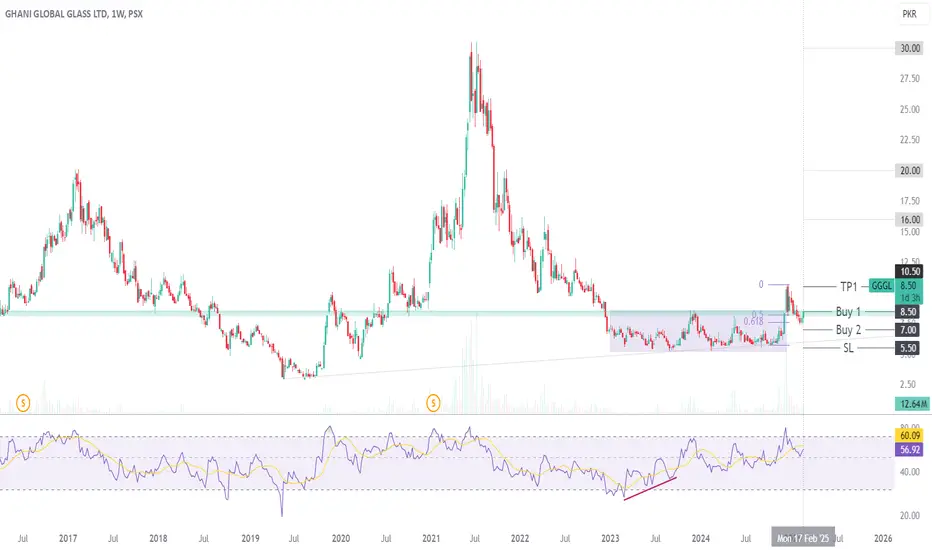
GGGL: Potential Weekly Breakout TradeGGGL presents an interesting weekly trading opportunity. The stock recently broke out from an approximately 100-week consolidation period, signaling a potential long-term upside. Following the breakout, the price successfully retested the weekly support zone around 8. The weekly candle closed at the 0.5 Fibonacci retracement level, a key area for potential reversals. A bullish divergence initially signaled potential upside, and although the price subsequently entered a consolidation phase, the RSI has now synced with the price action, suggesting renewed upward momentum.
Trading Recommendations:
Buy 1 (CMP): 8.5
Buy 2: 7
Stop-Loss: Closing below 5.5
Take Profit 1: 10.5
Other Potential Targets: 16, 20, and 30 (near all-time highs)
Happy trading!
DGKC ACCUMULATION BOX TRADE IDEADGKC IS TRADING IN A ACCUMULATION BOX. HALF YR RESULT WILL BE ANNOUNCED TODAY. EXPECTING GOOD RESULTS WHICH WILL BREAK THE ACCUMULATION BOX.
THE REAL REISTANCE IS AT 108.20 WHICH IS THE WEEKLY PREVIOUS HIGHER LOW AFTER WHICH THE STOCK WENT DOWN to all time low.
HOWEVER THERE IS A DEVIATION FROM 109 TO 112.
AT THE BREAKOUT AT 112 WITH LARGE VOLUMES will start the uptrend
A retest might be possible at the top of accumualation box at 112. Watch on 5m and 15m The EMA 21 is currently acting as a support.
the next quick target will be 116 . If the stock gives a strong breakout above 116 then 122 looks like the next target.

SNGP - LongIt is a slow item, but due to IMF pressure prices of GAs will increase for industry and residential customers which will benefit SNGP. Also, their line losses have reduced singificantly that will improve thier profitability.
I am eyeing a long-term target of Rs 165
Short/medium-term targets are Rs 104, 115 and 124
SL and retesting area 91.5 to 92
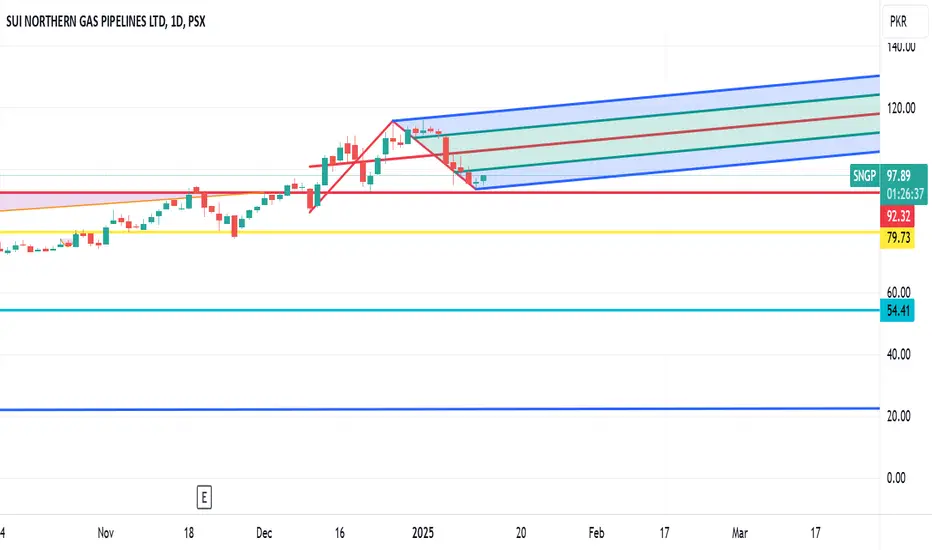
Series of HH HLBeautiful HH HL formation.
It may give a good move upside if retrace till 90-91.
Upside targets can be 128 - 130 & then 143 - 145.
However, 109 - 110 is an Important Resistance level.
Bullish DivergenceBullish Divergence at a Support Level.
10.52 should be Sustained on Monthly Basis.

DGKC ID Chart PSX - Ascending Triangle Buy StrategyDGKC ID Chart - Ascending Triangle Buy Strategy:
- Buy at Current Price: Enter the trade at the current market price.
- Stop Loss: Set a stop loss at 101 to minimize potential losses.
- Take Profit 1 (TP1): Target a first take profit at 132.
- Take Profit 2 (TP2): Set a second take profit at 153 for additional gains.
- "DGKC has delivered impressive results, showcasing strong financial performance and growth."
- "The company's strategic initiatives have paid off, resulting in robust earnings and market confidence."
- "DGKC continues to exceed expectations, reinforcing its position as a leader in the cement industry."
Happy Trading.

SYS-LONGOn the daily chart, bullish divergence has been identified, implying the continuation of the current upward trend. Good fundamental stock also give a good profit in short time.

GTYR Technical Analysis: Potential Buy OpportunityOn the daily chart, GTYR is on a steady upward path within an ascending channel, currently testing the Fib 0.5 level. Buy1 is recommended at CMP(46), and Buy2 is recommended at 40—a level that also serves as channel support. A stop-loss on a closing basis is advised below 34. The first target is 55; if the price moves past the channel resistance after that, further targets of 64 and 78 could be reached. The setup shows strong potential with the trendline intact and the RSI in sync. Happy trading!

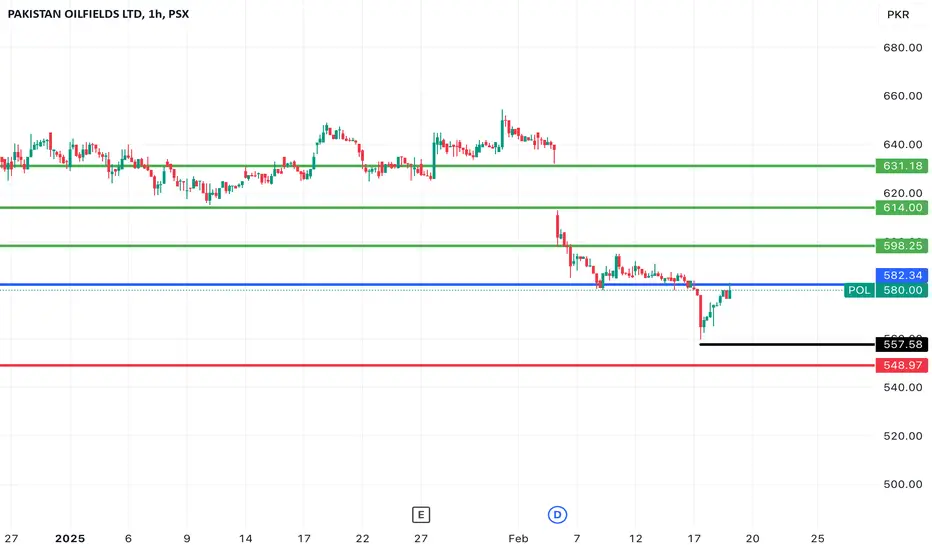
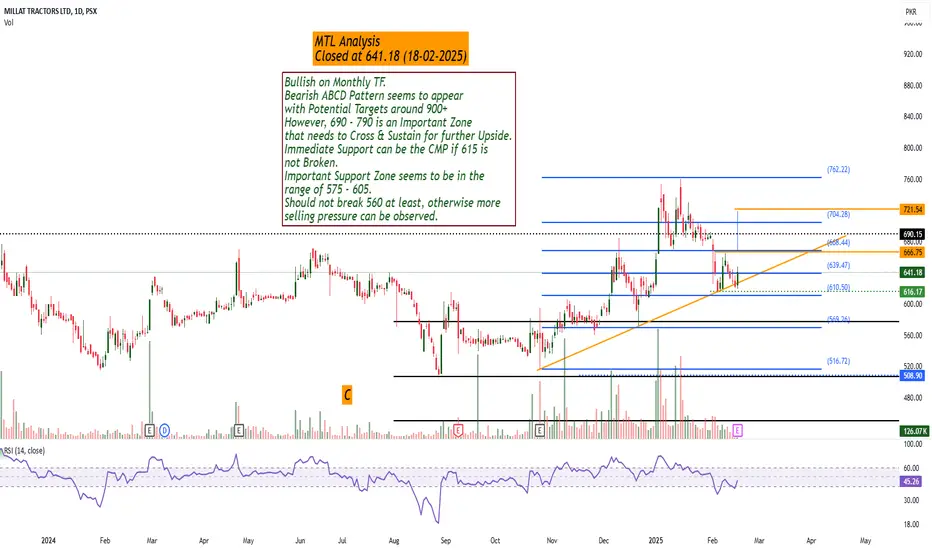
Bullish on Monthly TF.
Bearish ABCD Pattern seems to appear
with Potential Targets around 900+
However, 690 - 790 is an Important Zone
that needs to Cross & Sustain for further Upside.
Immediate Support can be the CMP if 615 is
not Broken.
Important Support Zone seems to be in the
range of 575 - 605.
Should not break 560 at least, otherwise more
selling pressure can be observed.
PREMA-SHORTThat stock gave us 90 % profit now it will take correction so sell it here and wait for again BUY opportunity .

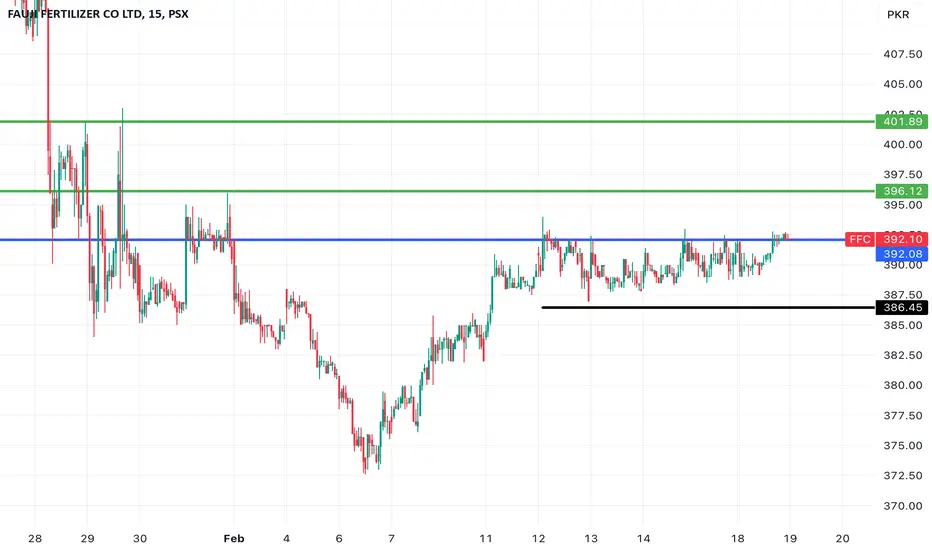
FFCafter posting a bottom FFC IS now ACCUMULATING from last 1 week, Long entry is recommended from this point.
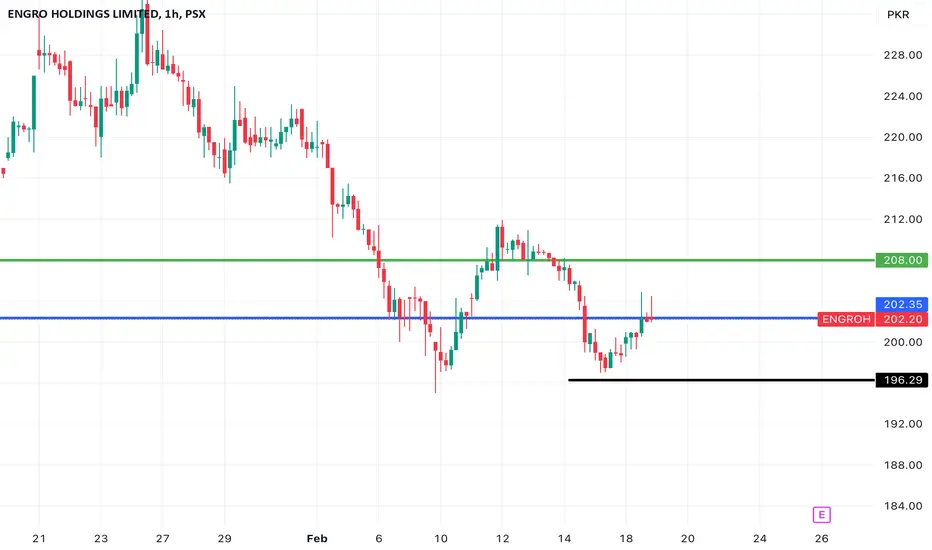
Engrohafter posting a bottom engroh is moving upside NOW, Long entry is recommended from this point.