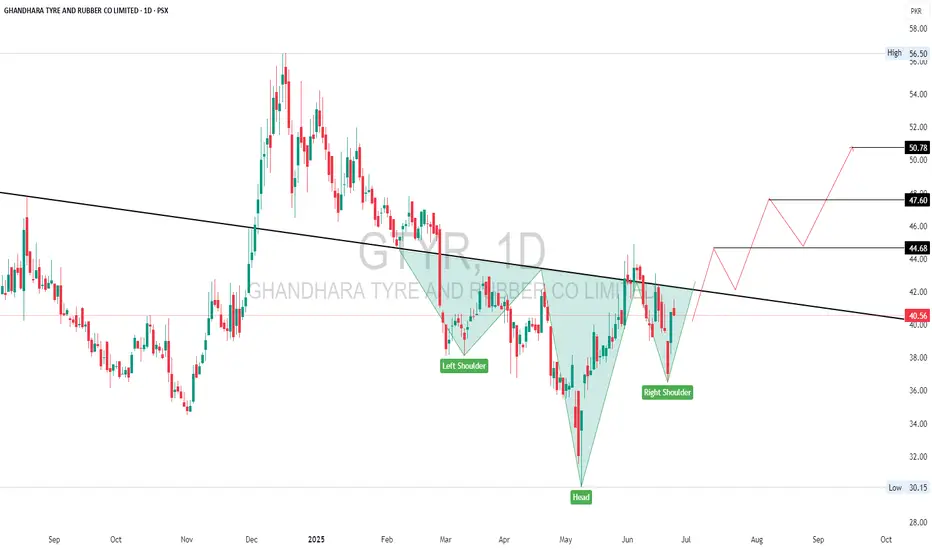
GTYR | Inverse Head & Shoulder PatternGTYR on the daily timeframe shows a classic Inverse Head and Shoulders pattern forming, indicating a potential bullish reversal. The pattern is well-defined with the left shoulder, head, and right shoulder, and price is currently testing the neckline resistance around PKR 41. A successful breakout above the neckline could trigger a strong upward move, with projected targets around 44.68, 47.60, and ultimately 50.78. Confirmation of breakout and sustained volume will strengthen the bullish case.
Excellent Retracement till 69.BNWM CMP 77.07
07-07-2025 10:50AM
Excellent Retracement till 69.
Still has potential to move up again.
Immediate Resistances are 83 & then 90 - 93
However, should not break 68.80 now.


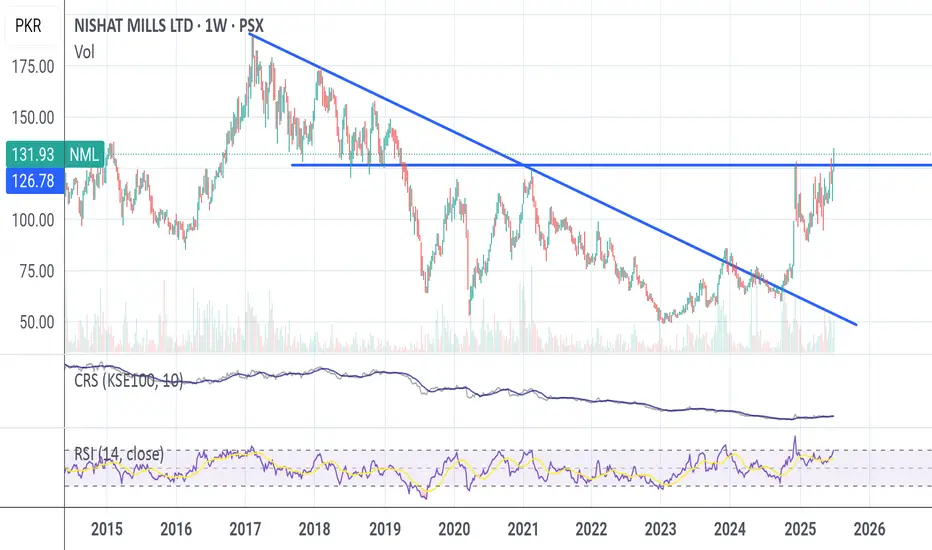
NMLStarting to move high from key polarity zone. Just like other textile companies, this one also looks good.
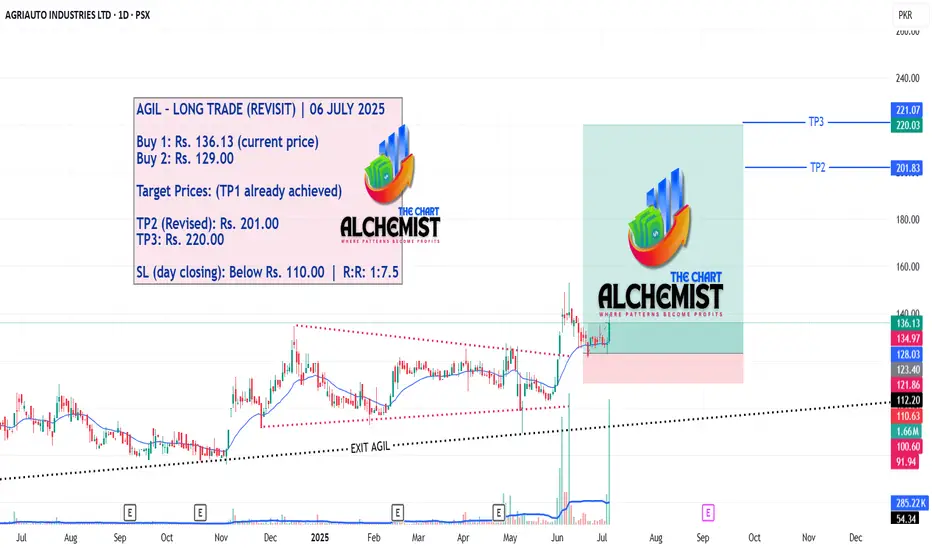
AGIL LON TRADE REVISIT CALL - FRESH ENTRY 06/07/2025AGIL – LONG TRADE (REVISIT) | 06 JULY 2025
Buy 1: Rs. 136.13 (current price)
Buy 2: Rs. 129.00
Target Prices: (TP1 already achieved)
TP2 (Revised): Rs. 201.00
TP3: Rs. 220.00
SL (day closing): Below Rs. 110.00 | R:R: 1:7.5
AGIL – LONG TRADE (REVISIT) | 06 JULY 2025
Our previous call on AGIL successfully hit TP1, followed by a corrective pullback that now seems complete. The price action supports a continuation of the uptrend, presenting a fresh high-potential entry with an excellent reward-to-risk ratio.
📢 Disclaimer: Do not copy or redistribute signals without prior consent or proper credit to The Chart Alchemist (TCA).
✨ Kindly support our efforts by boosting and sharing this idea!
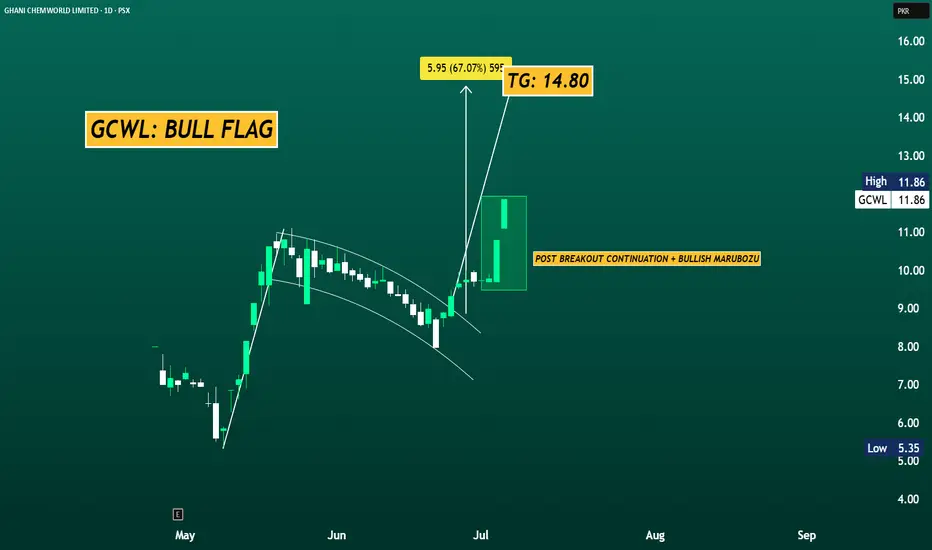
GCWL on the Move: Bull Flag Signals 25% UpsideGCWL has broken out of a bull flag with a bullish marubozu now targeting 14.80, offering a ~25% upside from current levels. Holding above 11 supports the continuation.
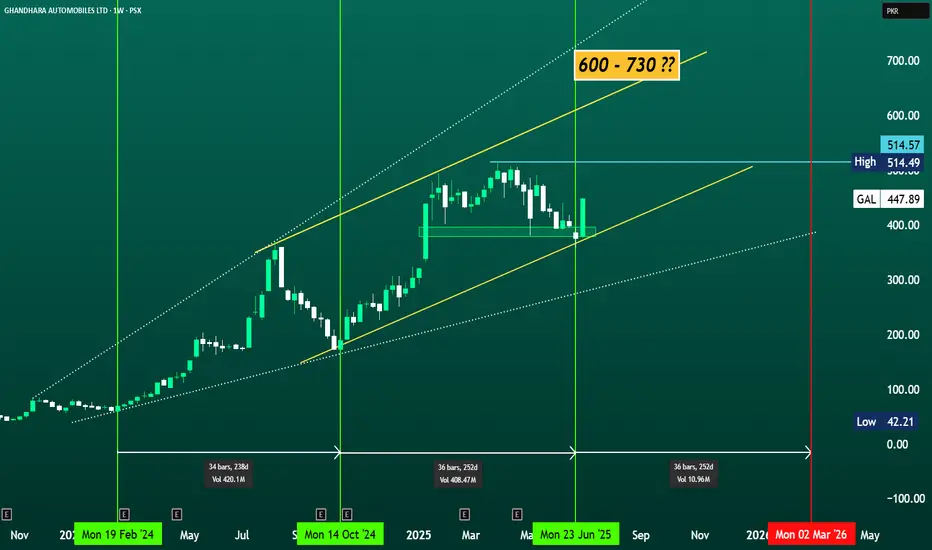
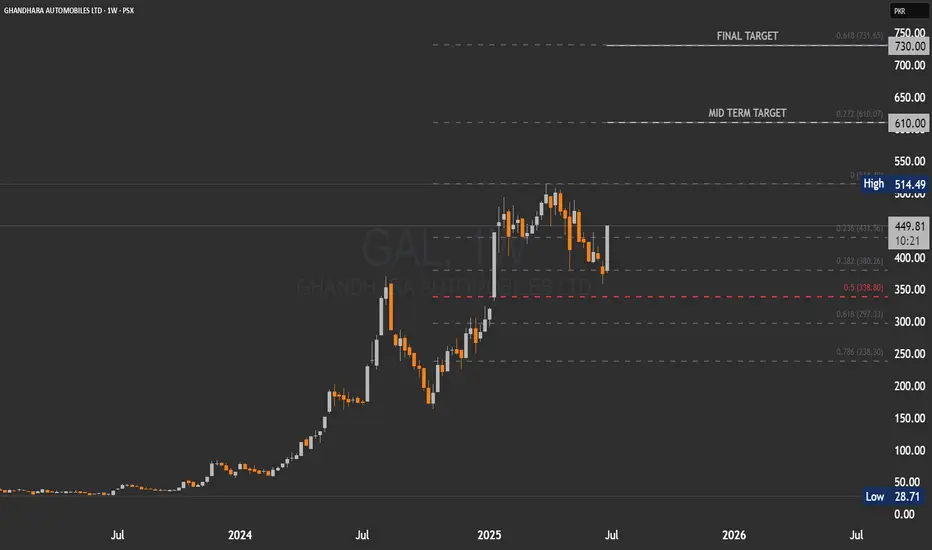
GAL (WEEKLY): Targeting 600 – 730 by Q1 2026#GAL (WEEKLY): Targeting 600 – 730 by Q1 2026
CMP: 447.89
#GAL seems to follow a cyclical rhythm of ~34–36 weeks (approx. 8–9 months) between impulsive rallies.
After strong rallies from Feb 2024 to Oct 2024, and again Oct 2024 to Jun 2025, a similar cycle is now in motion.
The most recent bounce near trendline support aligns with the next cycle start (June 2025).
Based on the channel’s slope and volume breakout, GAL may attempt a move toward 600–730 by early March 2026 (next cycle completion).
The dotted upper trendline and past Fibonacci-based extensions both validate this upside zone.
If momentum sustains and GAL holds above trendline support (around 400), the chart suggests a third impulsive wave could be underway. While speculative, the pattern rhythm and price geometry point toward 600–730 as a realistic upper zone into early 2026 — barring major macro disruptions.
This analysis is for educational and informational purposes only. It does not constitute investment advice or a recommendation to buy or sell any security. Always conduct your own research or consult with a licensed financial advisor before making investment decisions. Past performance is not indicative of future results. #kse100 #psx #tradeflow #GAL #pakistan
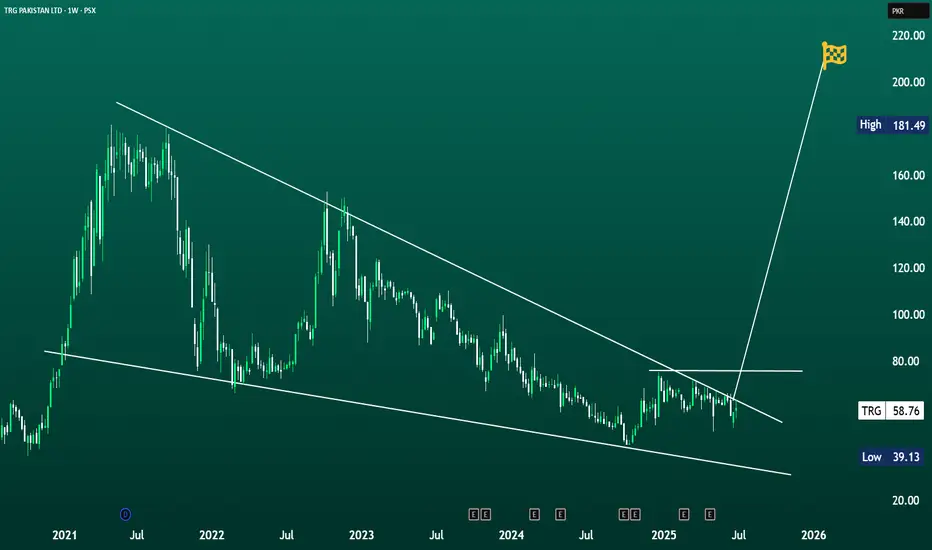
TRG FALLING WEDGE 2x... 3X...4X...?TRG ELITE KATCHRA💎
CMP: 58.76
From forgotten junk to potential multi-bagger 2x... 3X...4X...? will see what unfolds...
TRG is showing signs of a potential long-term reversal after a multi-year downtrend. Price action is compressing within a large falling wedge pattern, typically a bullish formation. A breakout above the upper trendline (~60–62) with volume could trigger a major upside move 110 - 120, with a long-term price target potentially reaching 153 - 200+.
Watch closely for confirmation abv 76.00 on weekly.
This analysis is for educational and informational purposes only. It does not constitute investment advice or a recommendation to buy or sell any security. Always conduct your own research or consult with a licensed financial advisor before making investment decisions. Past performance is not indicative of future results.
#kse100 #psx #tradeflow #trg #pakistan
No bearish divergence yet.ATRL Closed at 676.21 (04-07-2025)
Immediate Resistance around 710.
Crossing this level may lead it towards 770 - 775.
No bearish divergence yet.

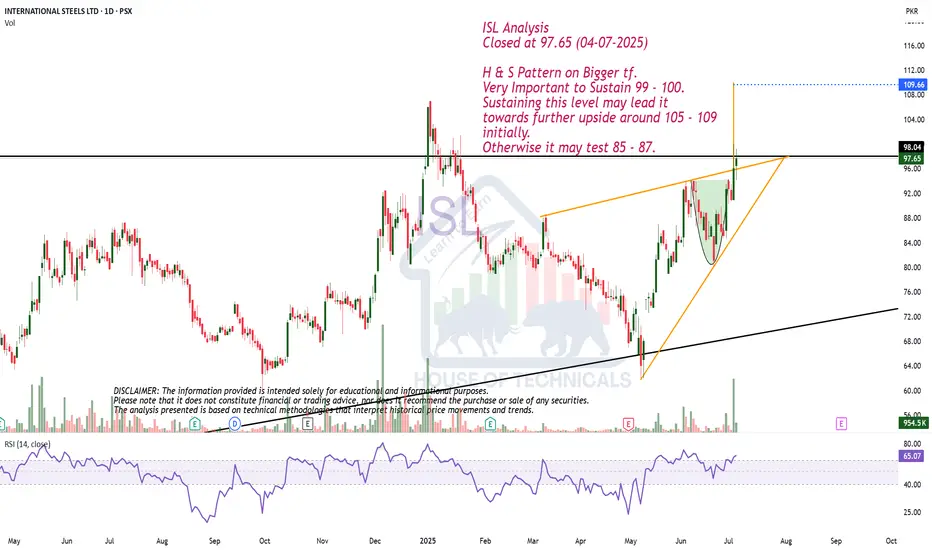
H & S Pattern on Bigger tf.ISL Analysis
Closed at 97.65 (04-07-2025)
H & S Pattern on Bigger tf.
Very Important to Sustain 99 - 100.
Sustaining this level may lead it
towards further upside around 105 - 109
initially.
Otherwise it may test 85 - 87.
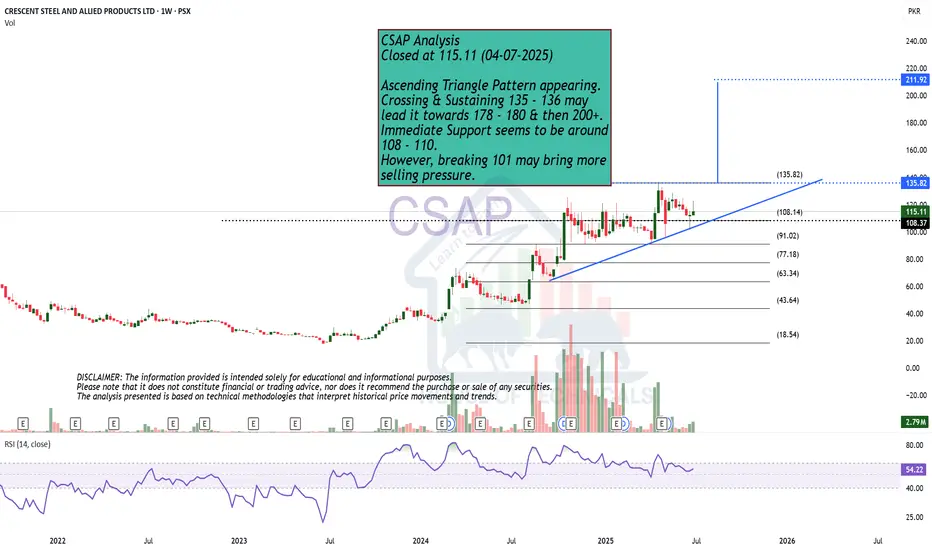
Ascending Triangle Pattern appearing.CSAP Analysis
Closed at 115.11 (04-07-2025)
Ascending Triangle Pattern appearing.
Crossing & Sustaining 135 - 136 may
lead it towards 178 - 180 & then 200+.
Immediate Support seems to be around
108 - 110.
However, breaking 101 may bring more
selling pressure.
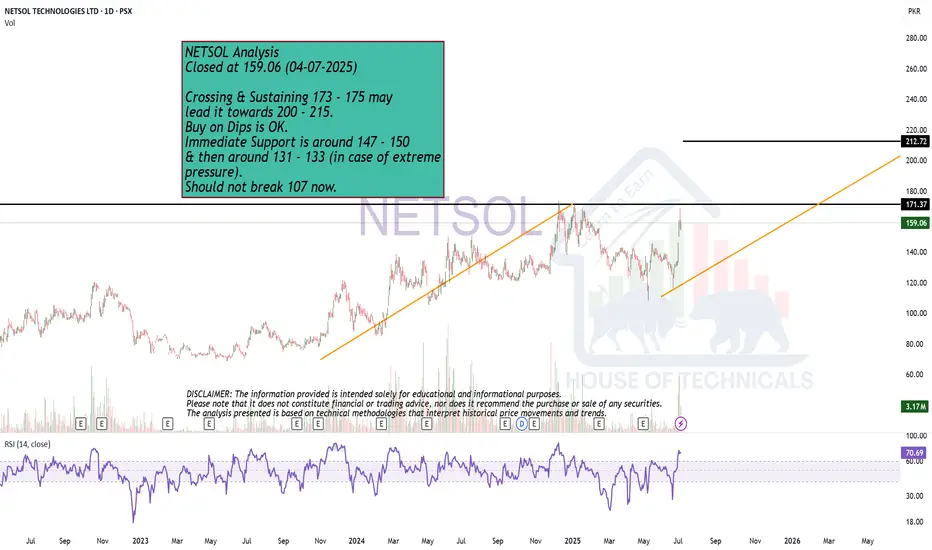
ABCD Pattern NETSOL Analysis
Closed at 159.06 (04-07-2025)
Crossing & Sustaining 173 - 175 may
lead it towards 200 - 215.
Buy on Dips is OK.
Immediate Support is around 147 - 150
& then around 131 - 133 (in case of extreme
pressure).
Should not break 107 now.
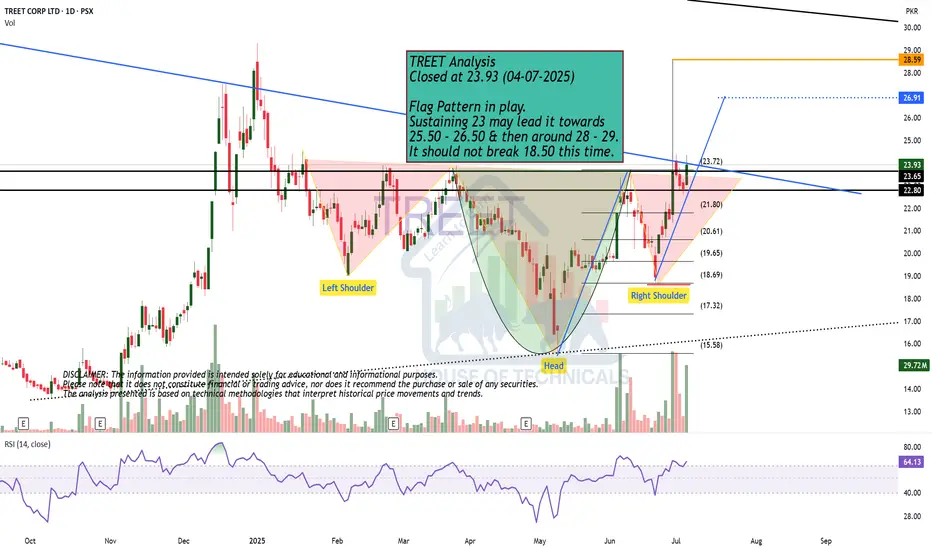
Flag Pattern in play. TREET Analysis
Closed at 23.93 (04-07-2025)
Flag Pattern in play.
Sustaining 23 may lead it towards
25.50 - 26.50 & then around 28 - 29.
It should not break 18.50 this time.
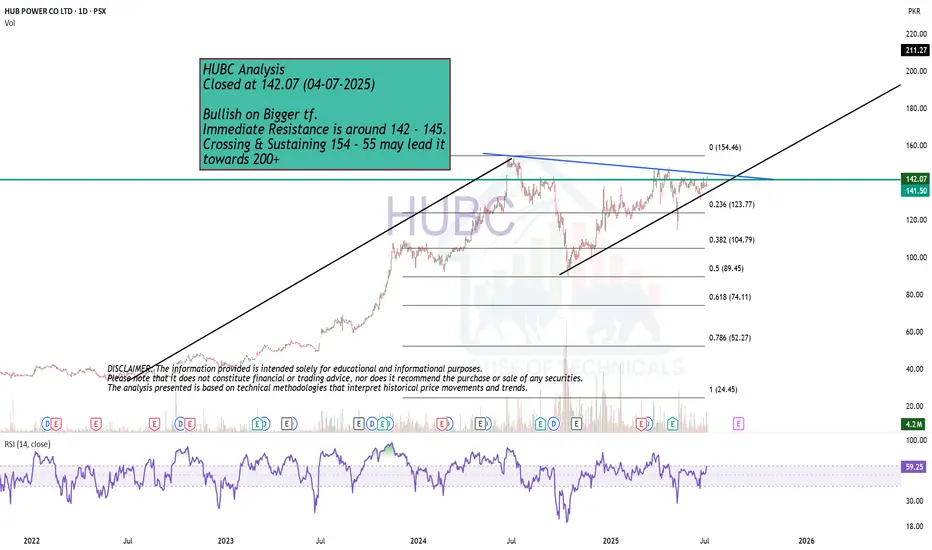
Bullish on Bigger tf.HUBC Analysis
Closed at 142.07 (04-07-2025)
Bullish on Bigger tf.
Immediate Resistance is around 142 - 145.
Crossing & Sustaining 154 - 55 may lead it
towards 200+
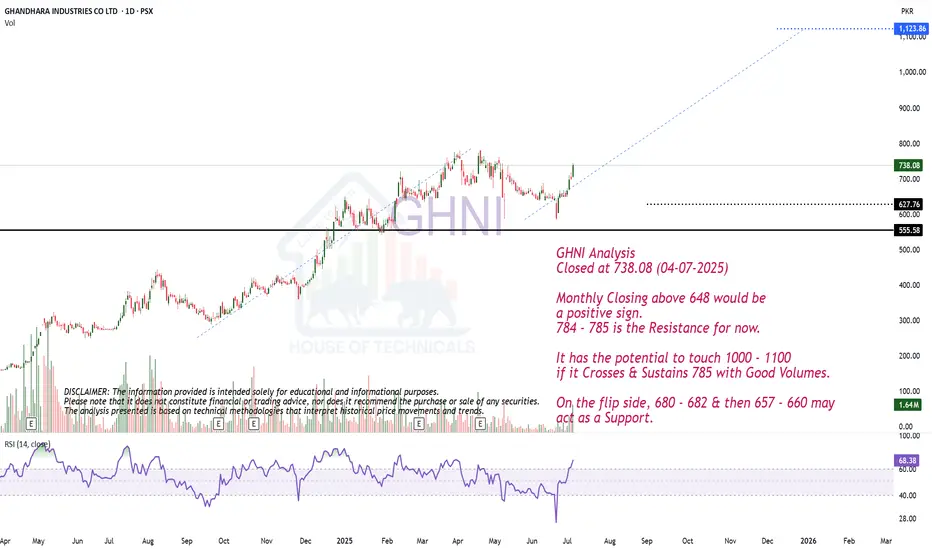
ABCD PatternGHNI Analysis
Closed at 738.08 (04-07-2025)
Monthly Closing above 648 would be
a positive sign.
784 - 785 is the Resistance for now.
It has the potential to touch 1000 - 1100
if it Crosses & Sustains 785 with Good Volumes.
On the flip side, 680 - 682 & then 657 - 660 may
act as a Support.
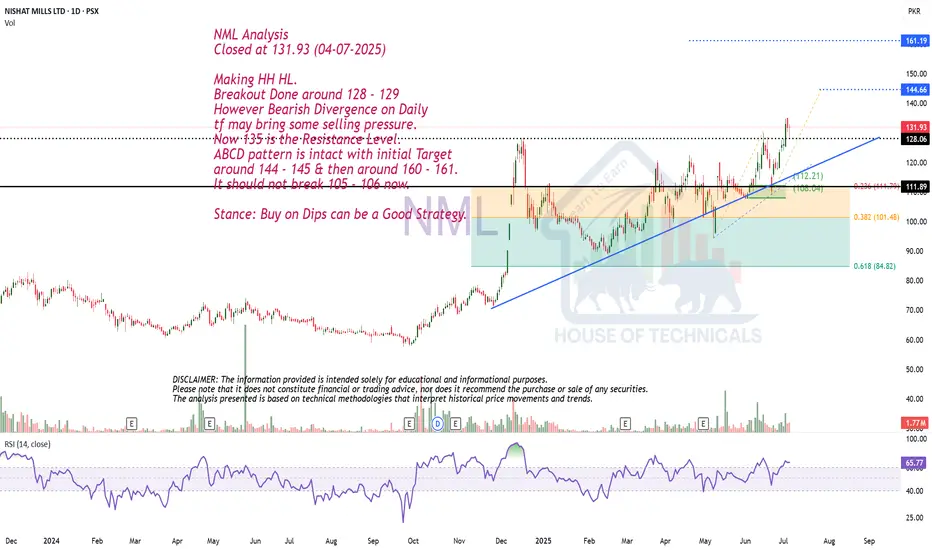
Making HH HL.NML Analysis
Closed at 131.93 (04-07-2025)
Making HH HL.
Breakout Done around 128 - 129
However Bearish Divergence on Daily
tf may bring some selling pressure.
Now 135 is the Resistance Level.
ABCD pattern is intact with initial Target
around 144 - 145 & then around 160 - 161.
It should not break 105 - 106 now.
Stance: Buy on Dips can be a Good Strategy.
GAL | When To, How To?The weekly chart of GAL shows a strong bullish reversal after a prolonged correction phase. The stock has surged by nearly 19% this week, indicating renewed buying interest and potential trend continuation. Key resistance zones lie at 610 (mid-term target) and 730 (final target), while support rests near the breakout area of 446. Sustaining above this level may lead to further upside, though minor pullbacks could occur as part of healthy profit-taking. Overall, the chart structure favors a bullish outlook with a medium- to long-term perspective.
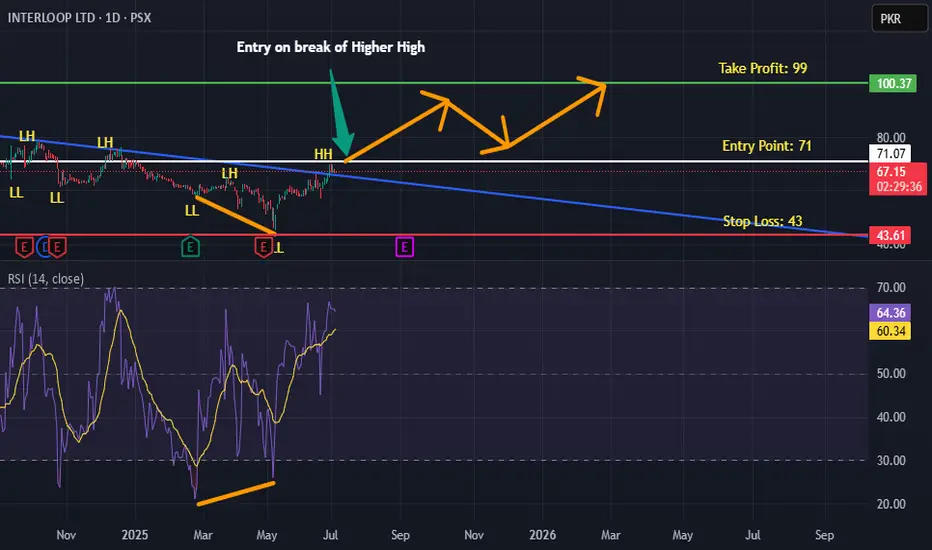
ILP is BullishPrice was in a strong downtrend, however the breakout of the daily descending trendline and printing of a higher high hints the control of bulls. If freshly printed HH is broken with good volume then we can expect a bullish rally as per Dow theory. Targets are mentioned on the chart.
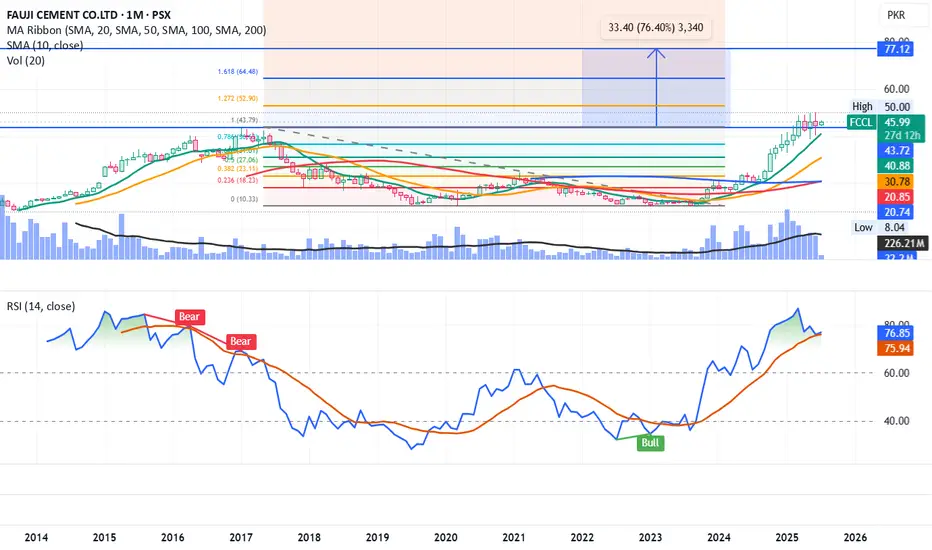
FCCL LongGolden cross on weekly time frame. RSI has cooled down and is ready to take off again.
Possible target is 77.
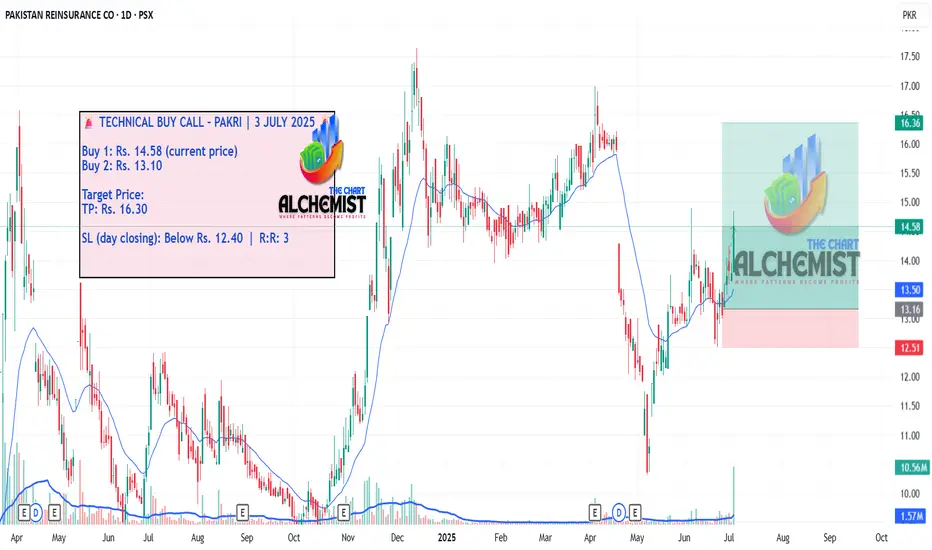
PAKRI LONG TRADE 03/07/2025PAKRI – LONG TRADE | 3 JULY 2025
After forming a selling climax at Rs. 10.30, PAKRIA gradually reversed and consolidated in a sideways range for several days. The latest price structure indicates a likely breakout move, suggesting renewed bullish momentum with a high probability of reaching the projected target.
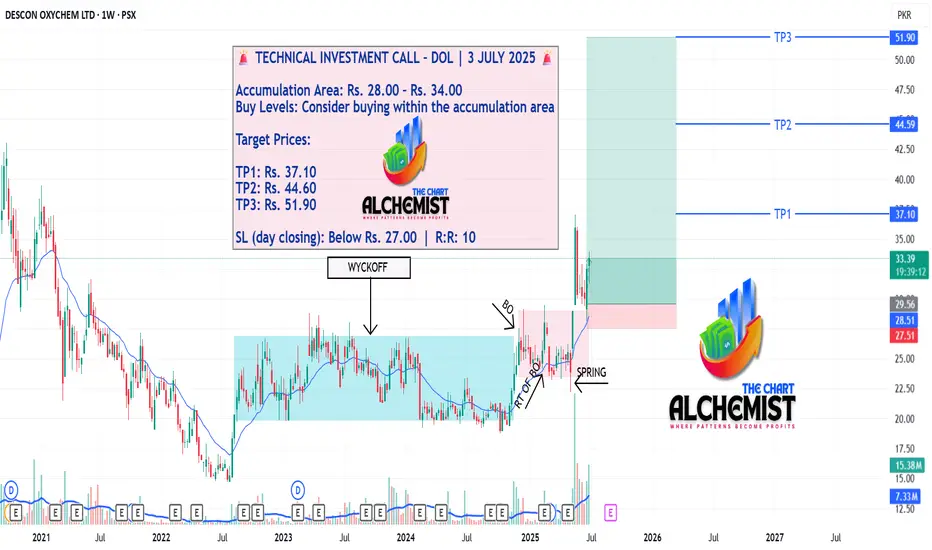
DOL LONG TRADE 03/07/2025DOL – LONG TRADE | 3 JULY 2025
DOL has moved through multiple trading ranges (highlighted with different colors) and has now completed its accumulation phase. Following a breakout from this zone, the stock has displayed solid momentum by achieving prior targets. The current technical structure indicates a high-probability investment setup, with potential for continued upside over the coming weeks.
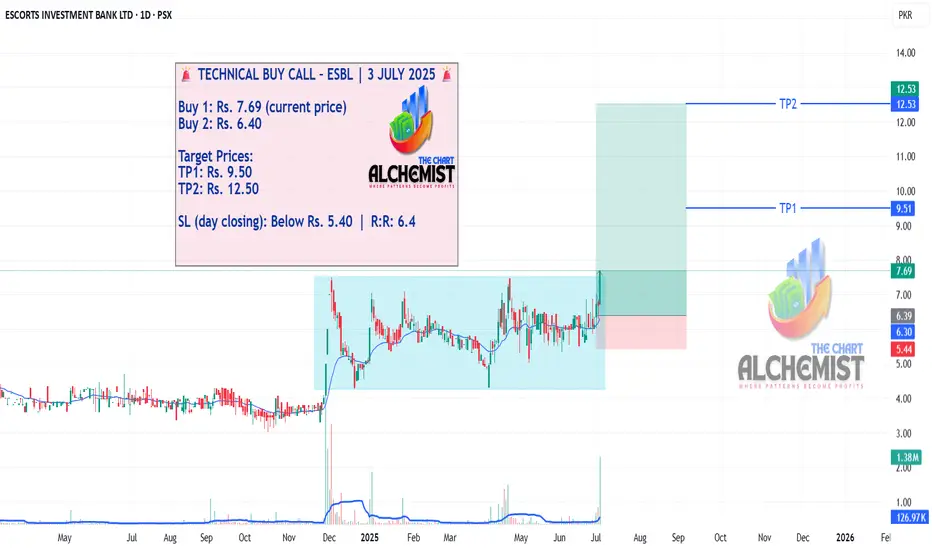
ESBL LONG TRADE 03/07/2025ESBL – LONG TRADE | 3 JULY 2025
ESBL is currently trading within a light blue range-bound channel, and today’s closing price action strongly indicates that this range is evolving into a Bull Flag pattern. This setup supports the expectation of a breakout move, with the potential to hit multiple quantified displacement targets.
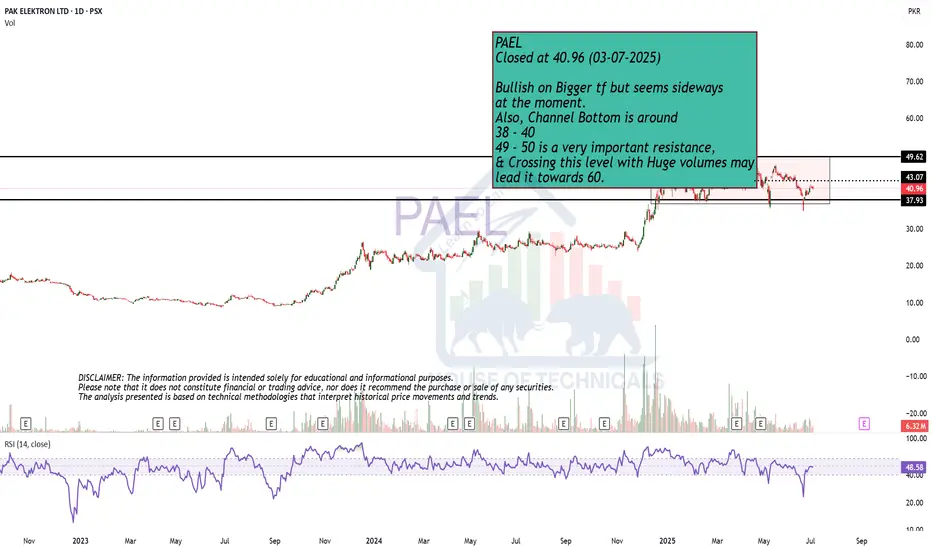
Bullish on Bigger tf but ..PAEL
Closed at 40.96 (03-07-2025)
Bullish on Bigger tf but seems sideways
at the moment.
Also, Channel Bottom is around
38 - 40
49 - 50 is a very important resistance,
& Crossing this level with Huge volumes may
lead it towards 60.