Play on Levels.GAL Analysis
Closed at 408.92 (03-07-2025)
Important Support is around 367 - 382
Resistance is around 433 and then around
450 - 455.
Crossing 460 may lead it towards 500+
However, breaking 365 may bring more
selling pressure towards 340.

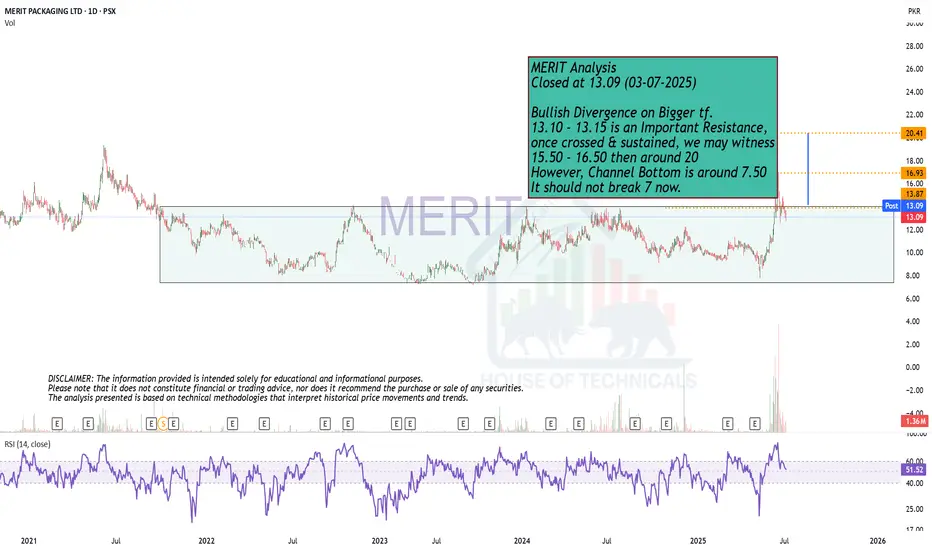
Bullish Divergence on Bigger tf.MERIT Analysis
Closed at 13.09 (03-07-2025)
Bullish Divergence on Bigger tf.
13.10 - 13.15 is an Important Resistance,
once crossed & sustained, we may witness
15.50 - 16.50 then around 20
However, Channel Bottom is around 7.50
It should not break 7 now.
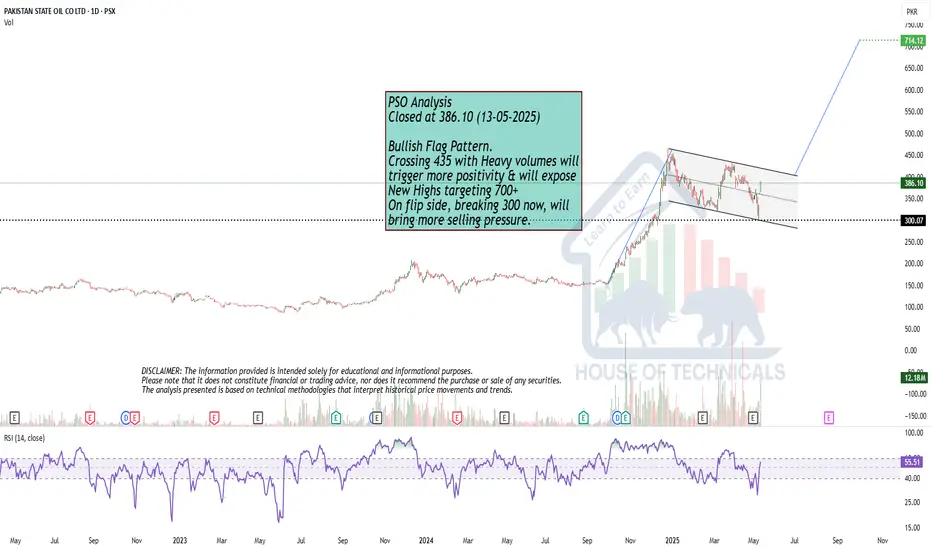
Bullish Flag Pattern.
Bullish Flag Pattern.
Crossing 435 with Heavy volumes will
trigger more positivity & will expose
New Highs targeting 700+
On flip side, breaking 300 now, will
bring more selling pressure.
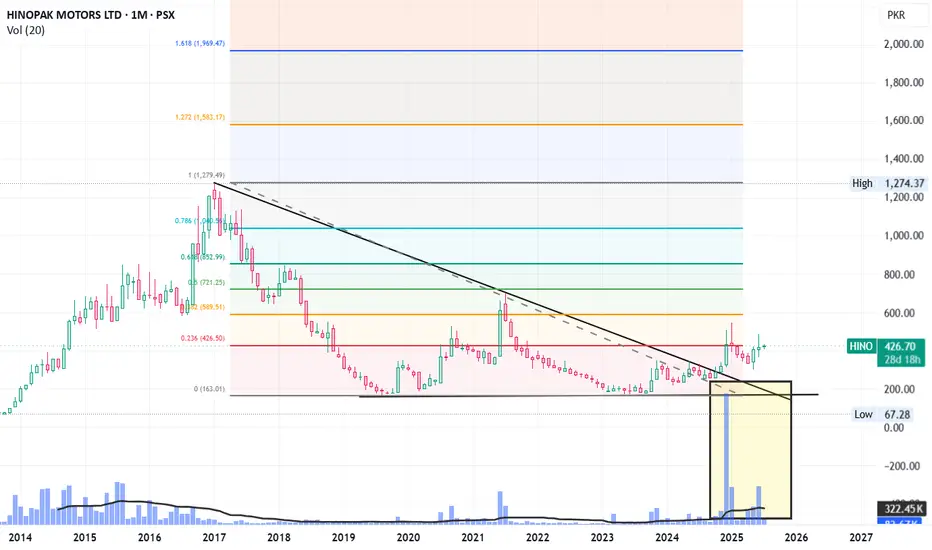
HINO LongHino broke its downward channel line in November 24. It posted a high of 545 in Jan 25 and came back to retest the level which broke the downward channel (~300).
Now it is exactly at its Fib 0.236 level, crossing which, it will pace up and move towards its next levels.
Next levels are: 545, 589, 721 and 853 in short to medium term.
Long terms target can be its all-time high level of 1274.
Its not a buy / sell call, just my personal opinion.
Daily, weekly and Monthly RSI are all at or around 60 that show positive momentum.
Moreover, the increasing volumes since it broke downward channel showing active players ;)
One thing to note that its free float is very low, that will cause its very fast move upward (whenever it may be)
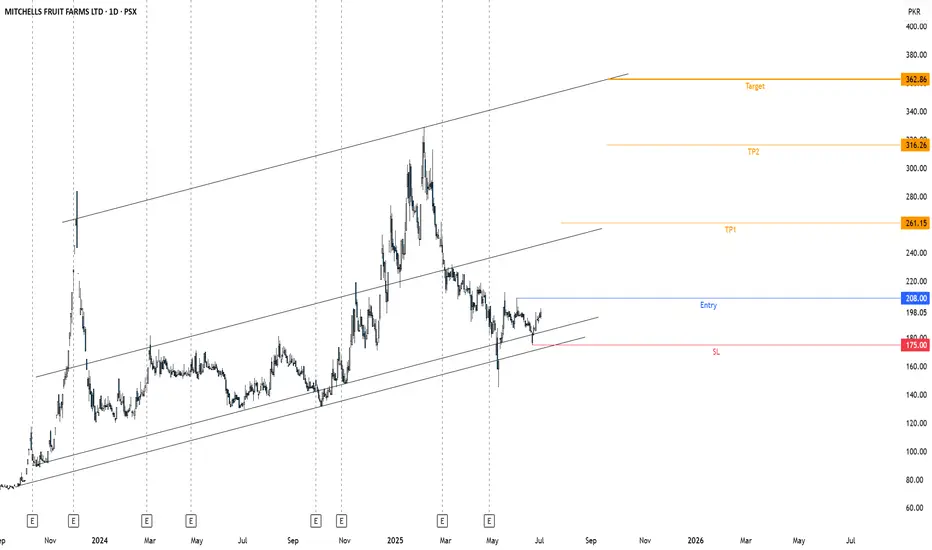
MFFL is in Rising ChannelMFFL is in Rising Channel, an entry may be taken on the breakout of the nearest resistance.
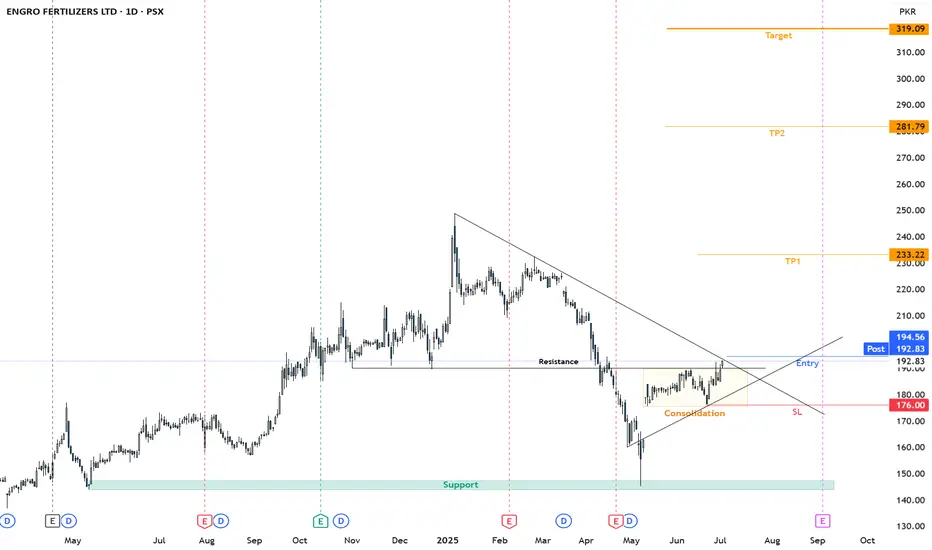
EFERT Consolidation BreakoutEFERT has given the Consolidation Breakout and can provide short-term as well as long-term targets.
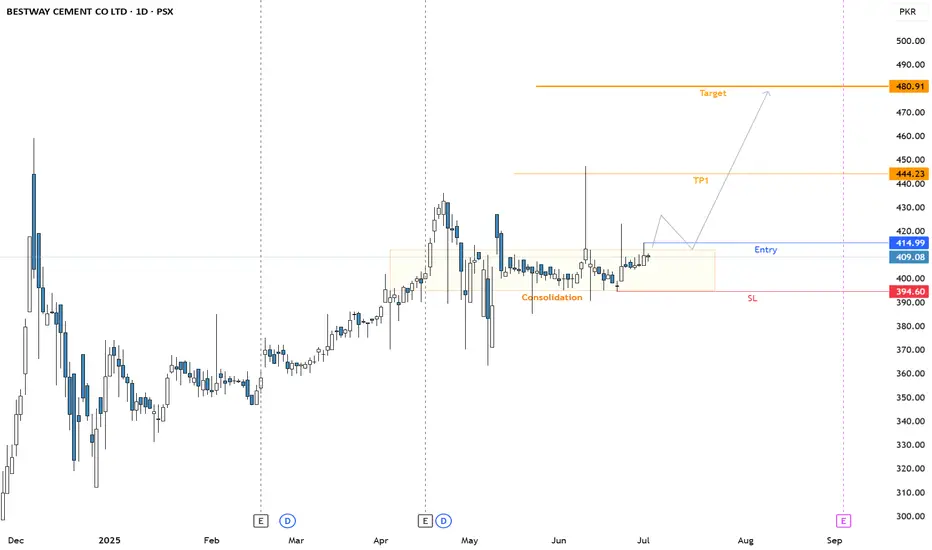
BWCL is about to breakout consolidation phaseBWCL is about to break out of the consolidation phase, and a bullish momentum may be expected.
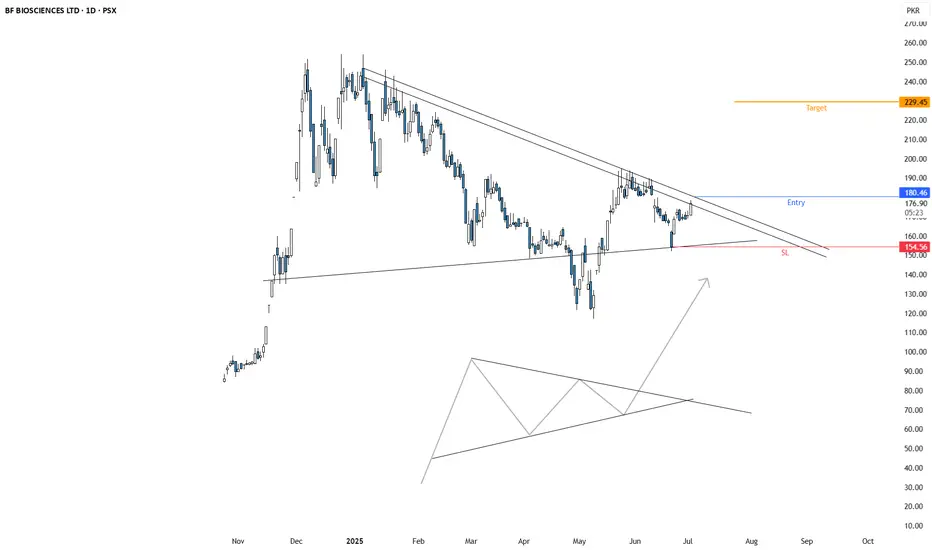
BFBIO Triangle BreakoutBFBIO has given the Triangle Breakout, and a bullish momentum may be observed.
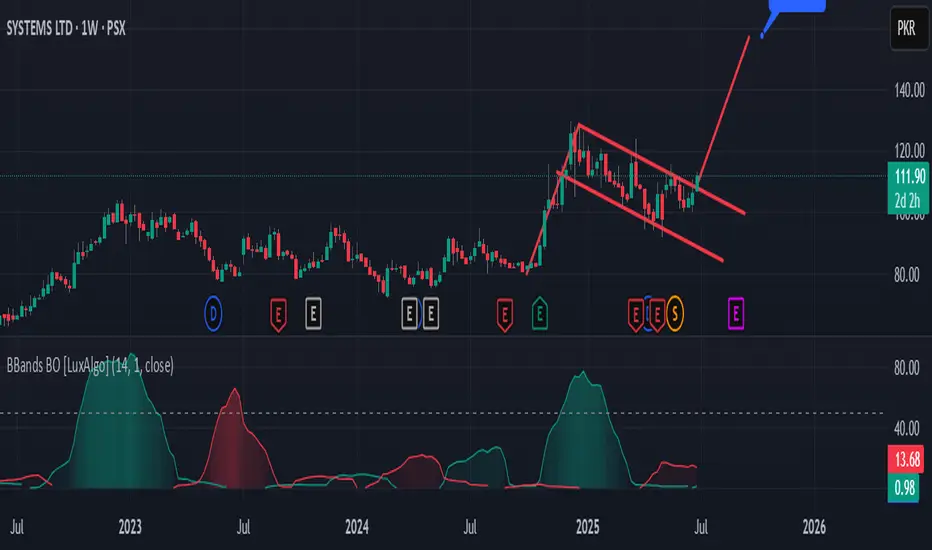
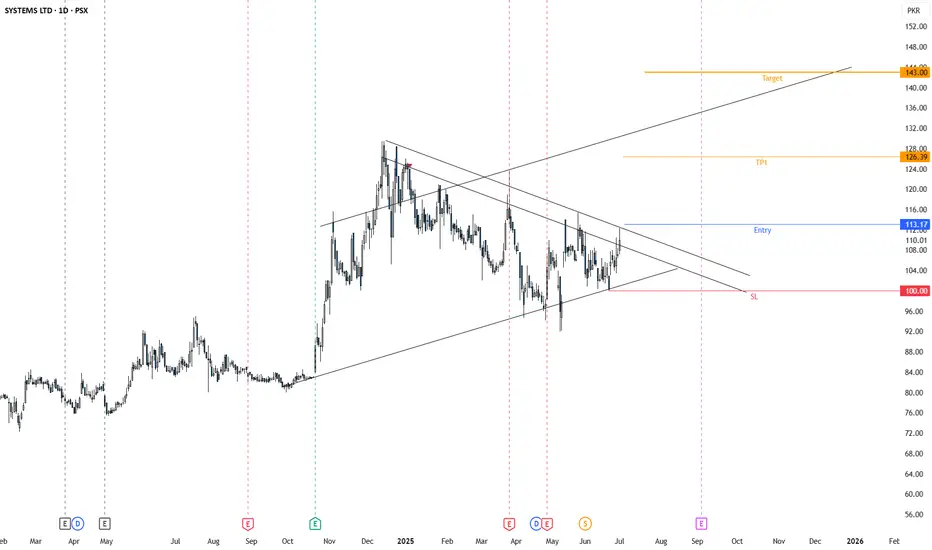
SYS: System limited flag pattern breakoutPrice has broken out form flag pattern. This week closing will mark the further confirmation. Time to build the position
PSX | Bullish Trend🚀 Stock Alert: PSX
Pakistan Stock Exchange Limited
📈 Investment View: Technically Bullish 📈
🔍 Quick Info:
📈 Buying Level: 28.00
🎯 First Target: 30.50
🎯 Second Target: 33.25
🎯 Third Target: 36.00
⚠ Stop Loss: 25.33
⏳ Nature of Trade: Mid Term Trade Setup
📉 Risk & Reward Ratio: 1 : 3
☪ Shariah Compliant: NO
💰 Dividend Paying: NO

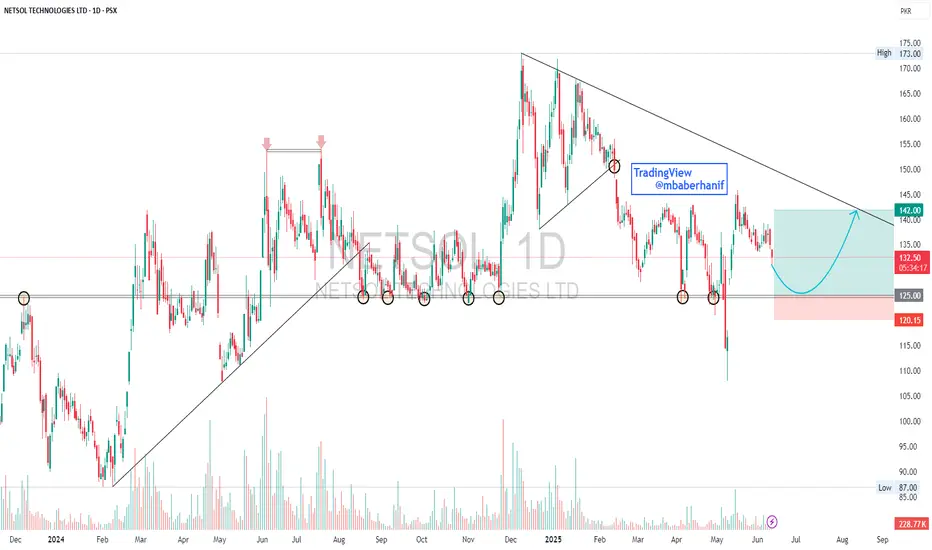
NETSOL | Swing Trade SetupTrading Note: NETSOL Technologies Ltd. (NETSOL) - Long Position Recommendation
Date: June 13, 2025
Subject: Potential Long Opportunity from Major Support Level
Overview:
This note recommends considering a long position on NETSOL from its significant major support level around 125. Recent price action suggests a compelling opportunity for a bounce from this historically pivotal zone.
Analysis of the 125 Support Level:
The price level of 125 stands out as a critical major support for NETSOL. This level has consistently acted as a strong demand zone, where buying interest has historically emerged to halt downward momentum and initiate price reversals. Looking at past performance, the price has made several notable pullbacks from this area. Each time NETSOL has approached 125, leading to a rebound in price. This repeated rejection of lower prices at 125 underscores its importance as a robust psychological and technical barrier, indicating strong underlying demand. The recent sharp drop and subsequent bounce reinforce the continued relevance of this level.
Recommendation:
Based on the strong historical significance and recent price action, a long position is recommended from the major support level around 125. Traders should consider entry points near this level, potentially with a stop-loss placed just below the immediate lower support marked by the red zone on the chart (around 120) to manage risk.
Target:
Initial targets could be set towards the previously established resistance around the 142 range, aligning with the potential for a rebound towards the upper boundary of the indicated channel.
Disclaimer: This analysis is for informational purposes only and should not be considered financial advice. Always conduct your own due diligence and consult with a qualified financial advisor before making any investment decisions.
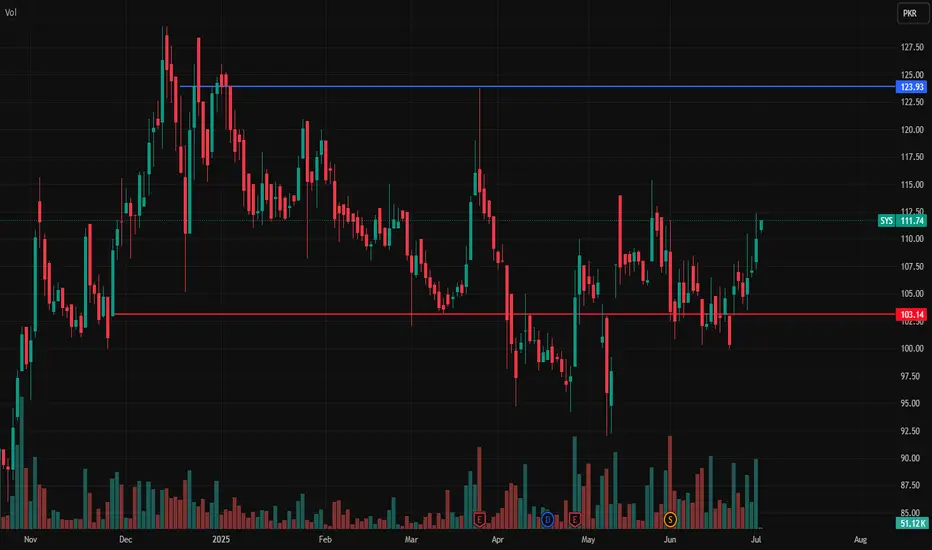
Sys key levelsSys is in bullish trend and buying is possible with blue lines TP and red line SL
Note: This is not a buy/sell trade call.
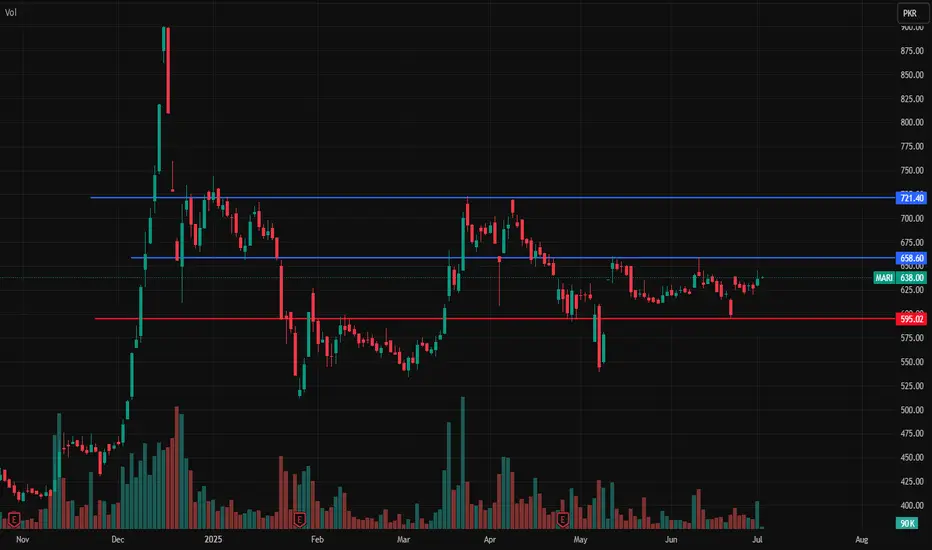
Mari Key levelsMari is in bullish trend and buying is possible with blue lines TP and red line SL
Note: This is not a buy/sell trade call.
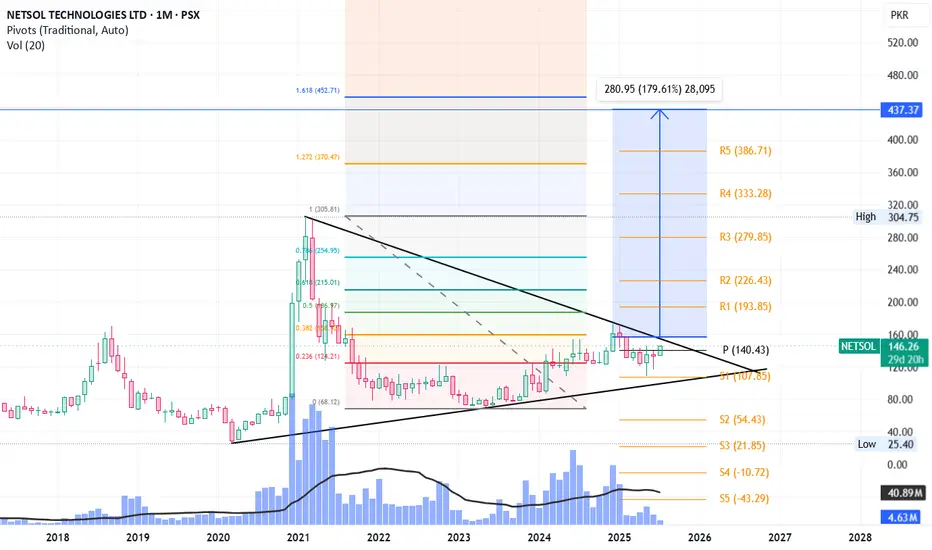
NETSOL Long term targetsLong term targets for NETSOL once it breaks out the triangle are listed in chart. You can take it either as Fib 1.618 or the price arrow top as your targets.
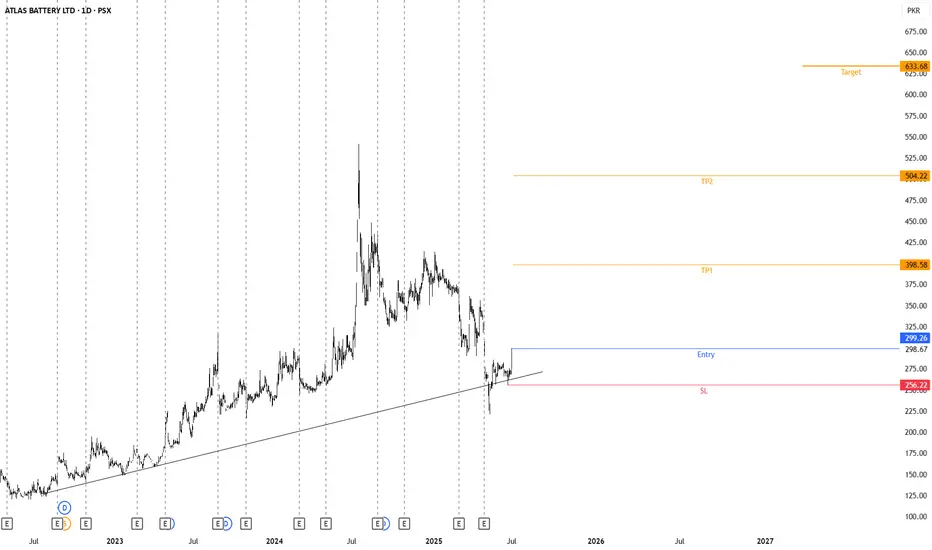
ATBA is ready for long term investmentATBA is ready for long-term investment.
After completing its retracement, it has given a strong breakout.
A very high target can be achieved.
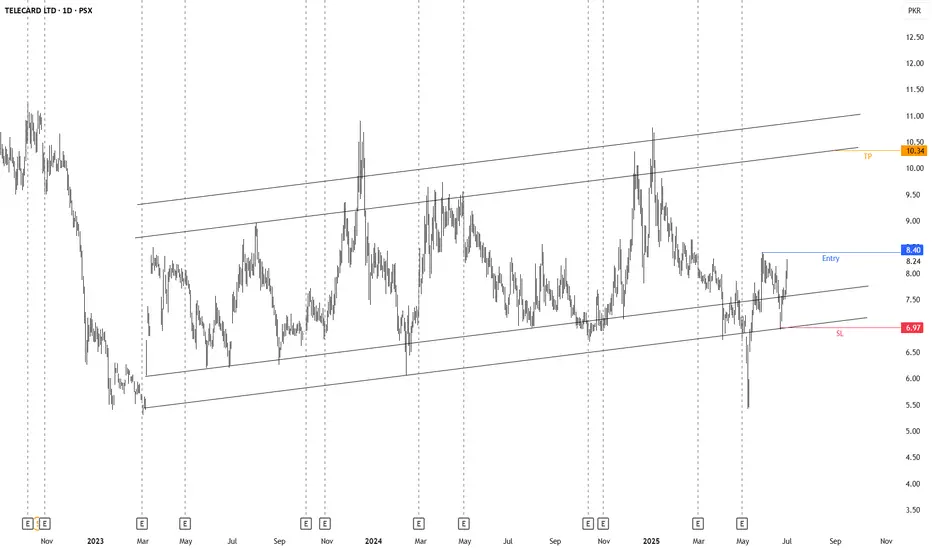
TELE is in bullish channelTELE is in a bullish channel, a long position may be taken at specified entry price.
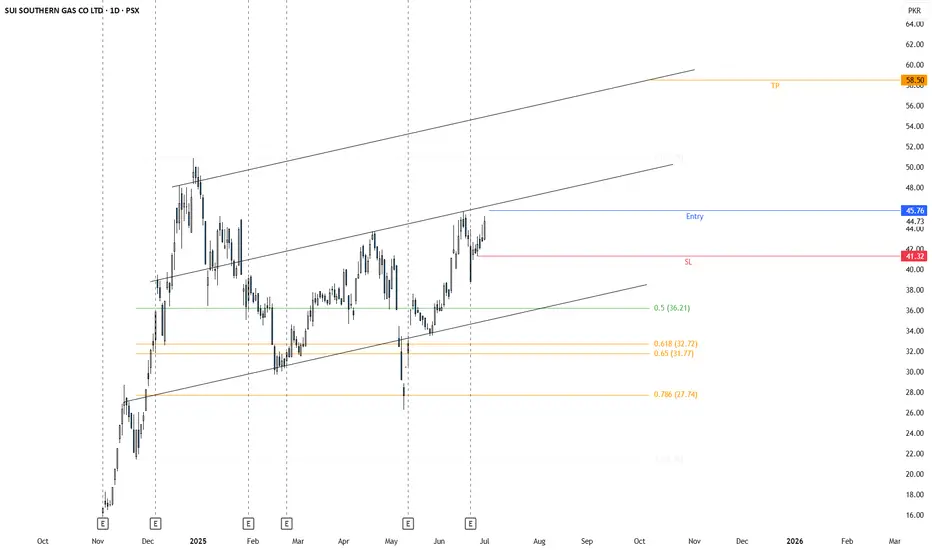
SSGC has completed its retracementSSGC has completed its retracement, and now moving in a bullish channel
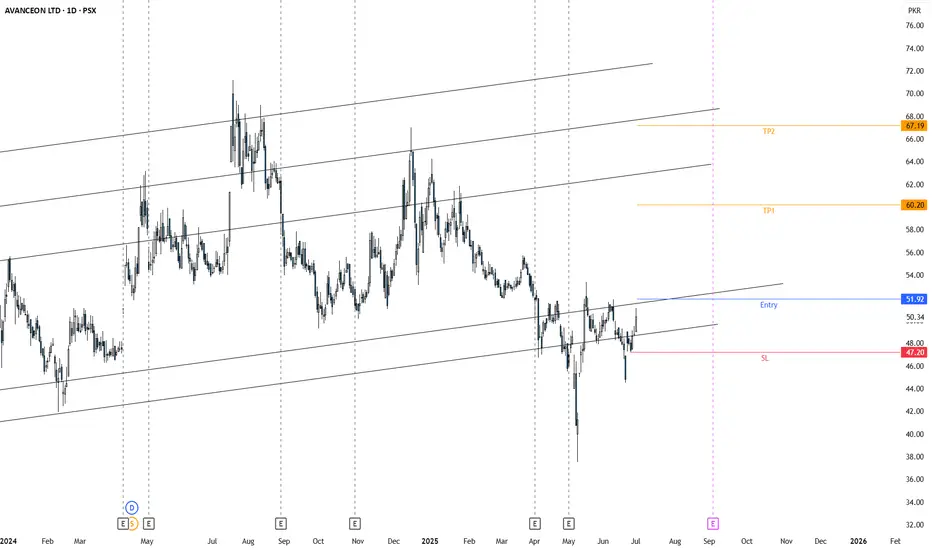
AVN has completed its retracementAVN has completed its retracement, and taking support from its trendline
SYS has completed its retracementSYS has completed its retracement and is taking support from its trendline.
A bullish movement can be observed
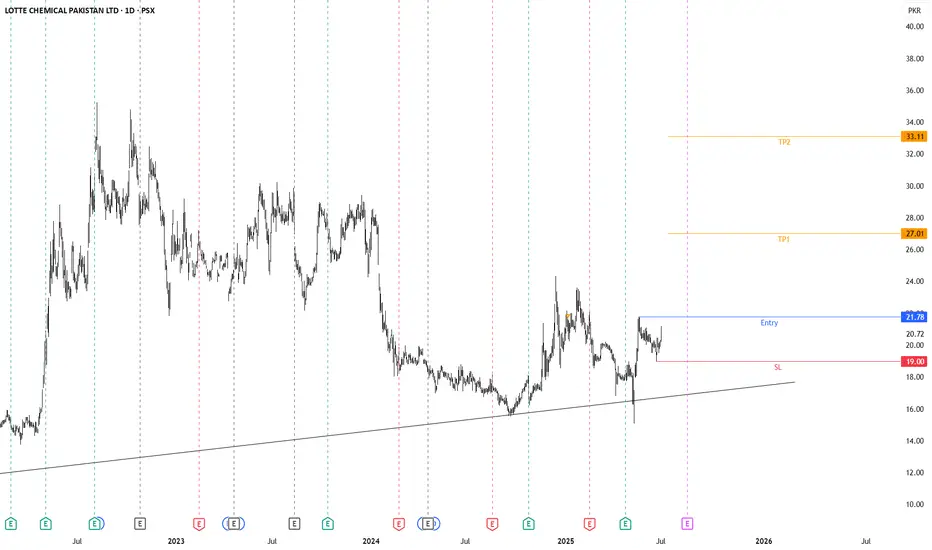
LOTCHEM is bullishLOTCHEM has completed its retracement and already formed HL, now it's moving to form new High.
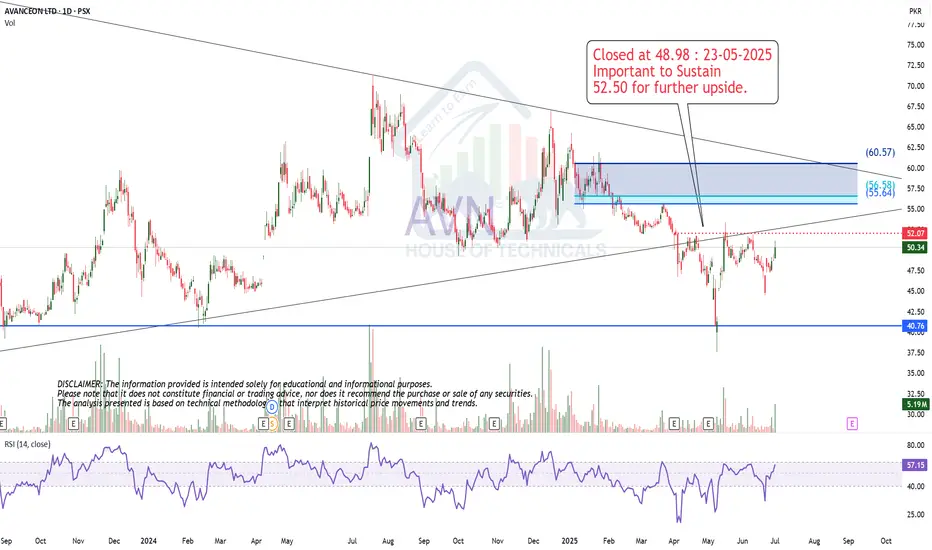
Let it Sustain 52 - 52.50Closed at 48.98 : 23-05-2025
Important to Sustain
52.50 for further upside.
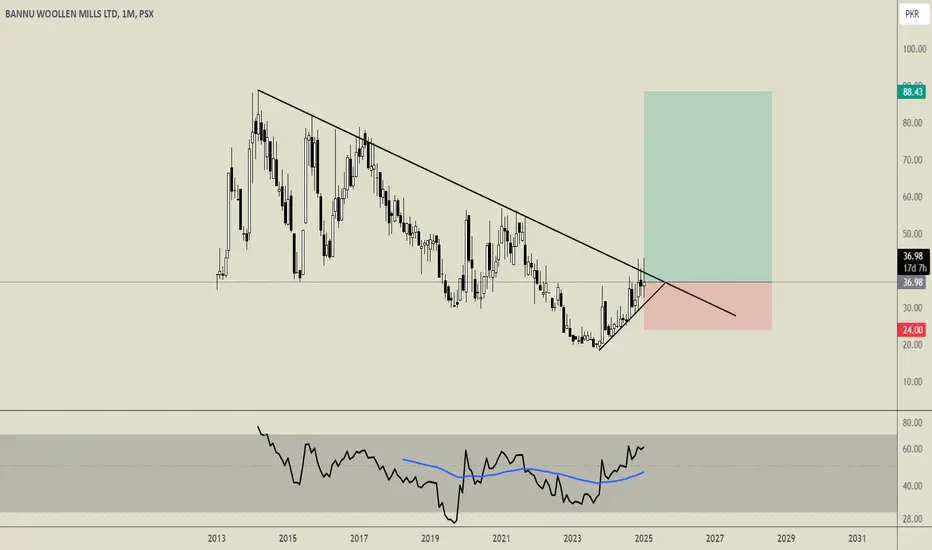
LONG BNWMLonged BNWM. Bought spot shares. Entry, Stop Loss and Exit all there. Worth a punt!
Will update in due time.
Manage your risk! #DYOR
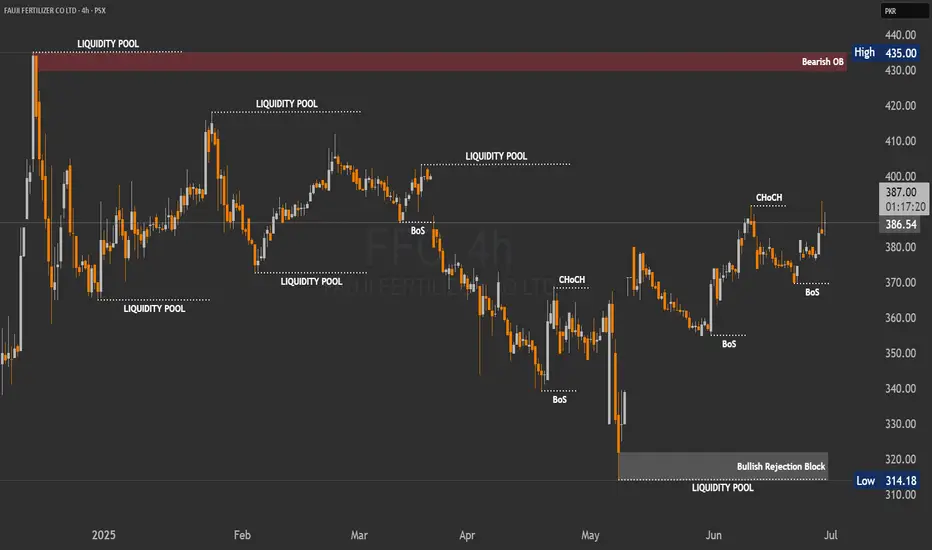
FFC | Ready for More Upside Before Another Fall?By analyzing the FFC chart on the 4-hour timeframe, we can see that price initially followed our bullish scenario, climbing 23 rupees up to 393. However, after hitting that level, price reversed and currently trading around 389 and eventually finding support around 376.
This area acted as a strong demand zone. Currently, FFC is trading around 389, and as long as price holds above the marked demand zone, we may expect another bullish move towards 390 and 400.