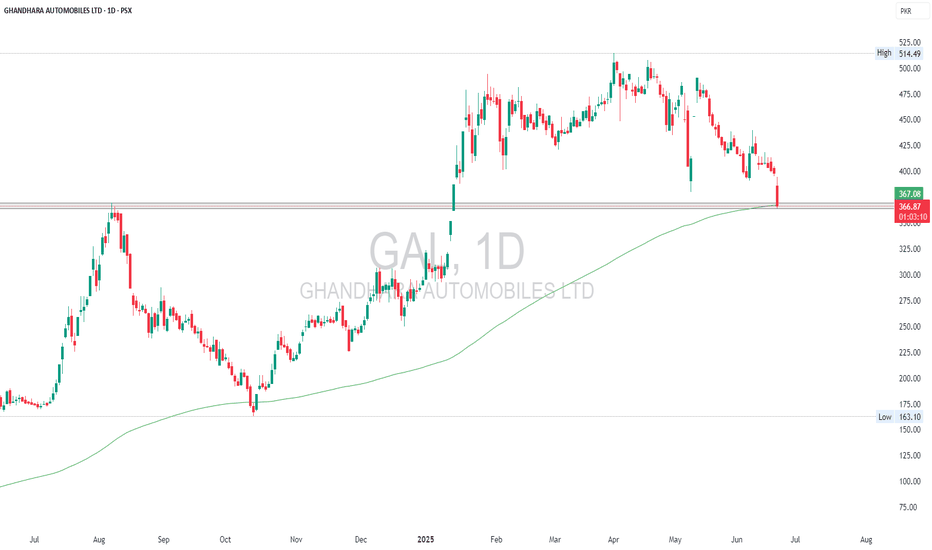
GAL | Confluence of Support & ResistanceGAL is currently testing a critical support zone near 366, which aligns closely with the 200-day EMA (367). The stock has seen a sharp drop with increased volume, suggesting strong selling pressure. However, this area also coincides with previous resistance-turned-support, making it a potential bounce zone. Holding above this level could lead to a reversal, but a breakdown below may trigger further downside.
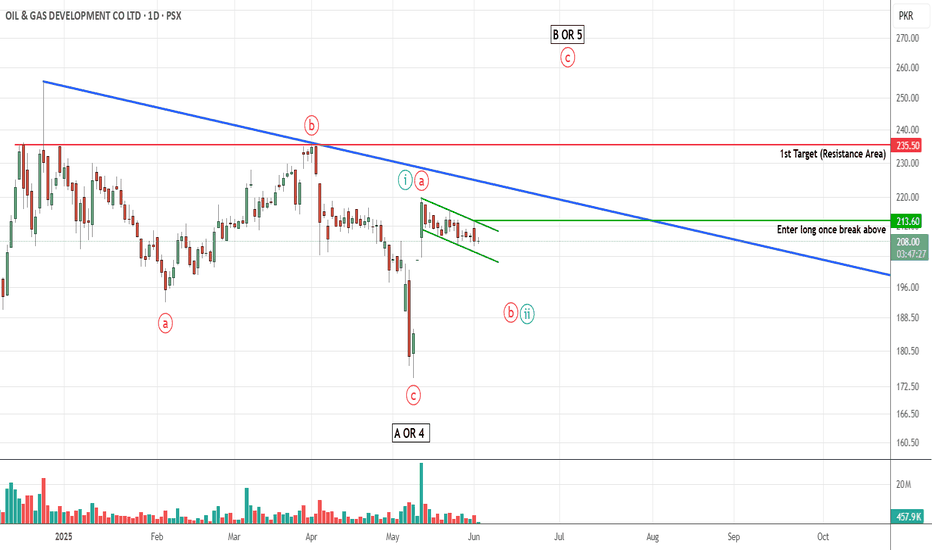
OGDC PROBABLY IN WAVE ' B ' OR ' 5 ' - LONGOGDC is most probably in wave B or 5
Currently the price is forming a flag pattern as minor wave b or 2 which might continue to build this week. As per our preferred wave count we are only looking to buy OGDC once it breaks above the flag formation.
Last minor swing high is at 213.50 at the moment therefore we will enter at 213.60, however as the pattern might continue to build it can make new swing low and high therefore if the flag pattern stays intact then we will use the next minor swing high for entry accordingly.
Currently we are targeting 235 area, however if the pattern continues to build we will modify the target as well.
Alternately, if the prices go down and breaks the flag pattern this trade setup will get invalid
Let see how this plays, Good Luck!
Disclaimer: The information presented in this wave analysis is intended solely for educational and informational purposes. It does not constitute financial or trading advice, nor should it be interpreted as a recommendation to buy or sell any securities.
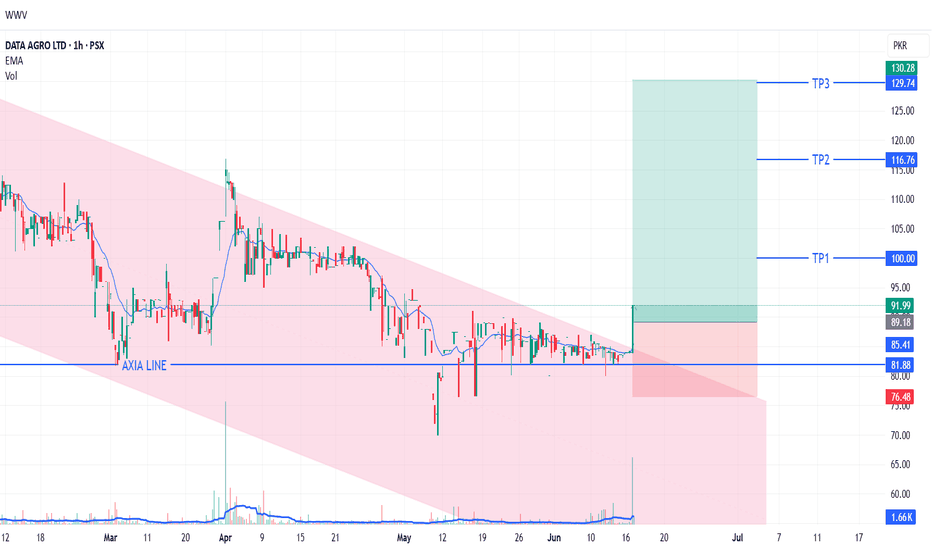
DAAG LONG TRADE 16-06-2025DAAG Long Trade
Rationale : DAAG has been in a bearish channel (bull flag) since Dec 2024. Recently, the stock trended at the upper level of the channel, absorbing overhead supply. Today, it broke out of the channel with a huge volume metric imbalance and gradient, taking price above the axis line.
🚨 TECHNICAL BUY CALL – DAAG🚨
- Buy 1: Current level (Rs. 92)
- Buy 2: Rs. 86.5
- Buy 3: Rs. 82.2
Target Prices
- TP 1: Rs. 100
- TP 2: Rs. 116.8
- TP 3: Rs. 129.8
Stop Loss - Below Rs. 76 closing basis
Risk-Reward Ratio1:- 3.25
Caution: Close at least 50% position size at TP1 and then trail SL to avoid losing incurred profits in case of unforeseen market conditions.
PLEASE BOOST AND SHARE THE IDEA IF YOU FIND IT HELPFUL.
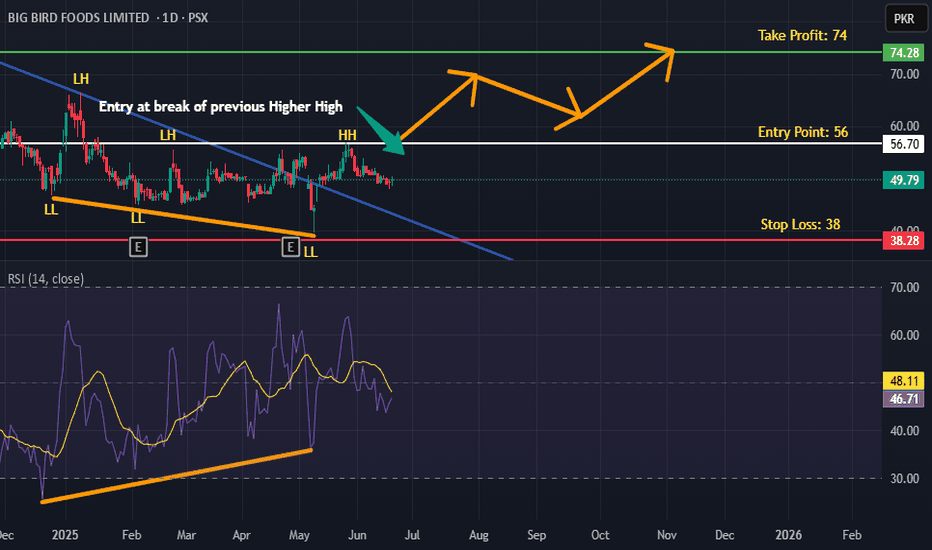
BBFL is BullishPrice was in a strong downtrend, however an extended bullish divergence, breakout from descending trendline, printing of hammer candle and a higher high all hint at the return of bulls for the price action. If freshly printed higher high is broken with good volume then we can expect a good bullish reversal as per Dow theory. Targets are mentioned on the chart.
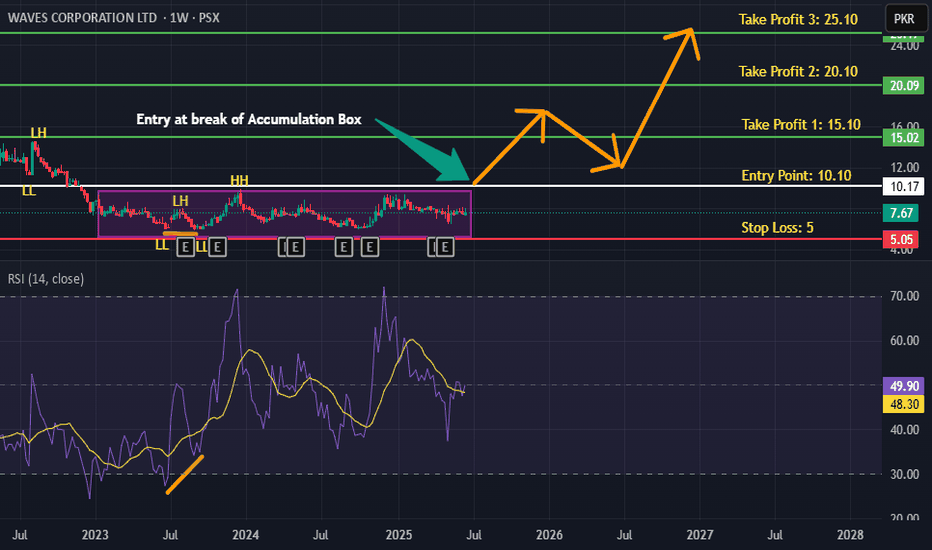
WAVES is BullishPrice has been in an accumulation box for over two years now, and a breakout seems to be on the horizon. Bullish sentiment is further validated by the bullish RSI divergence. When the price breaks previous higher high than we can expect a strong bullish move as per Dow theory. Targets are mentioned on the chart.
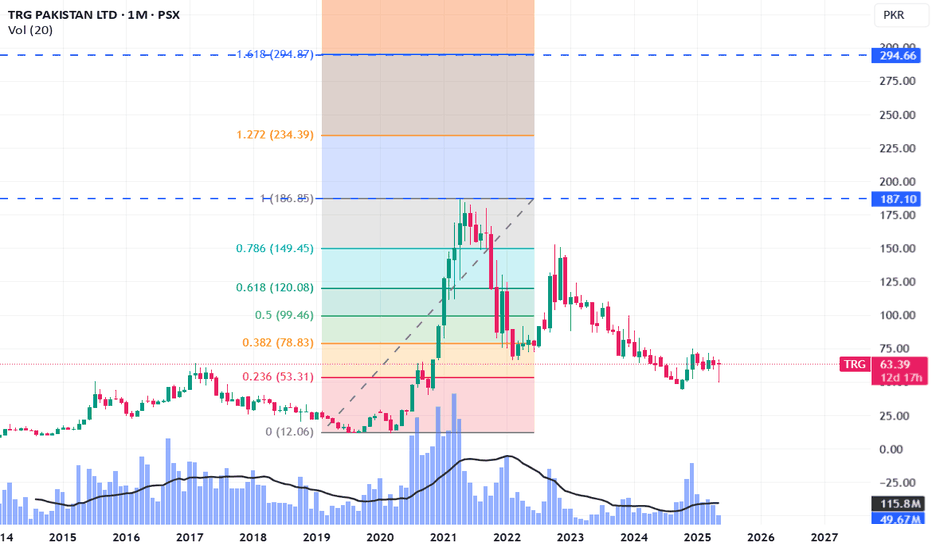
TRG LongTRG has made a perfect bullish harmonic pattern where it has retraced to exact 127.2% of its last top and now will move till 161.8% of its all-time high which is nearly 295. This is not a buy/sell call, its just my own analysis and you may disagree. However, I'd urge you to study bullish and bearish harmonic patterns which are not so common in Pakistani market but some international players often run a stock through this pattern. Similar patterns can be noticed in GHNI and GAL as well.
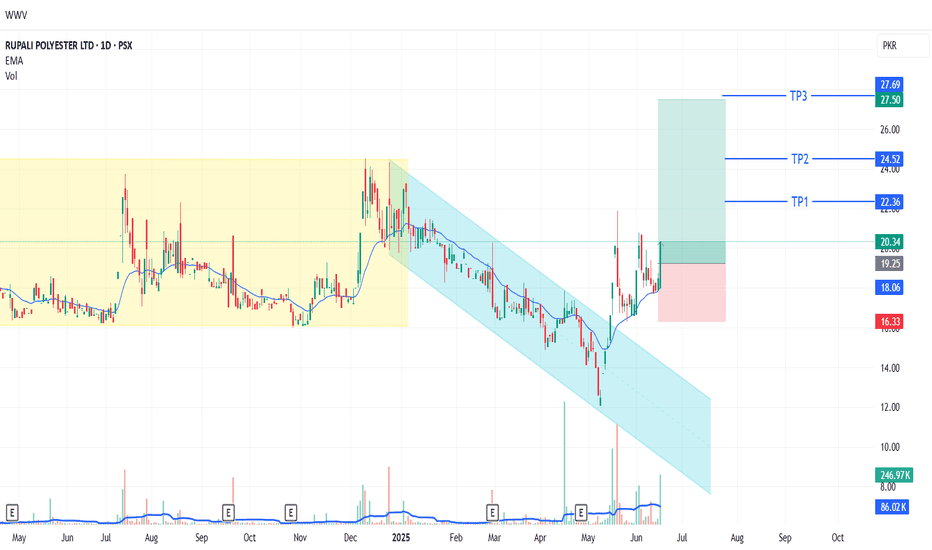
RUPL LONG TRADE 18-06-2025 (Synthetic & Ryon Sector)RUPL LONG TRADE
After hitting a low of 16.70, RUPL consolidated within a trading range (16.00 - 24.55) marked by a yellow channel. A breakdown followed, forming a bearish channel (light blue), which is essentially a bull flag. Recently, the stock broke out of this channel with a spike, signaling an upward move. After a pullback, RUPL formed bullish measuring gaps and a bullish IFDZ, indicating a safe entry point.
🚨 TECHNICAL BUY CALL – RUPL🚨
1. BUY1: 20.34 (Current Price)
2. BUY2: 18.9
3. BUY3: 17.8
TP1: 22.3
TP2: 24.5
TP3: 27.7
Stop Loss: Below 16.3 on closing basis
Risk-Reward Ratio: 2.83
Caution: Please buy in 3 parts in buying range. Close at least 50% position size at TP1 and then trail SL to avoid losing incurred profits in case of unforeseen market conditions.
PLEASE BOOST AND SHARE THE IDEA IF YOU FIND IT HELPFUL.
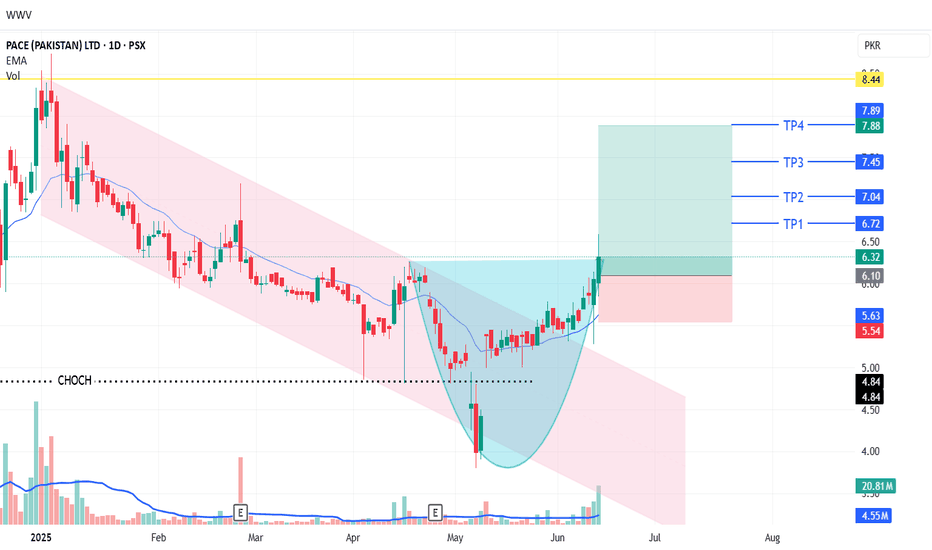
PACE LONG TRADE 16-06-2025PACE LONG TRADE
Rationale
PACE recently completed an ABC correction within a bearish channel, which acted as a bull flag. The stock broke out of this channel with significantly high volumes (5x) and strong follow-through, indicating potential upside.
🚨 TECHNICAL BUY CALL – PACE🚨
- Buy 1: Current level (Rs. 6.32)
- Buy 2: Rs. 5.9
- Buy 3: Rs. 5.7
- TP 1: Rs. 6.7
- TP 2: Rs. 7.0
- TP 3: Rs. 7.4
- TP 4: Rs. 7.8
Stop Loss - Below Rs. 5.5 closing basis
Risk-Reward Ratio- 1:3.2
Caution: Close at least 50% position size at TP1 and then trail SL to avoid losing incurred profits in case of unforeseen market conditions.
PLEASE BOOST AND SHARE THE IDEA IF YOU FIND IT HELPFUL.
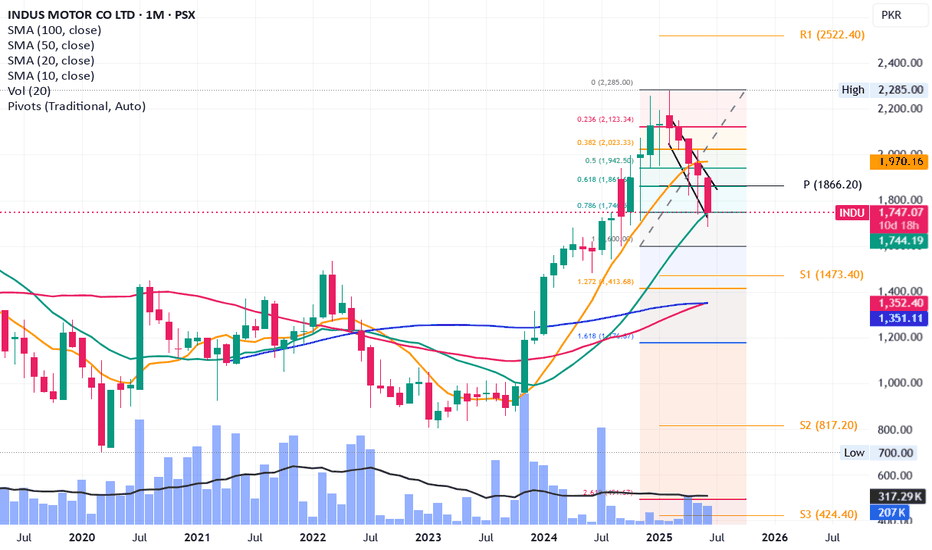
INDU - Long trade - Stop loss hunted by smart playerINDUS Motors stoploss hunted by some very very smart player yesterday :)
Brought down to 1685 level and then brought it up to just over its Fib 0.786 level.
It is taking support from its SMA20 level and a golden cross is about to happen next month.
This is the best time to hold onto it (my personal opinion, not a buy / sell call).
It requires patience though. This stock is not for impatient. As per my last analysis of INDU, its targets are minimum 3200 to 3500 (May go further upwards).
Moreover, it is a very good dividend stock. Ideal for long term investment.
Liquidity sweep can also be observed in last two days ;)
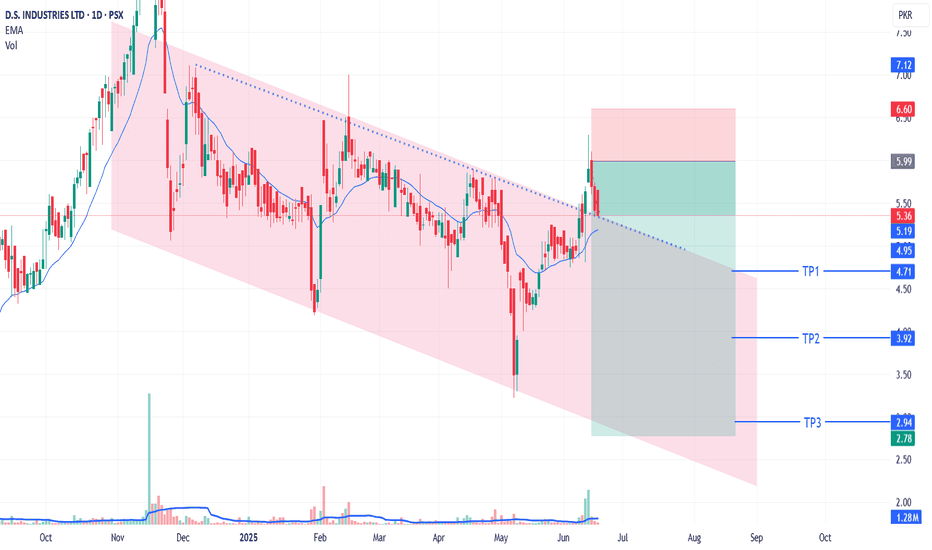
DSIL FLIP TRADE (SHORT-SELL / EXIT TRADE) 19-06-2025DSIL Short Sell Flip Trade/Exit Call:
DSIL previously broke out of a downward channel but failed to sustain upside momentum, reversing after hitting a supply zone. We're flipping our position to capitalize on the downward move.
*Short Sell Levels:*
- *Short Sell 1:* PKR 5.36 (current price)
- *Short Sell 2:* PKR 5.7
- *Short Sell 3:* PKR 5.99
*Target Prices:*
- *TP1:* PKR 4.71
- *TP2:* PKR 3.92
- *TP3:* PKR 2.94
*Stop Loss:* Above PKR 6.62
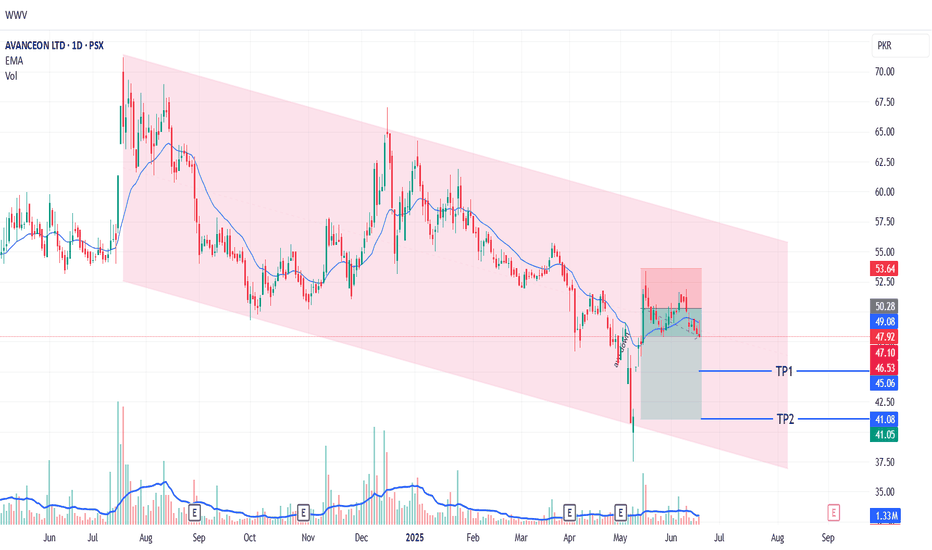
AVN SHORT-SELL/EXIT TRADE 19-05-2025AVN Short Sell Setup/Exit Call:
AVN is in a continuous downtrend, having previously changed character to bearish. Multiple supply zones and flipped supply zones indicate potential for further downside. Supported by strong selling volumes.
*Short Sell Levels:*
- *Short Sell 1:* PKR 47.8 (current level)
- *Short Sell 2:* PKR 49.1
- *Short Sell 3:* PKR 51
*Target Prices:*
- *TP1:* PKR 45.1
- *TP2:* PKR 41.1
*Stop Loss:* Above PKR 53.7
*Risk-Reward Ratio:* 2.8
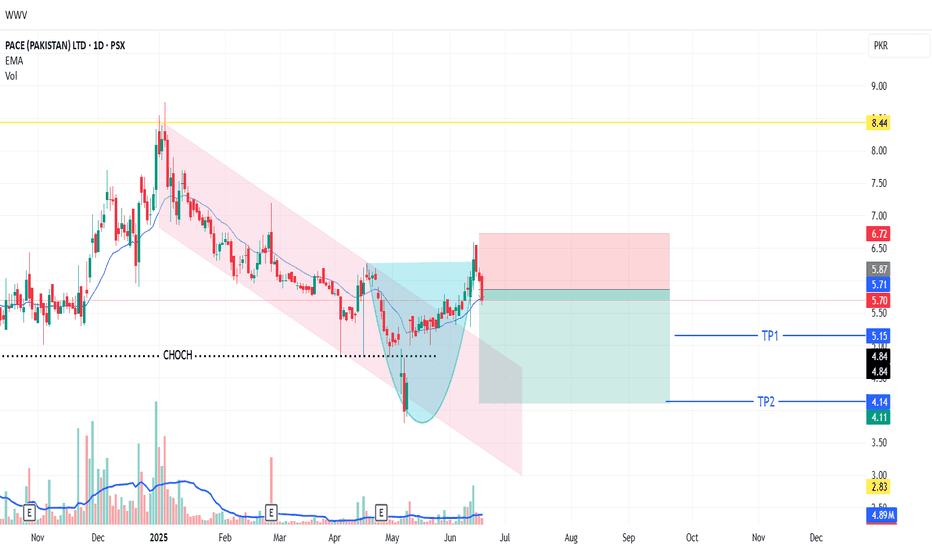
PACE SHORT SELL TRADE 19-03-2025 (FLIP TRADE SET-UP)PACE Flip Trading Setup (Short Sale):
After breaking out from a downward channel, PACE created an upthrust and retraced back, indicating potential for a downward move. We're flipping our position to capitalize on this reversal.
*Short Sale Levels:*
- *Short Sale 1:* PKR 5.7 (current level)
- *Short Sale 2:* PKR 5.9
- *Short Sale 3:* PKR 6.3
*Target Prices:*
- *TP1:* PKR 5.15
- *TP2:* PKR 4.15
*Stop Loss:* Above PKR 6.70
*Risk-Reward Ratio:* 2
