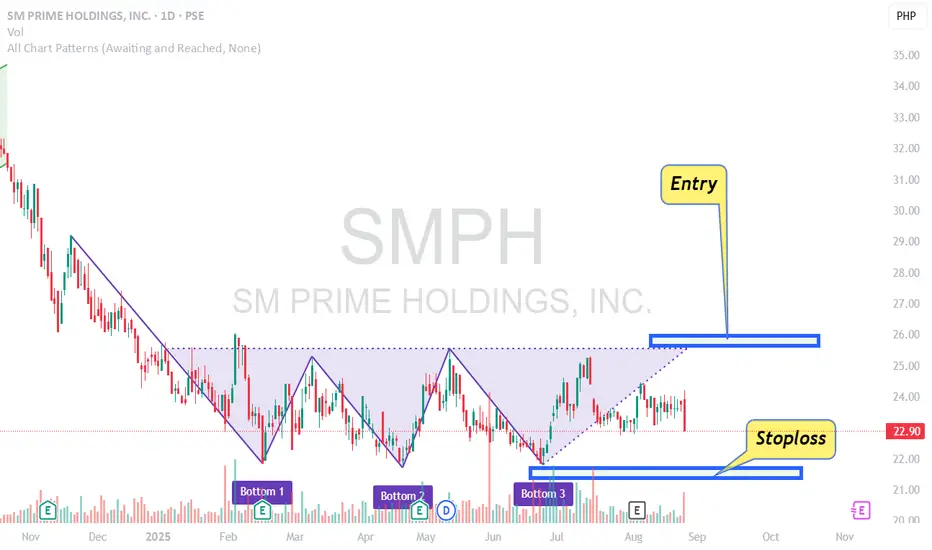
SMPH Chart Analysis Aug 26, 2025First off, SMPH is a bluechip stock in PSE.
The price of SMPH made a triple bottom chart pattern. Triple bottom is a bullish reversal pattern. The entry is on the break of the neckline. You put a stoploss below the right (3rd) shoulder after entry.
Triple bottom chart pattern is a "prove me your strong by breaking out" type of pattern. Most traders confuse triple bottom as a pattern to buy near the bottom. You do not buy near the bottom on this type of pattern. You buy on breakouts. Any chart pattern can either succeed or fail. Near bottom buying is a step closer to the chart pattern failing so avoid that. Calm yourself down and wait for the breakout.
BER months is coming and that might trigger some movement on this stock.
Goodluck on your trades. Trade well.
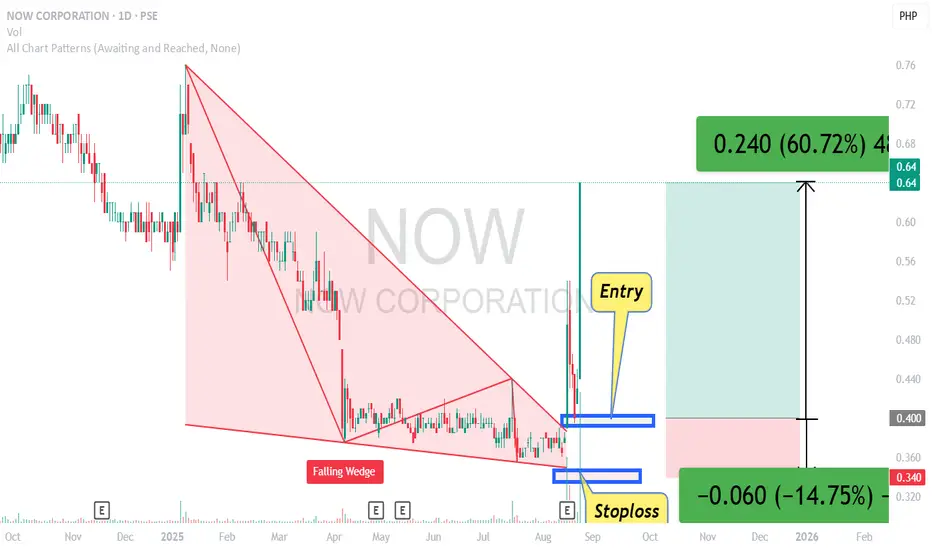
NOW Bullish Reversal/Bounce Trade Using Chart PatternA falling wedge pattern which is a bullish reversal pattern showed up in NOW's price movements on a daily timeframe.
There is a more or less 15 percent risk from entry to stoploss.
This trade made around 60 percent profit currently.
Your exit is either a bearish reversal pattern or you can just trail your profits using some moving average that is moving closer to the price.
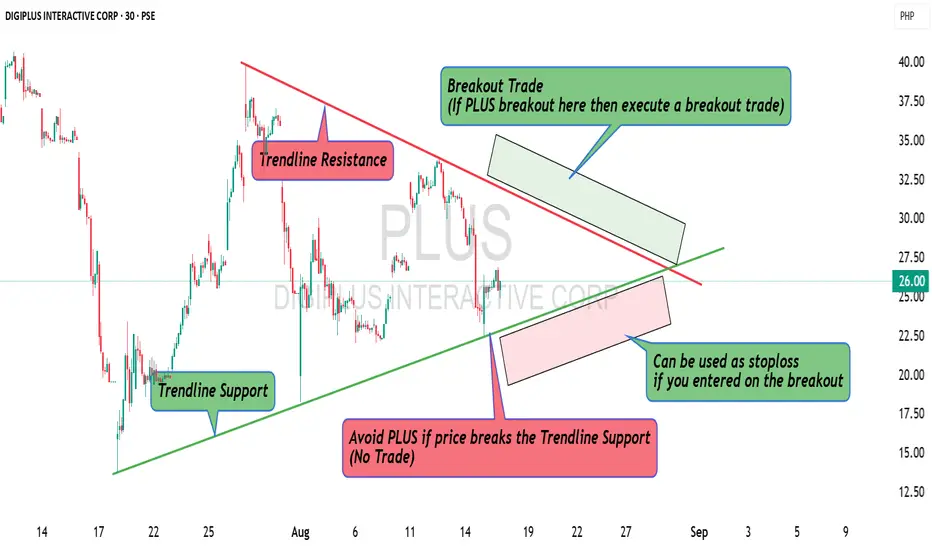
PLUS TRENDLINE TRADE IDEA Aug 18, 2025There is a trendline resistance and trendline support on 30-minute timeframe.
If the price breaks the trendline resistance then you may execute a buy (Long) trade. You put your stoploss below the trendline support.
If the price breaks the trendline support instead of breaking the trendline resistance then you avoid PLUS.
Either the price goes up or it goes down. Do not predict. Just react whatever movement the price does.
Hope this helps. Trade well.
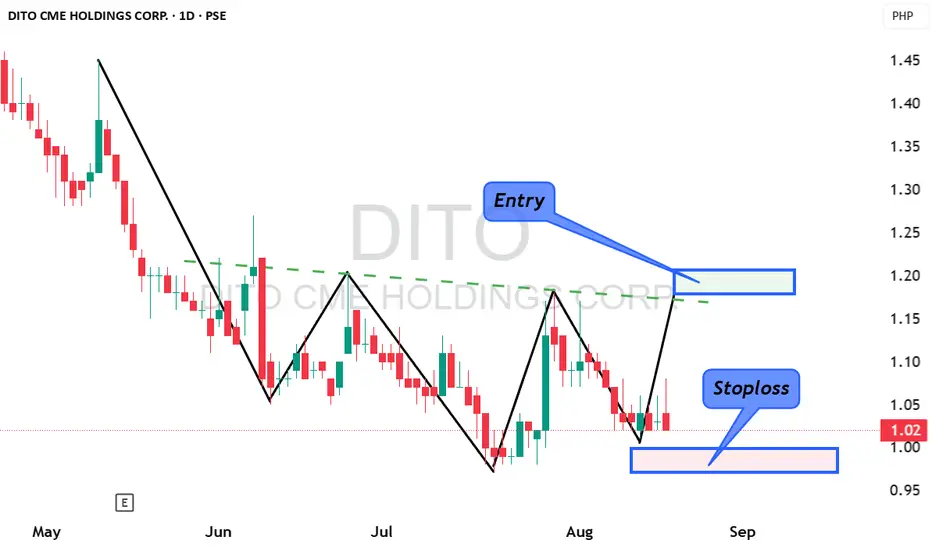
DITO Inverted H&S Trade Idea Aug 18, 2025DITO is trying to create an inverted head and shoulders pattern.
There is a lot to unpack here so let me go through it one by one.
The first is the inverted head and shoulders pattern. The price needs to go to a downtrend for it to be able to create an inverted head and shoulders pattern. This pattern shows up at the end of a downtrend that is why it is being considered as a bullish reversal pattern. The downtrend is for the creation of the first shoulder. It needs to come from a higher price sliding down.
Contrary to what others think, there is no perfect head ans houlders or inverted head and shoulders pattern. Its not about the pattern being perfect. Its all about what the pattern shows you. There should be a downtrend then the price bottoms. It stops going down. It starts going up again from that first bottom then it will hit some form of resistance that it cannot break. It will slide down again. The second slide is deeper. It will find its bottom but that bottom is lower than the first bottom. It will again start to go up. It will hit some form of resistance again, It will go down for the third time. The third slide down is not as deep as the second slide hinting at some form of buying pressure that is present. After the third slide, it will go up again and it will finally break that "unbreakable" resistance level which we call "the neckline."
When the neckline is broken then and only then is the time you make an entry. Your stoploss should be placed below the last bottom or what we call the "right shoulder."
In fairness to DITO, there is still some room for the price to go down before it starts to go up and break that neckline (If this is indeed a successful inverted head and shoulders pattern).
The price to watch is 1.20 pesos. If the price breaks 1.2 pesos then you enter. Put a stoploss at 0.99 pesos upon entry.
Neckline break is the only thing that matters to an inverted head and shoulders. Wait for it to happen before any entry. Do not try and enter early. Be patient. Lets see what happens to this tarde.
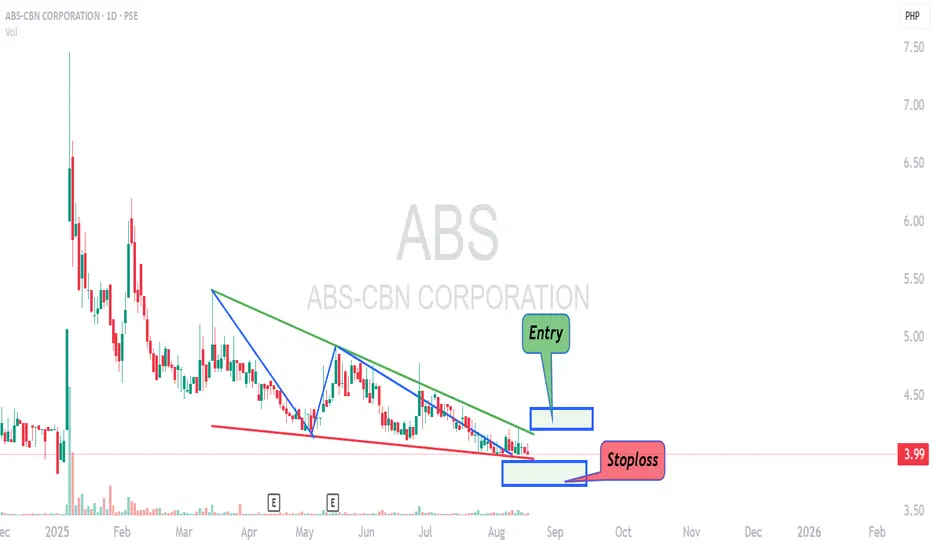
ABS Reversal Trade And Analysis Aug 16, 2025A Falling Wedge pattern showed up on ABS chart. It is a tradeable bullish reversal pattern. A falling wedge pattern is all about trendline resistance and trendline support. ABS price has been going up and down creating this narrowing range. If it breaks the trendline resistance then you have a bullish breakout. If it breaks the trendline support then you have a bearish breakout. Bearish breakout or what we call "breakdown" is useless right now in PSE market since there is no shorting available to retail traders yet as of writing this analysis.
This trade is very simple. There is a trendline resistance at 4.2 pesos. If the price breaks it or if the price goes up to 4.21 or higher then you can enter. You are entering on a breakout of the upper line of the Falling Wedge pattern. Upon entry, you set your stoploss at 3.94 pesos. That is the price below the lower line of the pattern. That gives you an exit if the price ever breaks the lower line.
Lets talk about risk. How much risk are you taking on this trade? Well, to do that, you measure from 4.21 pesos down to 3.94 pesos. That is over 6 percent. If you take this trade then you are looking at a potential 6 percent loss. The risk will vary depending on what price you have entered.
This is a bullish reversal trade. I gave you an entry price and a cutloss price. Your exit with gain will come from a different chart pattern. A bearish reversal one.
Thank you. Goodluck on your trade. May you trade well.
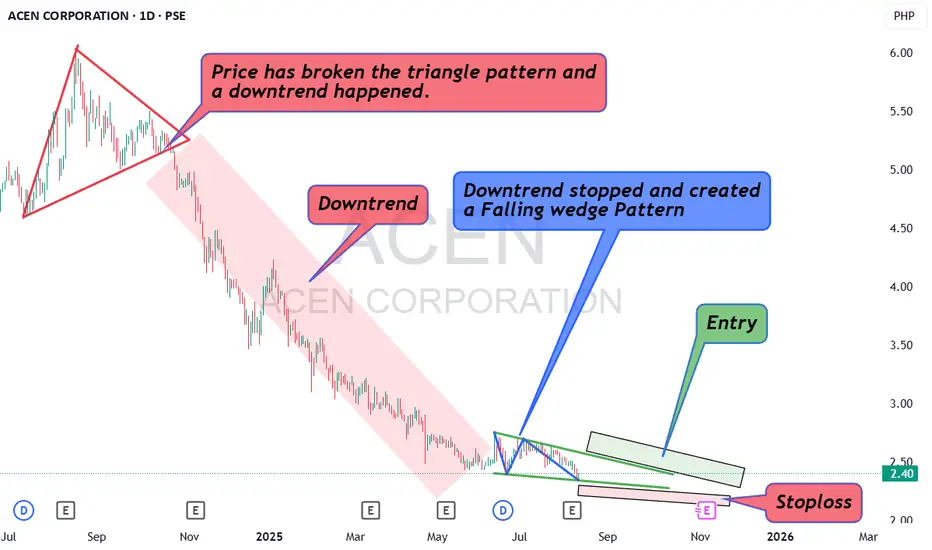
ACEN Trading Idea Aug 10 2025ACEN made a triangle chart pattern. A triangle chart pattern can be bullish or bearish depending which direction the breaks happen. In CAEN's case, it has broken the support side of the triangle. It is a bearish break. After that break, ACEN's price made a downtrend from October 2024 to June 2025. Almost 8 months of its price just slowly sliding down.
The downtrend took a pause around June. You can clearly see that some form of range and sideways movement took place after that long downtrend. A pause on an uptrend is just a pause unless some form of reversal pattern appears. A pause in a downtrend is just a pause unless some form of reversal pattern appears. The pause itself is insignificant for it can either be a lack of interest from buyers/sellers or a little exhaustion from the previous trend. The reversal pattern that the price creates after a downtrend or an uptrend matters.
In ACEN's case, after a long downtrend, the price created a FALLING WEDGE pattern. Falling Wedge pattern is a bullish reversal pattern. This pattern does not magically appear from heaven. Haha! It was created by the price when the price moved up and down creating a trendline support and resistance.
Think of it this way. ACEN's price went 5.16 pesos to 2.42 pesos on a steady downtrend. From 2.42 it went up to 2.75. From 2.75 it went down to 2.39. From 2.39 it went up again to 2.63. From 2.63 it went down again to 2.36. It is moving up and down creating a narrow range. The range gets closer and closer. This happened from June to Aug. It went from an 8-month downtrend and suddenly it kept moving up and down on a narrow range in a matter of two months. Its a clear change of behavior to the price movement.
That is basically what this "reversal pattern" is trying to show you. There is no magic involved. Its a change on the price behavior/movement.
Lets talk about The Falling Wedge. Its basically a trendline resistance and trendline support. Your entry is on the breakout of the trendline resistance or the upper line of the falling wedge. You put a stoploss below the trendline support or the lower line of the falling wedge after your entry.
Currently, you enter if it breaks 2.60 pesos with a stoploss on 2.33 pesos. This is a Falling wedge pattern. Take note of the word "falling" which means the movement is dynamic. If it does not break 2.60 pesos then you will have other price to enter on depending which part of its trendline resistance is broken.
If you plan to trade this stock then you must measure from your entry price down to your stoploss price. That is basically your risk. That is the percentage you are risking in trading this pattern. If it breaks 2.60 pesos and you have your stoploss at 2.33 then you are risking a 10 percent loss.
No entries should be made unless the price breaks the upper line/ trendline resistance.
As the price keep moving on a narrow range, the risk will keep getting smaller and smaller. Put this stock on your watchlist. Observe what happens to it. I hope this analysis helps you. May you trade well.
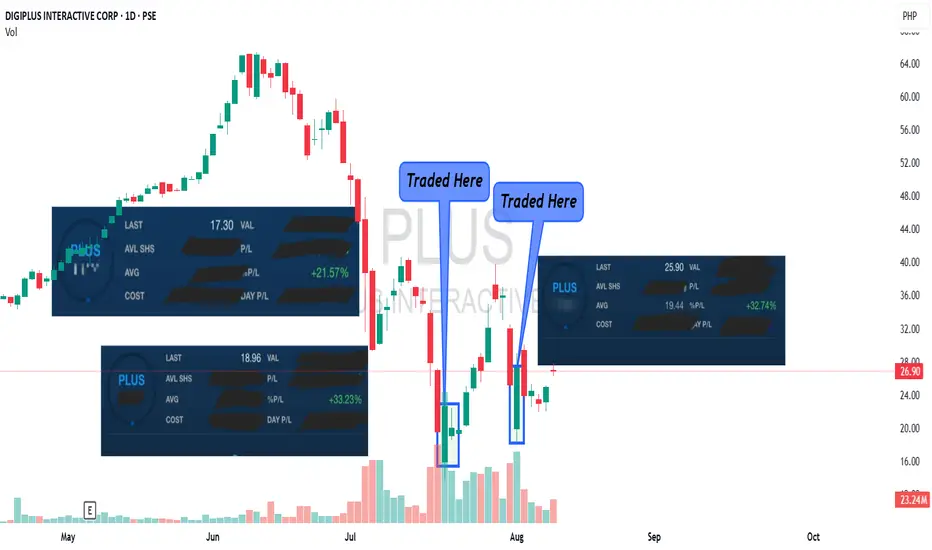
Momentum Trade On PLUS (The Why And The How)I managed to trade PLUS twice due to its Momentum.
Let me share an insight on how I did it and why.
My first trade was on July 18. PLUS has been on a downtrend for almost two weeks prior to that. From 65 pesos (1.15 usd) down to 19 pesos (0.33 usd). There was a steady decline in its price when it was on a downtrend. There was no volatility. The price was just steadily decreasing. Sellers just overwhelmed buyers. There was just to much selling pressure. July 18 came and there was volatility on that day. The price did not just steadily decrease. It went up and down. It went down to 15 pesos at open then pushed back up to 20 pesos then down again to 16 pesos then up again. There was momentum. At the first hour of the market opening, PLUS set a range. The bottom was 15 and the top was 22. As soon as the range was established, I bought near the bottom. I sold near the top for the price was still going up and down. I closed my computer and called it a day that time.
For a few days, PLUS was on a steady climb. Buyers kept overwhelming sellers. The buying pressure was there. The price climb was steady. There was no volatility. There was no momentum. I stayed away from PLUS.
On the 1st of AUG, the price of PLUS went volatile again. It went up and down. It made a range of 28 pesos as top and 18 pesos as the bottom. It went up hard then it went down hard. On and on and on. There was volatility. There was momentum. I bought near the bottom of the range again and sold it above 25 pesos.
I made two very successful trade on PLUS.
I gave you and idea on how I traded it and why. Philippine market is illiquid. There is no liquidity. You seldom see volatility and momentum on a Philippine stock. Its so illiquid that when one stock managed to have momentum then almost everyone takes notice. Everyone joins in. That makes the stock price even more volatile. Everyone is hungry for that scalping or day trade.
When I talk about momentum and volatility, most traders misunderstood it as "explosive" or high volume. Momentum and volatility is the rate of the price change. It has very little to do with volume. There are volume-less volatility and volume-less momentum. Think about a stock going from 1 dollar to 10 dollars in a year. That steady rise in price is called an uptrend. Its steady. It takes a lot of days. Its takes a lot of candles. Now, think about a stock that goes from 1 dollar to 10 dollars in one day. That is momentum.
Trend is a direction. Momentum is a rate of price change.
If you want to follow a trend then you use trend-following tools like moving averages,Williams Alligator, etc.
When you are looking for momentum then you use tools like bollinger band, RSI, etc. These are tools that will not tell you which direction the price is going yet it tells you that there is an unusually high momentum going on.
Volume is a product of volatility and momentum. The more traders get in, the more volatile the price swings become then the more volume is registered. It is not a predictor of which price will have momentum. The same way that the volume is not a predictor of which price will have a successful breakout and which price will have a failed breakout. There are volume-less
successful breakouts and there are high-volume failed breakouts.
I hope you learn a little on my post. I will try to post more here.
I apologize if my post do not have that proper structure yet. I seem to be jumping from one idea to the next. I'm just typing as i recall the trade. I will try to post better on my next posts.
Thank you.
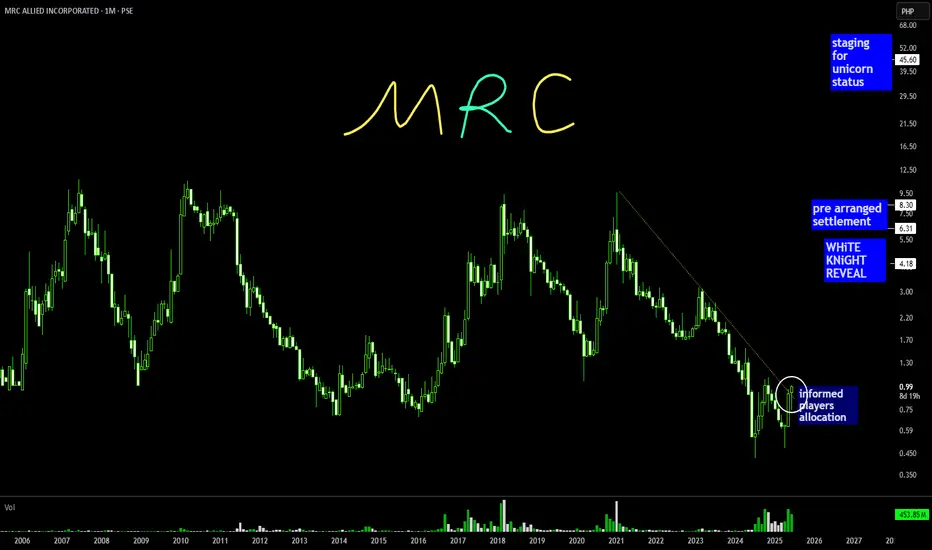
MRC: 0.99 | a Mining Telco jack of all stories SuperStock a cyclical issue with a great story backed up by solid funding
and experts across sectors
it is a survivor
and it rewards early speculators
even strong hands who can average down before the facts news and disclosures
whatever the TREND is
this stock is a facility for heavy hitters to bankroll
and make a windfall for those who got VOLUME at cost of HANDLER
Strategy: the usual Cost Average
Tactic: Buy High Price go Up
dna: DiGiPLUS ACEN DiTO
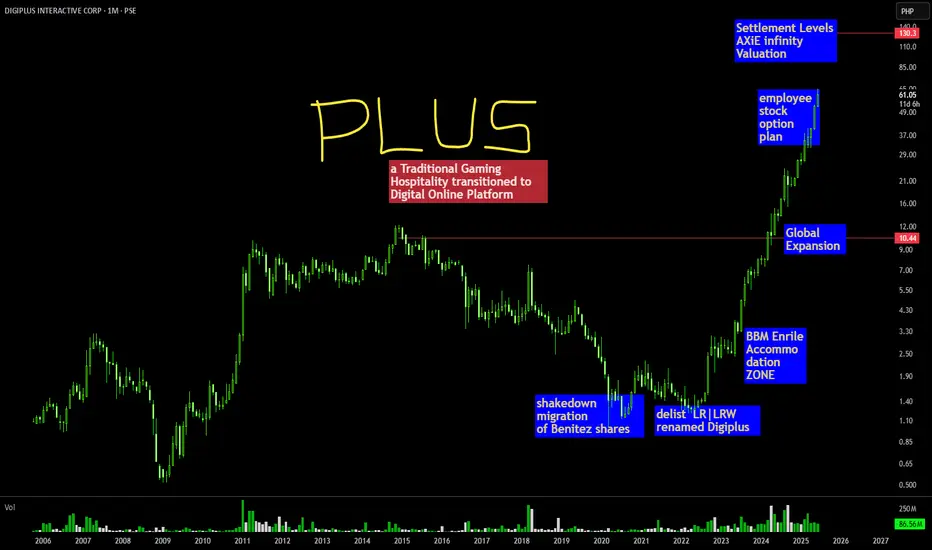
DiGiPLUS: Php61.40 | Note on Political Stocks in the Philippinesa short snapshot of how stocks and prices
move with a political stock
under the custody of OGs and the usual suspects in the house of TSiNOYS
Artificial Depression to Capitulation and obliteration
into Life Changing reward to Lucky players and informed pals
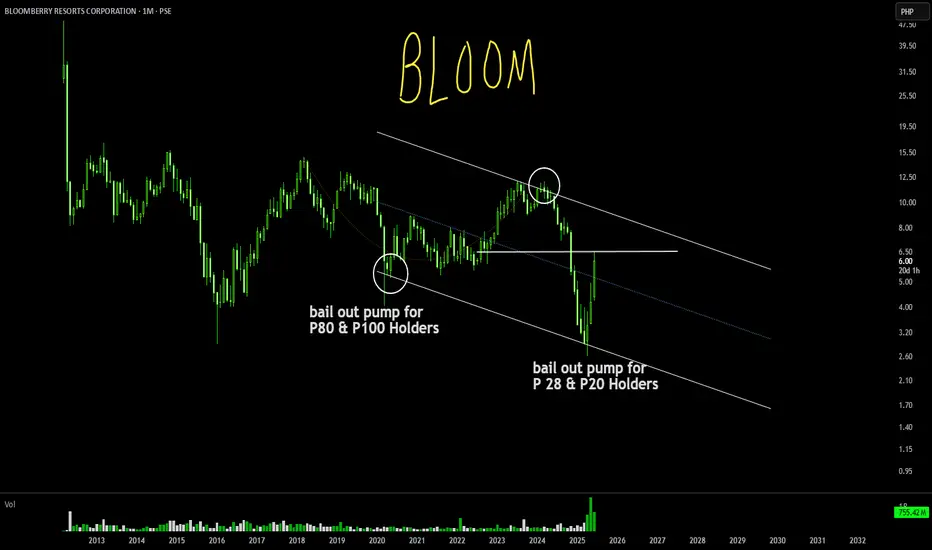
BLOOM: $6.0 | a Spac Backdoored issue Holders at P50 above should be whole again as
the bailout program is in place
the recent run up fueled by GAS acquisition and online Binggo Gaming venture
led to push the iNDEX
buy stops above the equidistant line should be validation of reversal
for now informed dealers are churning the range
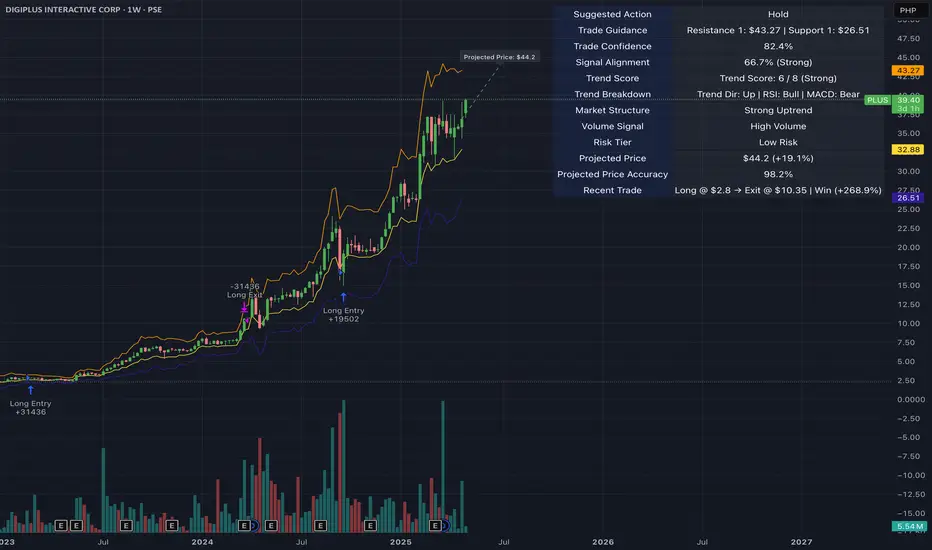
$PLUS Shows a Strong Uptrend: Long at $16.66!DigiPlus Interactive Corp ( PSE:PLUS ) is in a “Strong Uptrend” on a 1-week chart. 📈 We bought at $8.24 and sold at $10.35 previously. Now at $39.45, we’re in a long position at $16.66. With a Trend Score of 6/8 and 66.7% signal alignment, the short-term projected price is $44.2 (+19.1%) , but bearish MACD suggests caution.
How to Trade This Setup:
• Hold the Trend: The uptrend is strong with high volume—hold the long position from $16.66 for now.
• Set Targets: Aim for Resistance 1 at $43.27; Support 1 at $26.51 is key if a pullback occurs.
• Manage Risk: With bearish MACD, consider tightening stops or taking partial profits near $44.2.
What’s your next move on PSE:PLUS ? Let’s discuss in the comments! 💡 #Trading #PLUS #Analysis
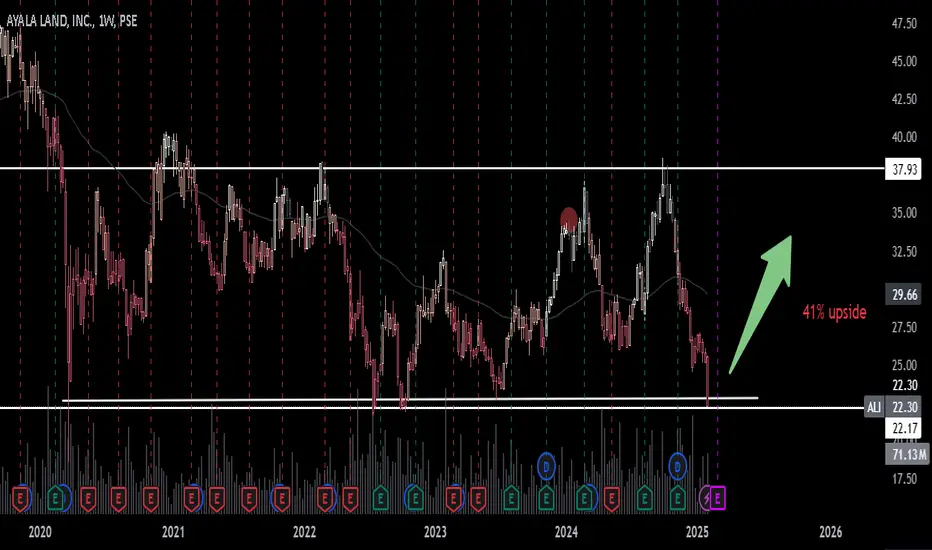
Buy and holdA good business may at times be priced wrong. And when it is, that's when you buy.
Learn to put a value on things even if it's just book value over market price per share and when you see there is a discrepancy and a discount and when you believe something will continue to go up over time especially if the fundamentals are solid. Buy
Buy and hold and wait. The boring but good of it.

Fib at buyI like how the fib is at fair price. Where fundamentals show so much increase in free cash flow this quarter. Company is growing smart and lessening their expenses.
Excited for the dividends.

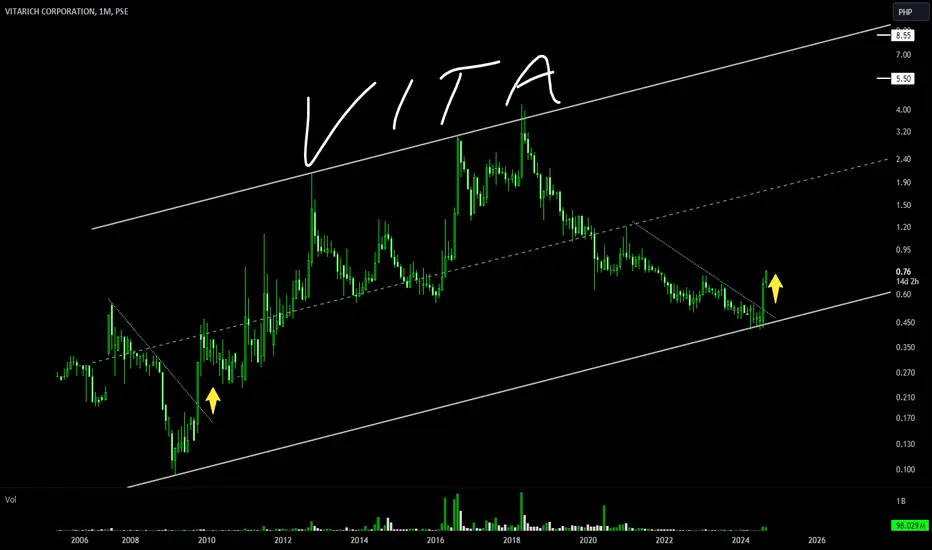
ViTA: ₱0.75 | Winner Winner Chicken Dinner in a land where chicken can be dressed cooked and presented in many ways
this company may just realized its value when food security and demand for chicken
shall be parabolic
artificially depressed for the next cycle
and at sub ₱1.0 has always been an opportunity to get volume for that
generational wealth
strategy: size in before it catapults
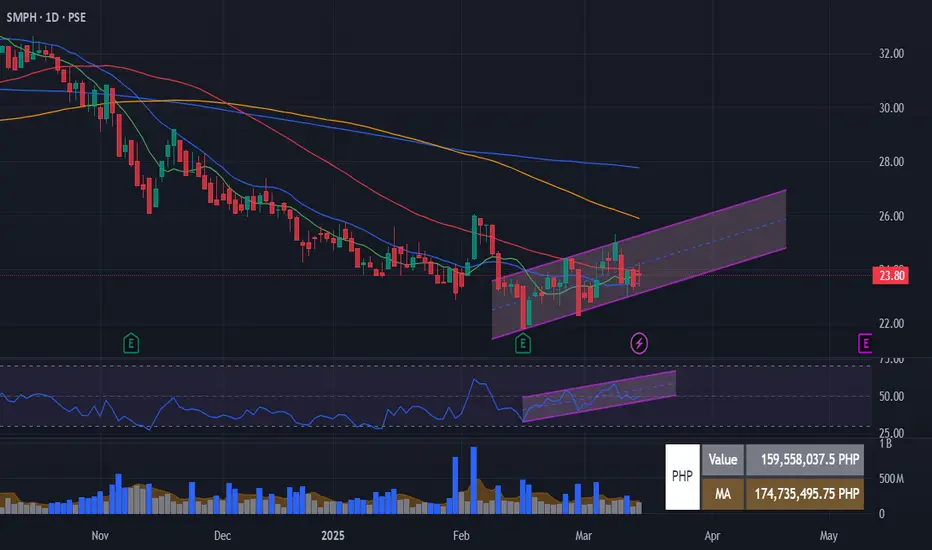
SMPH Possible Trend ReversalAfter months of downtrend, SMPH seems to be somehow recovering from its bearish sentiment. From downtrend to sideways
Confluence
Macro: Shift from downtrend to sideways
Daily chart: higher lows
RSI: higher lows
Short term outlook: Looking like a 1 month short term uptrend.
Other Notes
Possibly looking to make a DB MB BO and hopefully a DB BT BO
Coming from a macro downtrend, sentiment shifting to defensive stocks. Property sector may not be the first mover post bearish sentiment since its not a defensive sector but perhaps the speculated rate cuts may help.
Earnings also released and looking good.
At demand zone. Fundamentally sound. At the discount price. Best place to buy and hold.
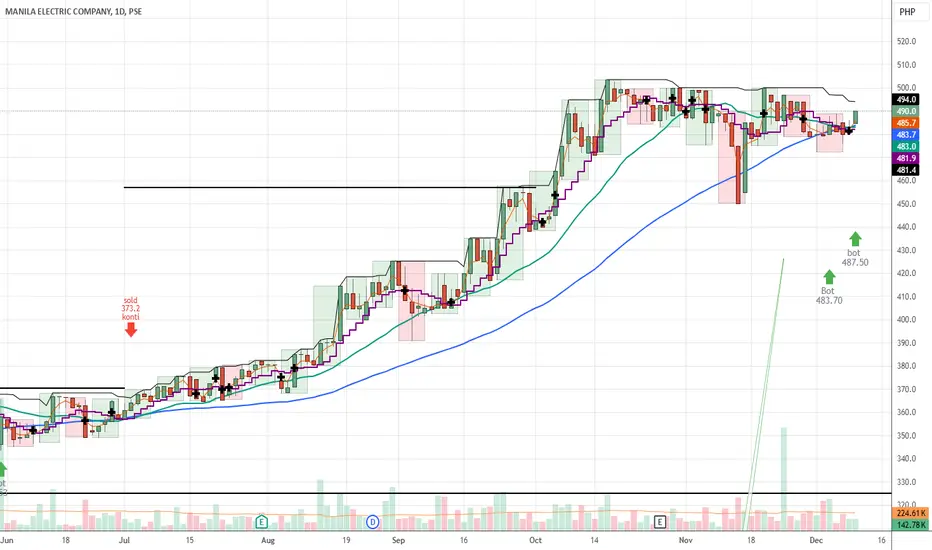
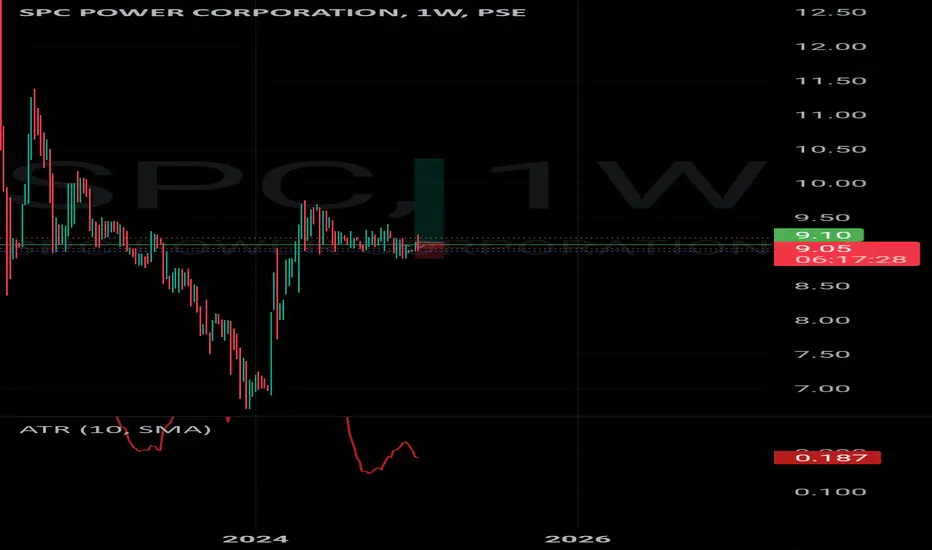
We all need electricity as it is the life blood of the nation.
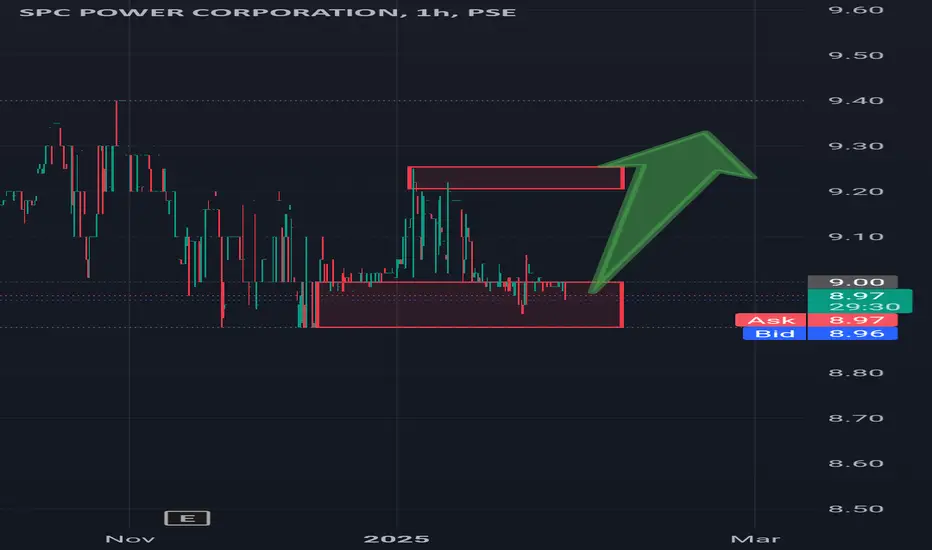
Turtle spc new week goes bullish Donchian channel breaks up and is now on pull back.
People took profits amidst the breakout.
Momentum is back to the middle line where orders have been accumulating.
Long term play is very good. Dividends steady. Fundamentals hurdling everyday life and grind.
When you look at a business, that which is important is does it serve mankind?
Yes, eclecticity powers Cebu and is one of the key power providers in Philippines.
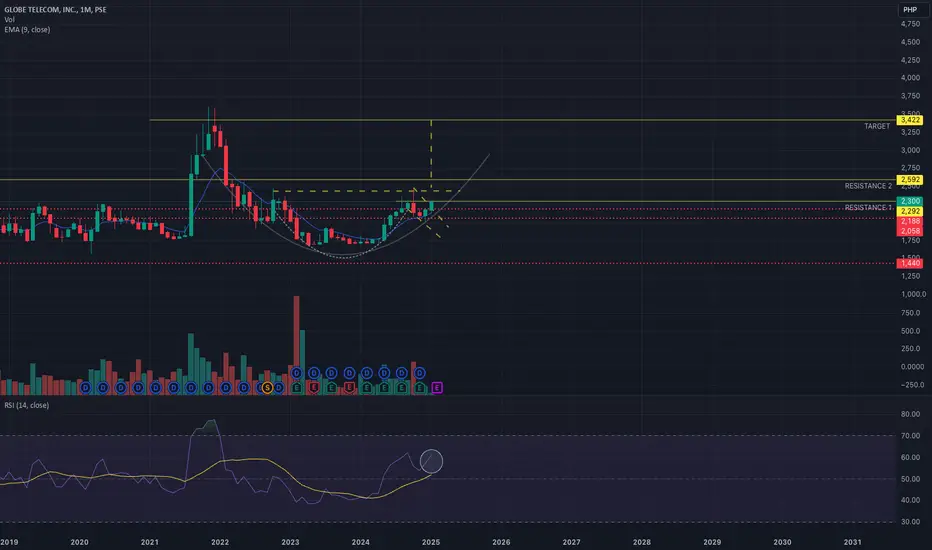
Bullish formation. Globe Telecom stock 🧐
• Potential to reach ₱5,000 per share.
• Last year, the stock was down by 50% from its previous all-time high.
• There’s a possibility of recovery this year, potentially reaching ₱3,400, followed by consolidation.
• A cup-and-handle formation could form, setting the stage for a target of ₱5,000 by 2026.
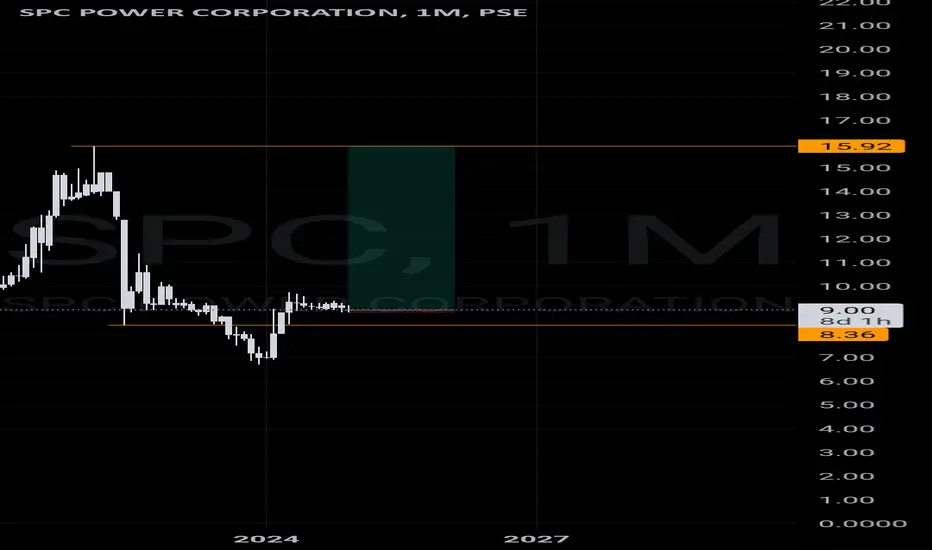
Price action Target of spcBecause the fundamentals are consistent and great; this is my buy and hold estimate.
As long as we need electricity. This company is set to perform steady.
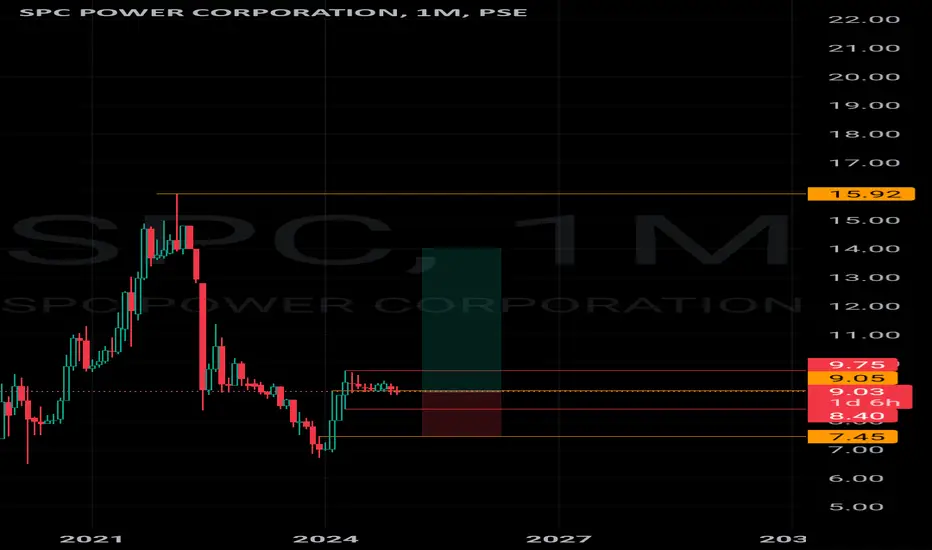
Lots of liquidity upside. Hence we know it can go higher.Fundamentals remain solid and as new Xmas comes more electricity consumption then more profits.
Buy and hold and be patient.
Monthly do show price already has been liquidated to the down and all that is left is to go up.
The Friday range is important. Breakout from the Friday range may lead to possible good entries as we buy and hold.
So check the range this Friday and next week see if it is worth buying the breakout or just holding if it holds and goes lower.
The beauty of stocks is you move the price. So you can trigger a confirmation. But so too can everyone else.
So note the order book.

$MER Bid for contract on LNG results coming soonOn the fundamental side of the business. With the results of MER's bid for the Singapore LNG coming out soon, this will result in additional revenue and earnings for the company.
On the TA side.
stock price may experience a quick upmove, but will eventually revert back, as it needs more time to digest the big upmove from july to Oct.
May need to consolidate for 4 months more.