bldn Technical Pattern Observed:
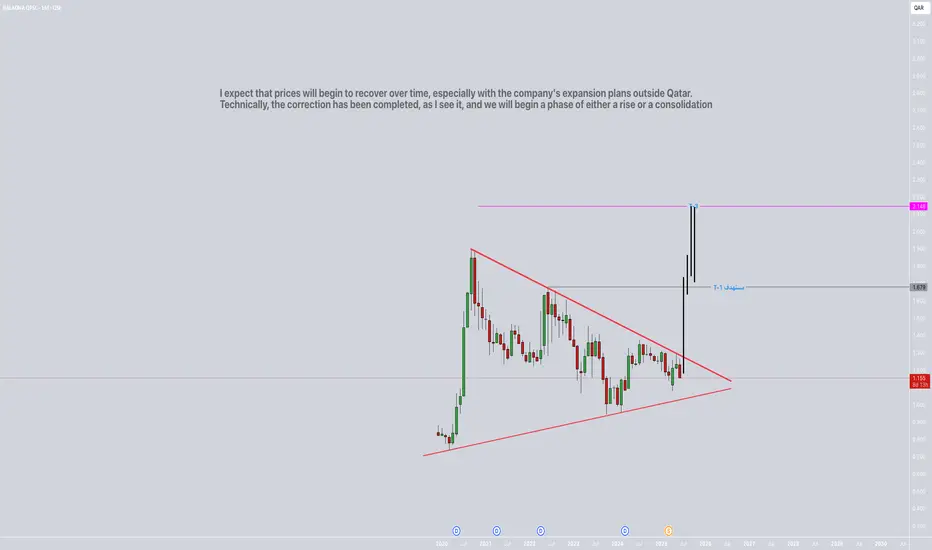
The chart shows a Symmetrical Triangle pattern that has formed since around 2021.
The price has recently broken out of the triangle to the upside, which is typically seen as a bullish signal indicating a potential trend reversal or continuation.
📈 Projection Targets:
Target 1 (T-1): QAR 1.679
Target 3 (T-3): QAR 2.148
These targets are derived by projecting the height of the triangle from the breakout point upwards.
📊 Analyst Commentary (from chart text):
"I expect that prices will begin to recover over time, especially with the company's expansion plans outside Qatar. Technically, the correction has been completed, as I see it, and we will begin a phase of either a rise or a consolidation."
This supports a bullish outlook for Baladna, assuming the breakout holds and the broader market conditions are favorable.
✅ Implications for Investors:
Medium to Long-Term Investors: This breakout could be a signal to consider entry, especially if price action confirms the breakout with increased volume.
Suggested Technical Stop-Loss: Below the lower boundary of the triangle (around QAR 1.10), in case of a false breakout.
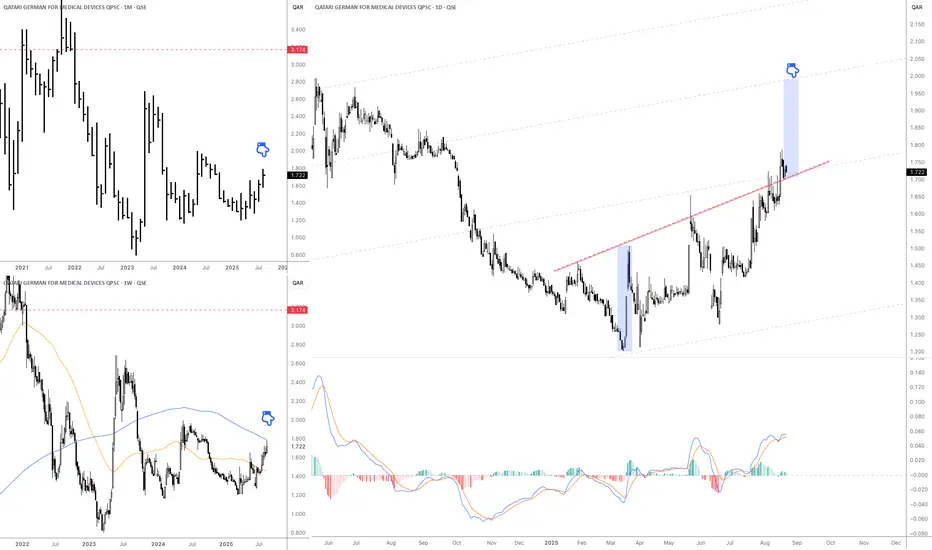
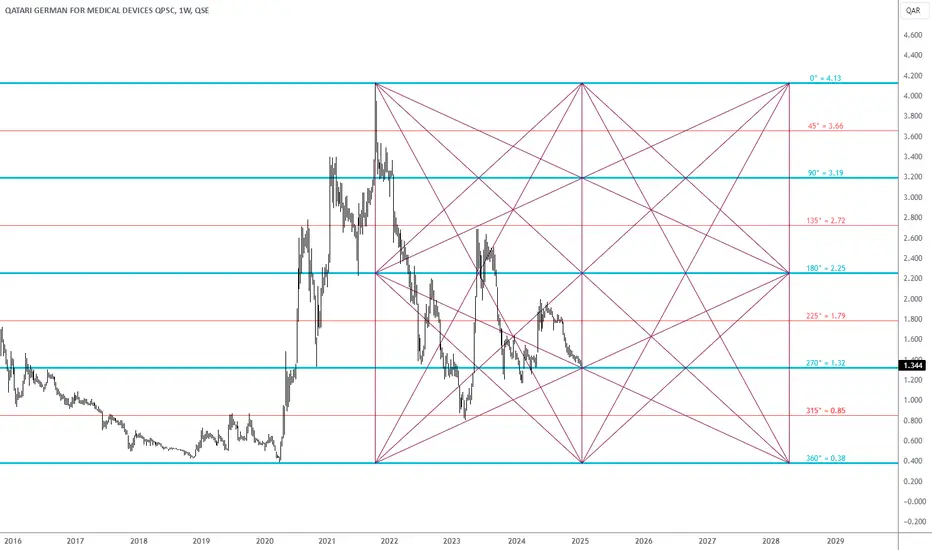
QGMD1. Monthly Chart (top-left)
Current price is around QAR 1.72 – 1.80.
Long-term trend has been bearish, but the stock seems to be forming a base and gradually moving higher.
Major long-term resistance sits at QAR 3.17.
2. Weekly Chart (bottom-left)
The 200-week moving average (blue) is close to the current price → a strong resistance test.
A confirmed breakout above the 200-week MA would strengthen the bullish case.
The 50-week moving average (orange) is turning upward, signaling improving momentum.
3. Daily Chart (right side)
The stock broke above a downtrend line (red) and is now holding above it, showing a bullish breakout.
The projected short-term target is around QAR 2.00 – 2.05, based on the rising channel.
MACD indicator is positive, supporting continued bullish momentum.
Key Levels
Nearest Support: QAR 1.60 – 1.65
Short-term Resistance: QAR 2.00 – 2.05
Long-term Resistance: QAR 3.17
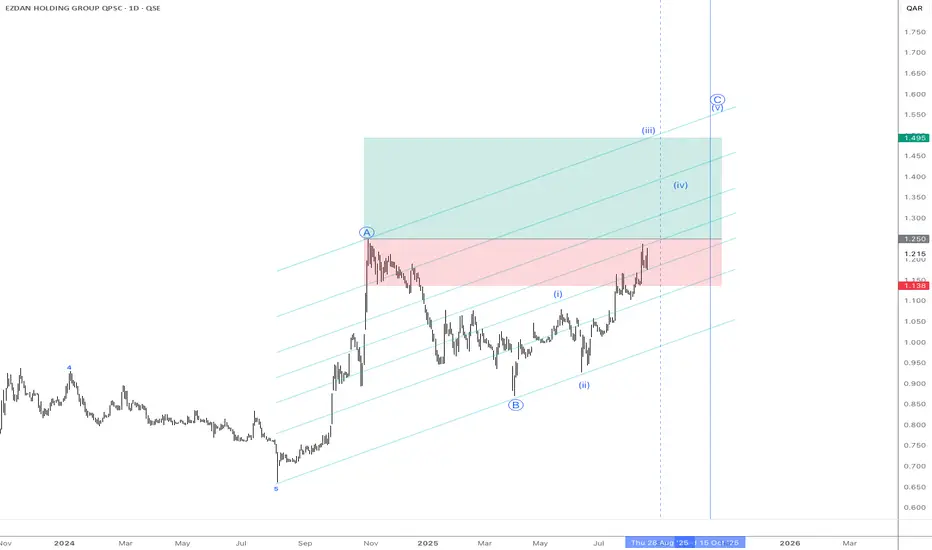
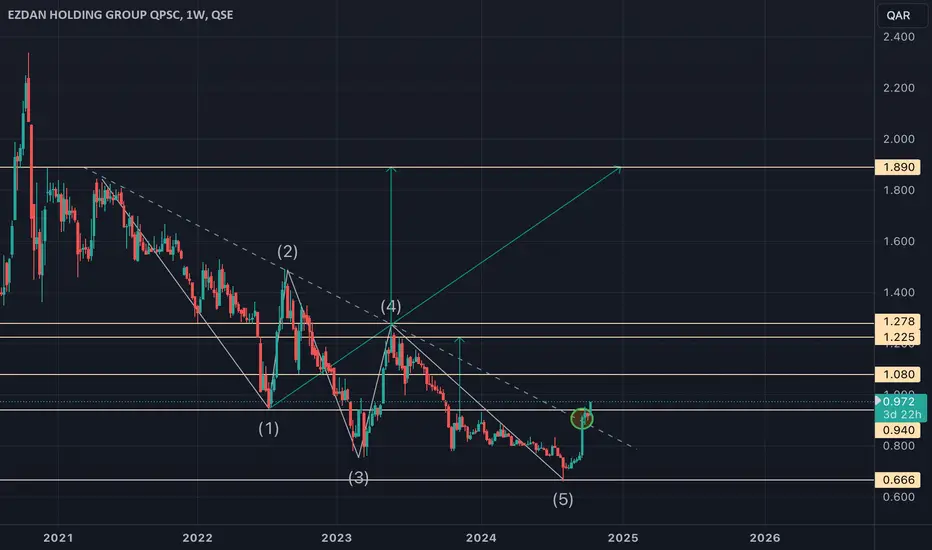
eres.qaKey Points
Wave A and B
Wave A peaked near 1.25–QAR.
Wave B dropped the stock to around 0.85 QAR.
Current Wave C
The stock is now in Wave C, which itself is subdivided into five smaller waves (i, ii, iii, iv, v).
Right now, price is around 1.215 QAR, likely at the end of wave iii or starting wave iv.
Potential Targets
Final Wave C target is projected around 1.5–1.550 QAR, aligning with the upper channel.
Before reaching that, a corrective wave iv pullback could occur near 1.30–1.35 QAR, followed by a final push upward (wave v).
Timeframe
The vertical marker suggests the expected move could complete between late August and mid-October 2025.
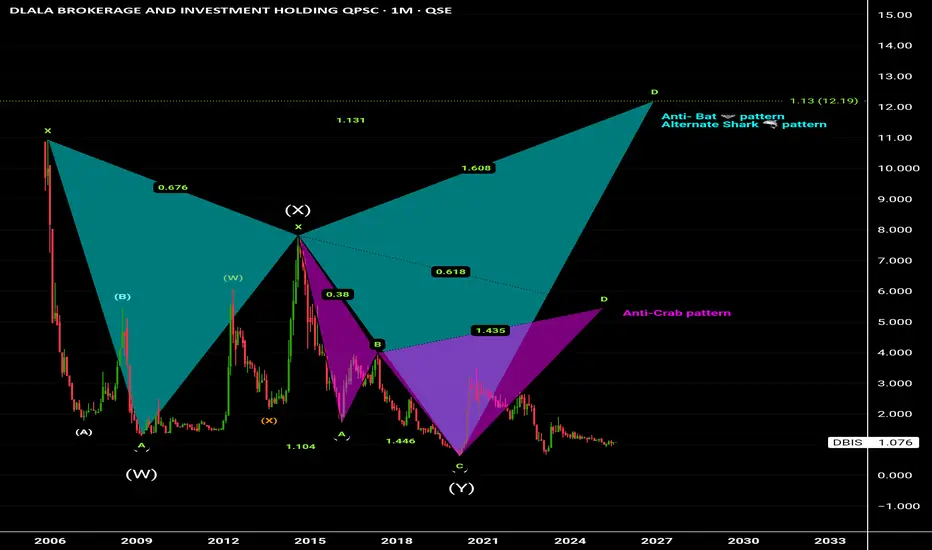
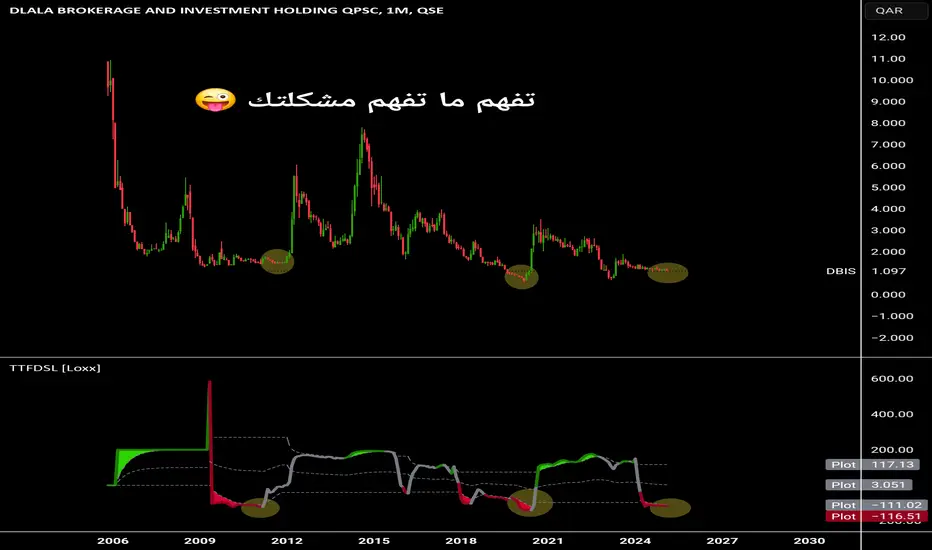
Dlala Holding ( DBIS ).Dlalal Stock on Explosive Level.
1st Target price ( Anti-Crab ) .
2nd Target price ( Anti-Bat ) / ( Alternate-Shark ) .
Highly recommended for Buying 👌- Strongly recommended for Buying 💥💥💥
siis-qa
✅ Current Price Action:
Current price: 0.676 QAR.
⚠️ Risk/Watch Zones:
A confirmed breakout above 0.70–0.72 QAR is needed to strengthen bullish confirmation.
A drop back below 0.63–0.60 QAR would invalidate the breakout in the short term.
Watch for increased volume to validate this breakout.
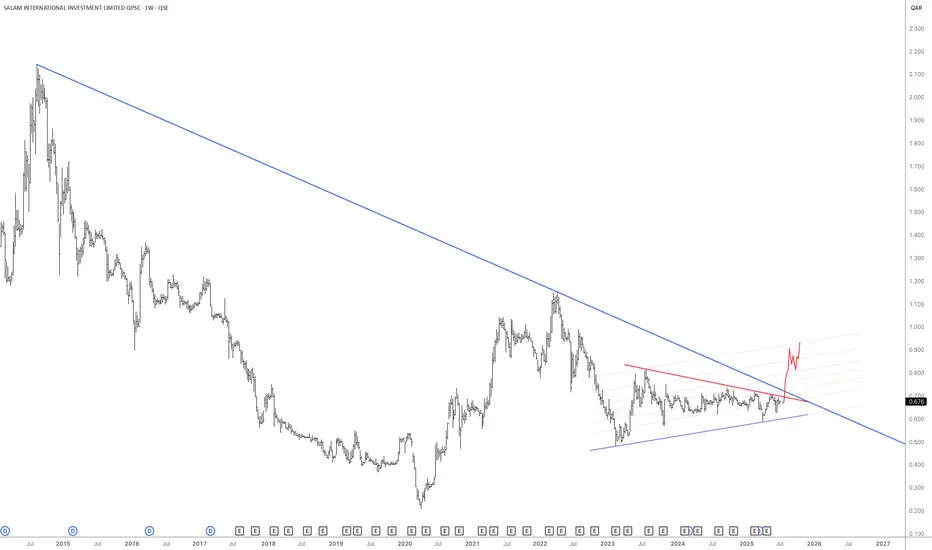
ERES LONGWeekly chart of ERES
Just broke the downward -channel since 2021-
First goal 1.08 - 10.7%
Second goal 1.22 - 25%
Third -VERY LONG TERM- goal 1.89 - 93%!!
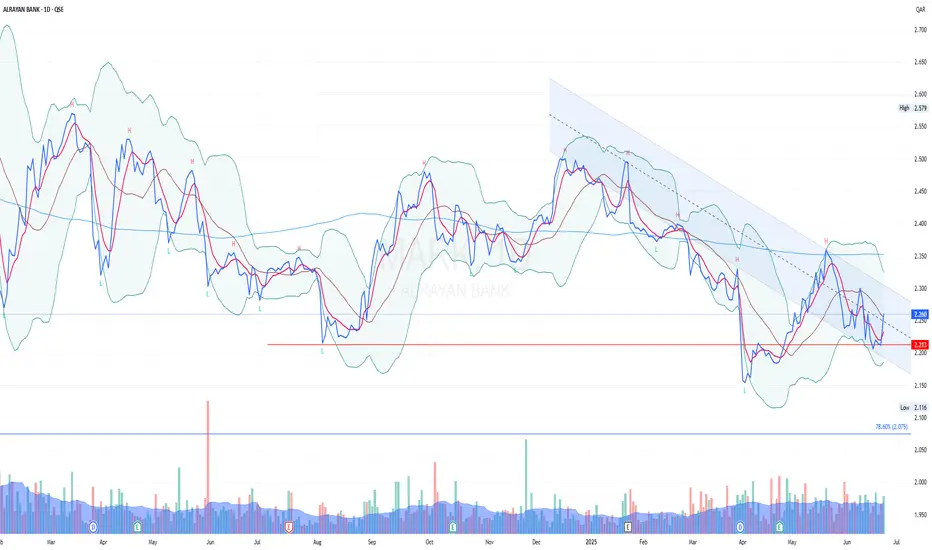
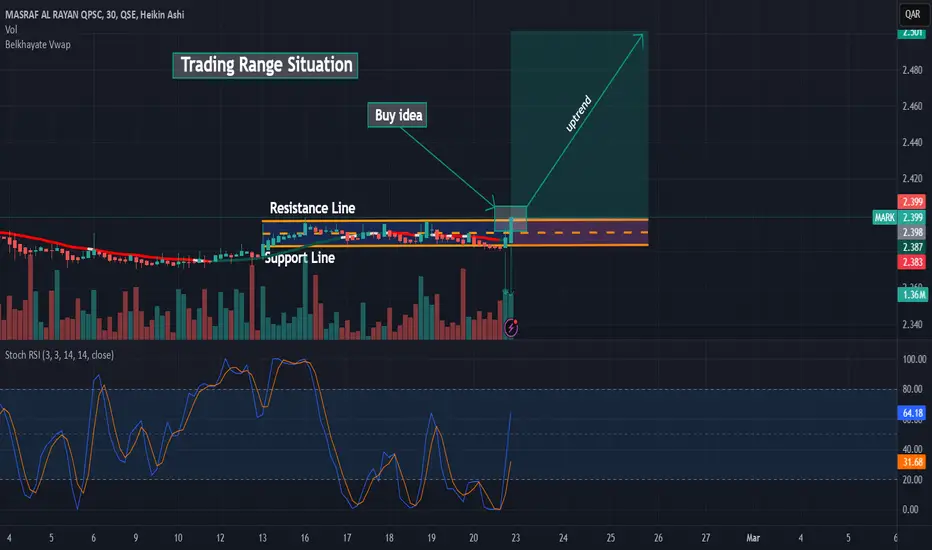
MARK – Al Rayan Bank (Daily Chart Insight)This setup is developing and might catch attention soon.
MARK is currently trading in a clear downtrend within a well-defined parallel channel. While the chart shows a lot of noise; with overlapping swing highs and lows forming scattered support/resistance, there are early signs of a potential reversal.
We’re not entering just yet. However, a strong breakout above the upper trendline, especially with volume confirmation, could signal a major shift and possibly a sharp move upward.
🔍 Key Observations:
- Still in a downtrend
- Complex and noisy chart structure
- Parallel channel used as the main guide
- Potential for reversal and a breakout
📌 Action:
Stay on close monitoring. Let price action and volume lead the way. No need to rush but be ready if it breaks the channel with momentum.
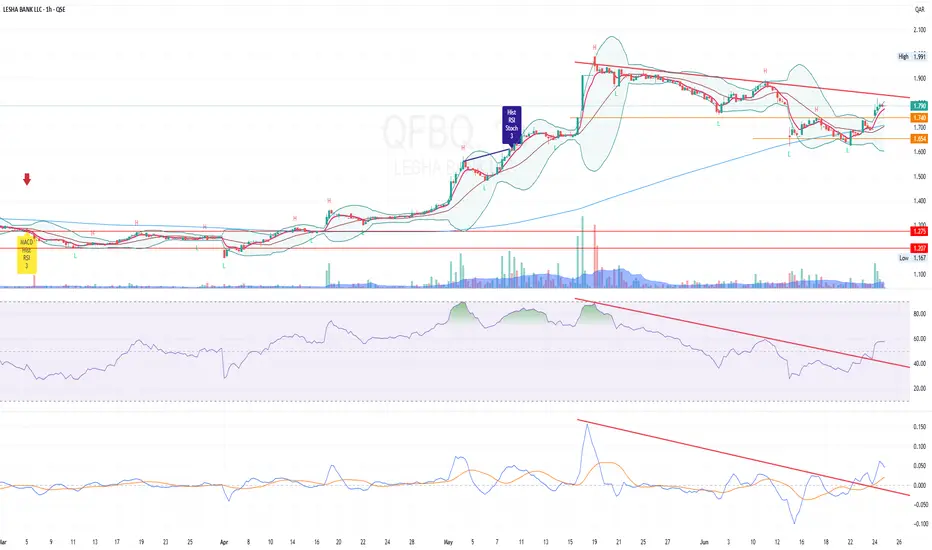
QFBQ – Lesha Bank (Swing/1-Hour Setup)After quite a while, I'm back to share a new idea – hopefully it benefits fellow traders.
QFBQ is shaping up for a potential breakout from the current descending resistance line. Price has recently shown strength with a rebound from the support zone (around 1.65), forming a possible RBS (resistance turned support) setup.
We might see a short pullback before it pushes through the trendline. Watch closely for a clean break to the upside.
Brief Trading Plan
Entry: 1.740
Support / Stop Loss: 1.654
Target TP1: 1.915
Risk: 5% of 60k capital
Units Size: 34,200
Potential ROI: ~10%
Let’s see how price reacts around this level. A breakout with volume could ignite the next leg up.
#QFBQ #QSE #LeshaBank #SwingTrade #Breakout #SupportResistance #TradingQatar #TradingViewIdeas #MainBursaMYkiniQatar
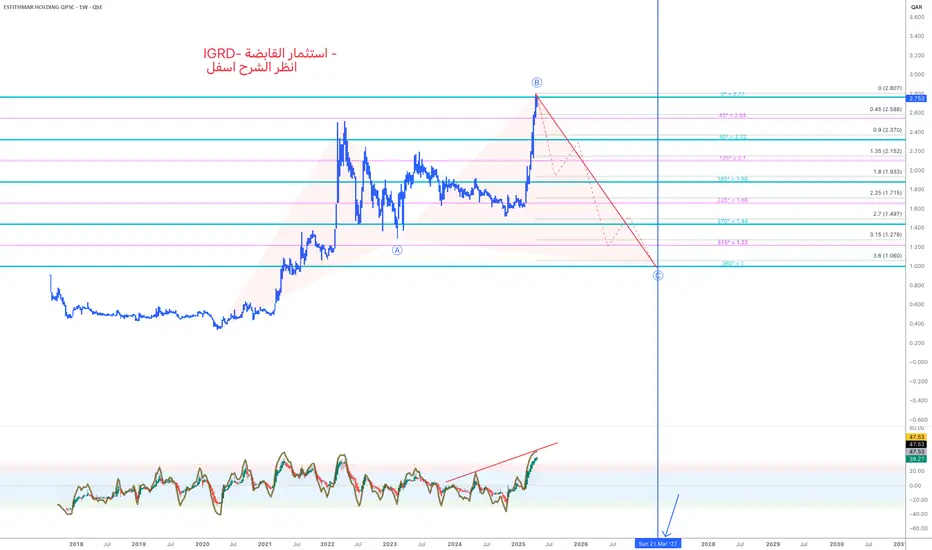
IGRDthe chart shows a technical analysis of Estithmar Holding (IGRD) on a weekly timeframe, using Elliott Wave theory and Gann/Fibonacci angles to predict potential price movements.
Key Observations:
Elliott Wave Pattern – ABC Correction:
The chart suggests that the stock completed wave B at a recent high.
A downward corrective wave C is anticipated, as shown by the red dotted line.
Bearish Divergence:
At the bottom, a momentum oscillator (likely RSI or a similar indicator) shows bearish divergence – price is rising, but momentum is falling.
This is typically a warning signal that upside momentum is weakening.
Downside Price Targets (based on Gann/Fibonacci angles):
Possible support levels:
2.15 QAR
1.93 QAR
1.71 QAR
1.49 QAR
Final target: ~1.06 QAR (as the lowest projected level)
Warning Highlighted:
The red text at the top: "IGRD – Estithmar Holding – See explanation below"
This suggests a bearish outlook unless key resistance levels are broken with strong volume.
Summary:
Current trend: Overbought with signs of weakness.
Outlook: Bearish correction likely.
Action: Watch for confirmation of a downtrend or support at key Fibonacci/Gann levels.
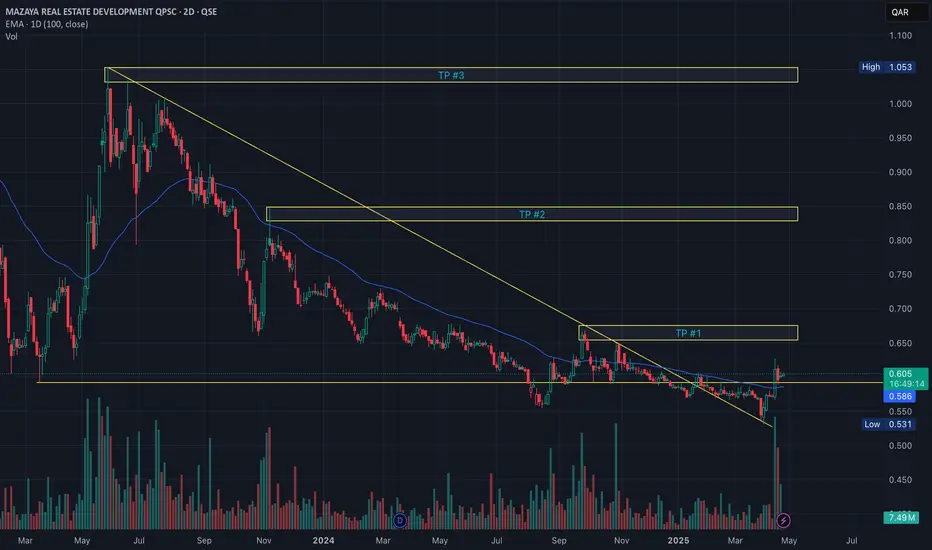
MRDS Major breakout with a success retest As it can be observed from the chart
1- The stock had a clean breakout from a downtrend line formed since 2023 high.
2- The stock retested the trend line after the breakout during the Trump tariff announcement and the stock gained all the loses which is a sign of accumulation in the stock.
3- The stock Just reclaimed 2023 lows with high volume after fake breakout.
4- The stock is currently trading above 100d moving average.
QIBKTrading is hard and it’s not something you can expect to get good at overnight. So if you’re serious about becoming a master of making money on the markets, you’re going to need some top-level schooling.
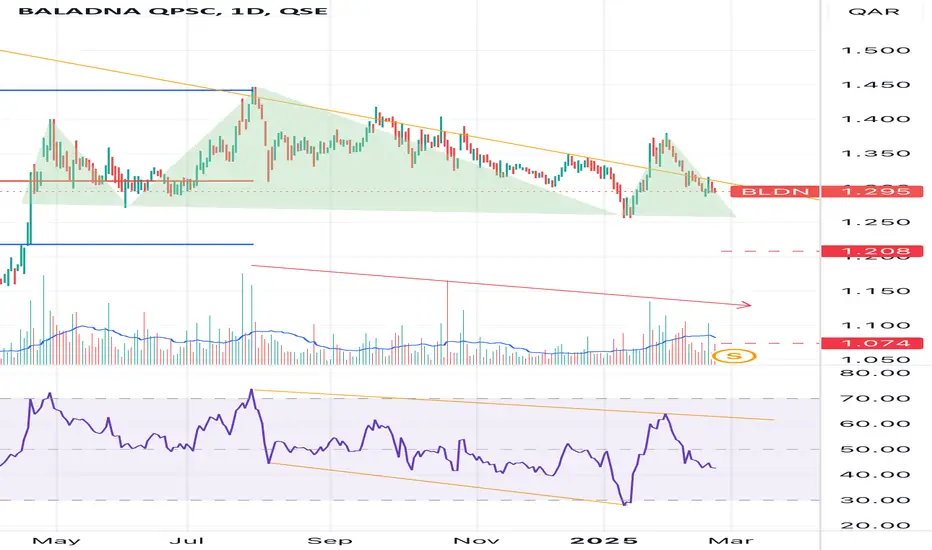
Baladna Short - Daily The technical analysis for Baladna's (BLDN) stock indicates a negative outlook, as there is a bearish divergence on the Relative Strength Index (RSI). This negativity is further confirmed by a clear gradual decrease in trading volumes.
Current Price: 1.295 Qatari Riyals
The price movement shows a downward trend in the short term, with a potential or incomplete "Head and Shoulders" pattern, as illustrated in the chart. If the conditions for the Head and Shoulders pattern are met, the minimum target price could be 1.074 Qatari Riyals, which may appear catastrophic in the near term. However, upon closer inspection, the volume profile clearly indicates a price direction towards 1.208 Qatari Riyals before it can either bounce back or continue its temporary decline.
Support and Resistance Analysis:
- Support Levels:
- First support at 1.250 Qatari Riyals
- Second support at 1.200 Qatari Riyals
- Resistance Levels:
- Resistance at 1.350 Qatari Riyals; if breached, the stock could move towards 1.400 Qatari Riyals.
This analysis highlights the need for caution and close monitoring of future developments for the stock.
Dlalah Holding .Dlalah Stock in triggered zone , any moment will exploded soon .
Target prices above 5 Qatari Riyals .
Accumulation zone now .
MARK: Buy idea: Trading Range SituationOn MARK as you can see on the graph we are in a range trading situation with the strong break of the vwap and the resistance line by a large green candle which is followed by a large green volume. This configuration of the chart signals to us a high probability of having an uptrend.
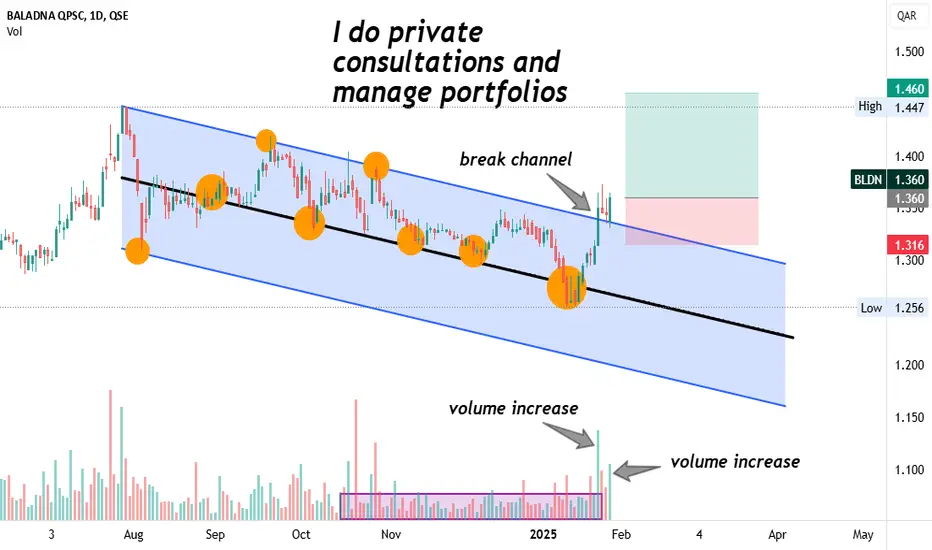
BALADNA QPSCacording to my previous technical studies,i see a great opportunity with high probability of succes,the details are reflected in tge chart,good luck to all
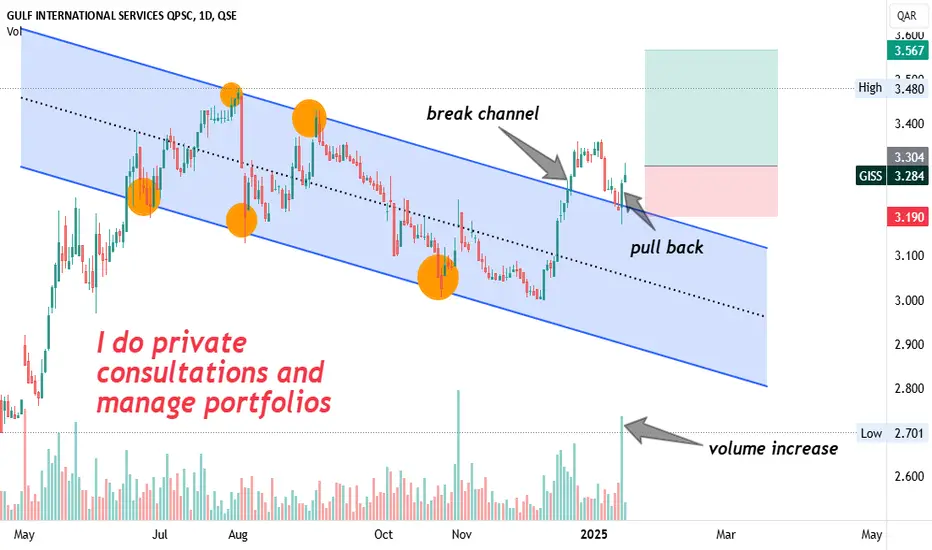
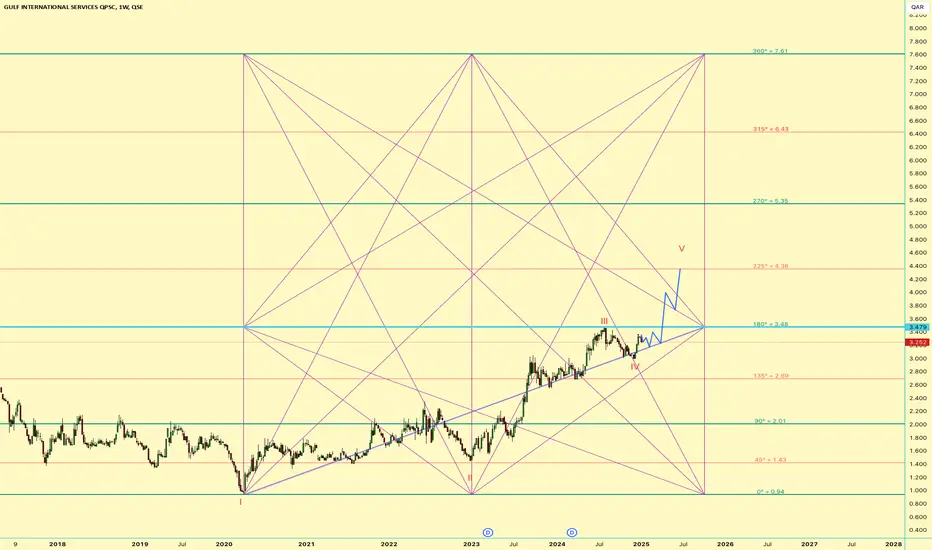
GULF INTERNATIONAL SERVICESacording to my previous technical studies,i see a great opportunity with high probability of succes,the details are reflected in tge chart,good luck to all
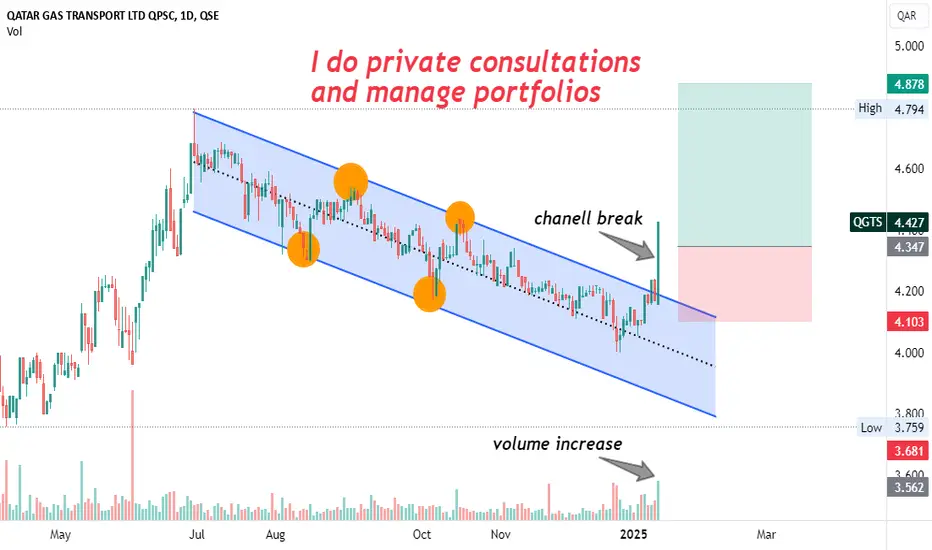
QATAR GAS TRANSPORT LTDacording to my previous technical studies,i see a great opportunity with high probability of succes,the details are reflected in tge chart,good luck to all
QGMDTrading is hard and it’s not something you can expect to get good at overnight. So if you’re serious about becoming a master of making money on the markets, you’re going to need some top-level schooling.
GissTrading is hard and it’s not something you can expect to get good at overnight. So if you’re serious about becoming a master of making money on the markets, you’re going to need some top-level schooling.
mcgsTrading is hard and it’s not something you can expect to get good at overnight. So if you’re serious about becoming a master of making money on the markets, you’re going to need some top-level schooling.

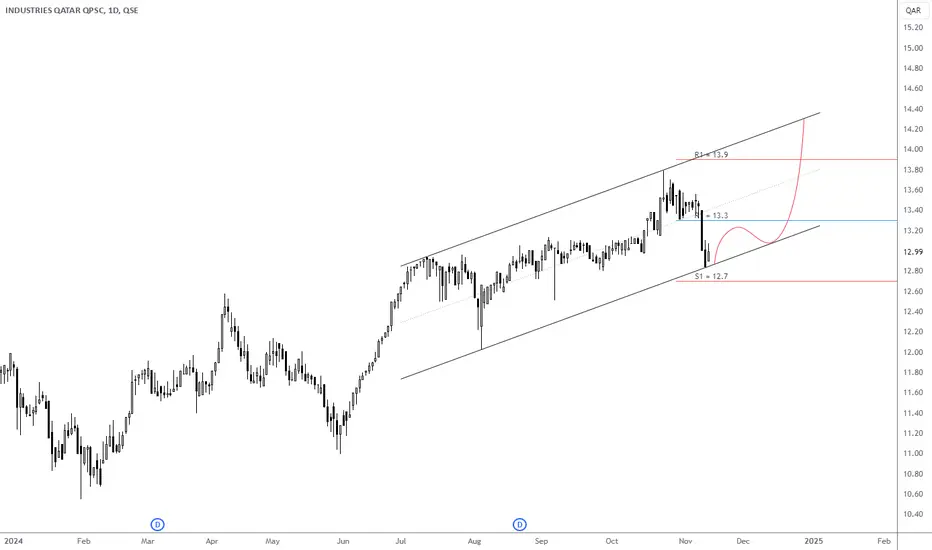
IQCD- Qatar The sharp decline during the previous two sessions, I think, was the last decline in the current wave. We are monitoring the current price channel.
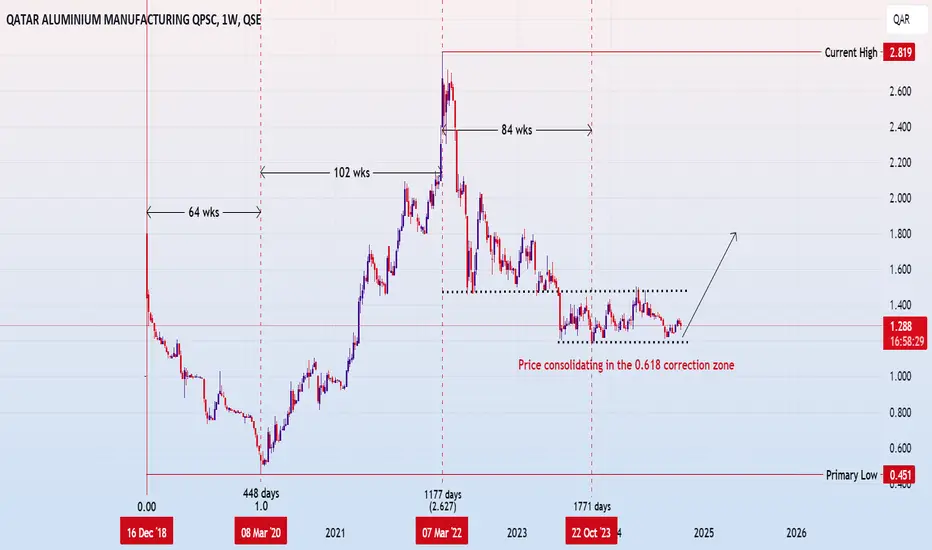
LONG FROM ACCUMULATION ZONETime progression is well divided into growth of Phi, price has reached the 0.618 (1/Phi) division of the entire bull cycle. A medium term correction is expected to reverse the trend back up from the accumulation zone.
Trade safe, good luck
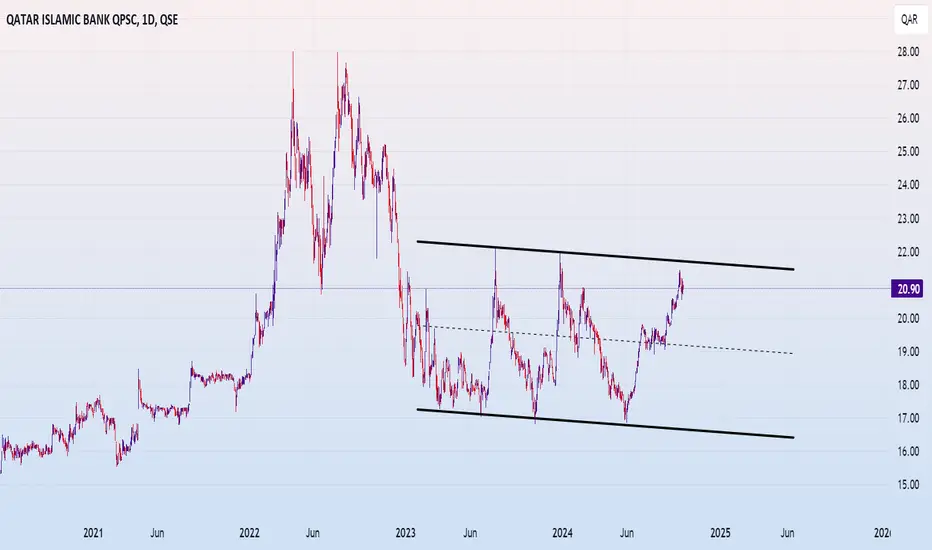
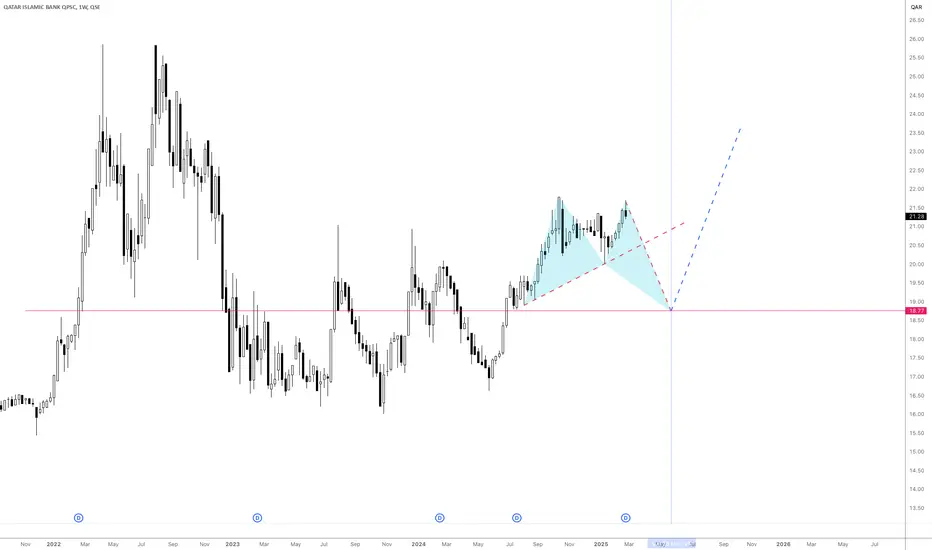
QIB DAILY PRICE CHANNELPrice trading in a channel looking for a break out of either side of the boundaries
Typically price is expected to move higher on longer term but for short term price will retreat from the upper channel towards the equilibrium line.
Trade safe, good luck