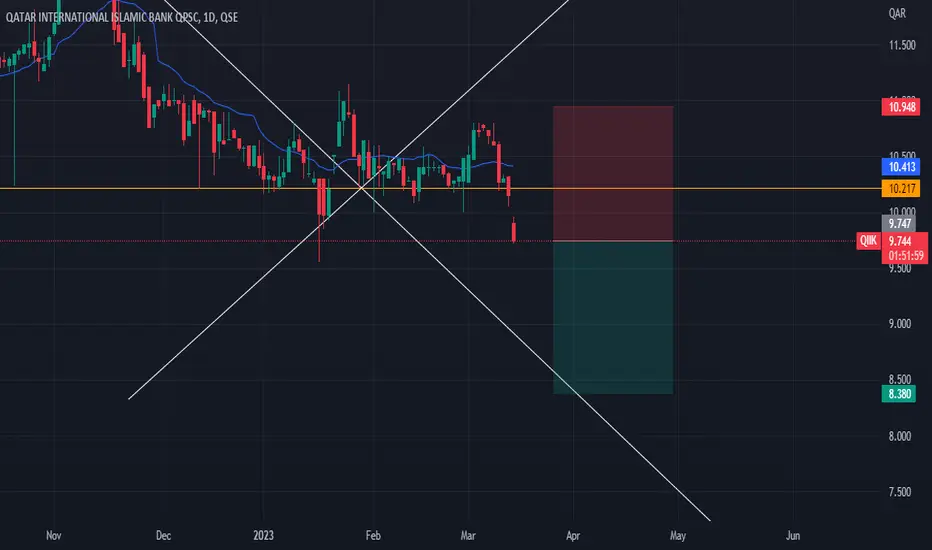
short position on QIIKMy strategy is based on price action with the reading of certain indicators that I like while respecting all the values that define the stock maket
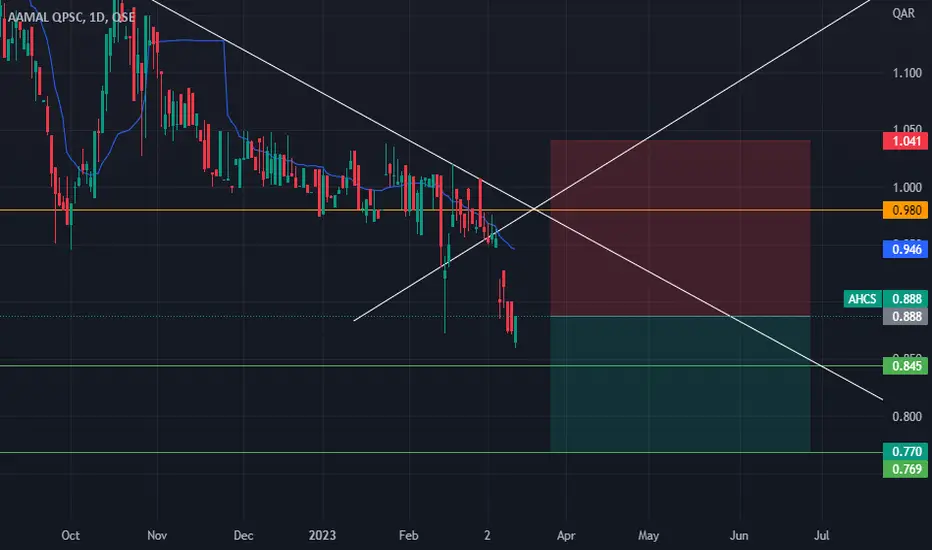
short position on AHCSMy strategy is based on price action with the reading of certain indicators that I like while respecting all the values that define the stock maket
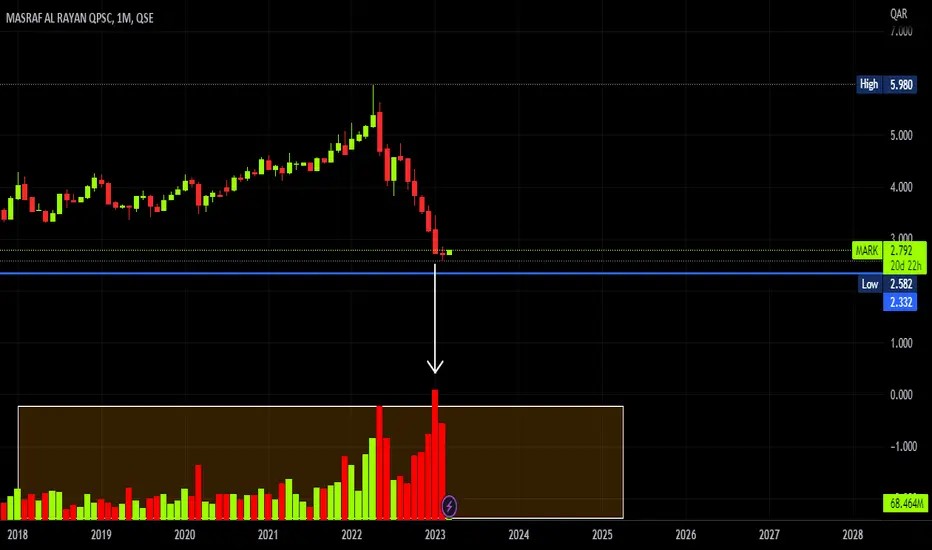
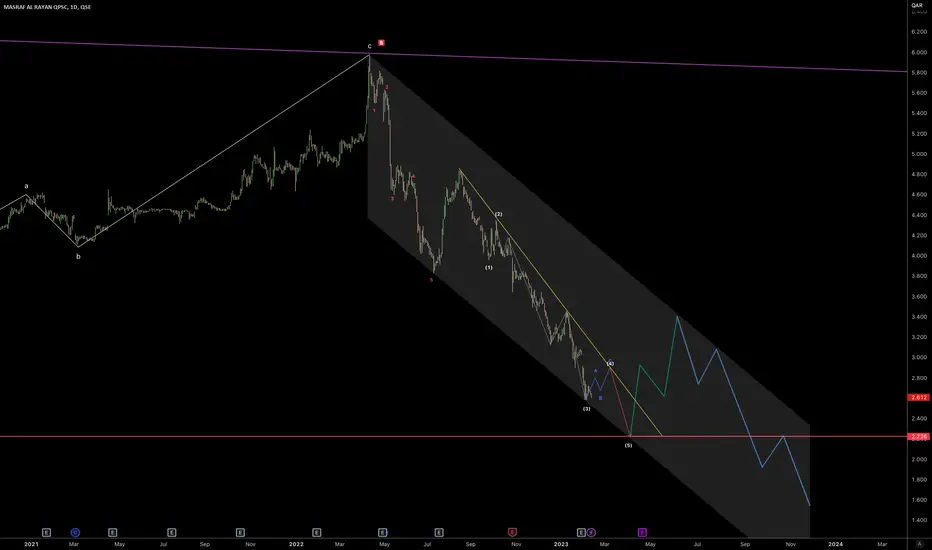
Analysis on MASRAF AL RAYAN Good afternon dear Qatari investors, I want to share with you this analysis I have made on MASRAF AL RAYAN QPSC stock on the monthly chart where you can notice that the price have made a squeeze of sellers with the highest holume in mo,ths followed by a little spring box, waiting for this month to end to get the confirmation to buy the stock.
For more analysis on secific markets don't hesitate to ask and I'll ba answering with pleasure!
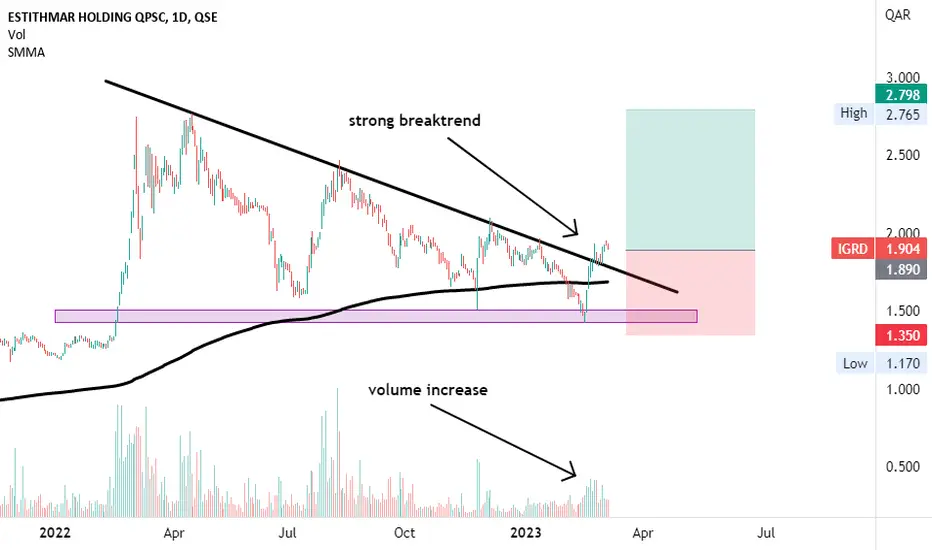
forecasting ESTITIMAR HOLDING in dayli chart Hello to all investors, according to my previous studies and according to my experience as a trader, I see a good investment opportunity with a high probability of success, the details are reflected in the graph
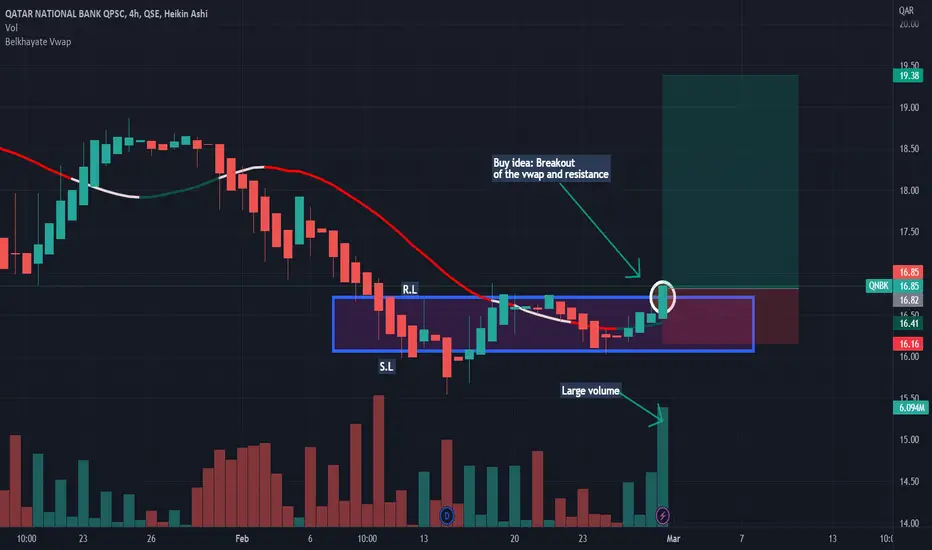
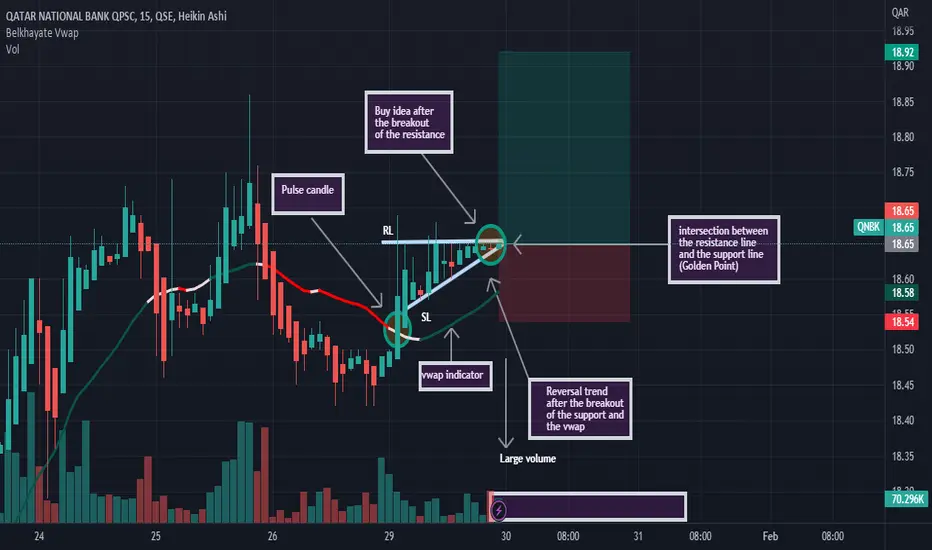
QNBK: Buy ideaAs you see on the chart we have a buy idea because we have the breakout of the vwap and the resistance line.Thanks!
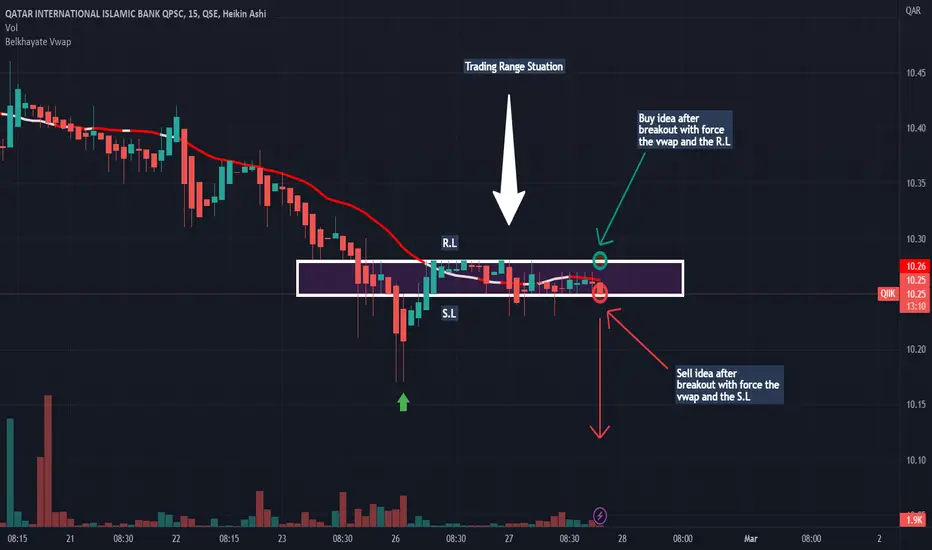
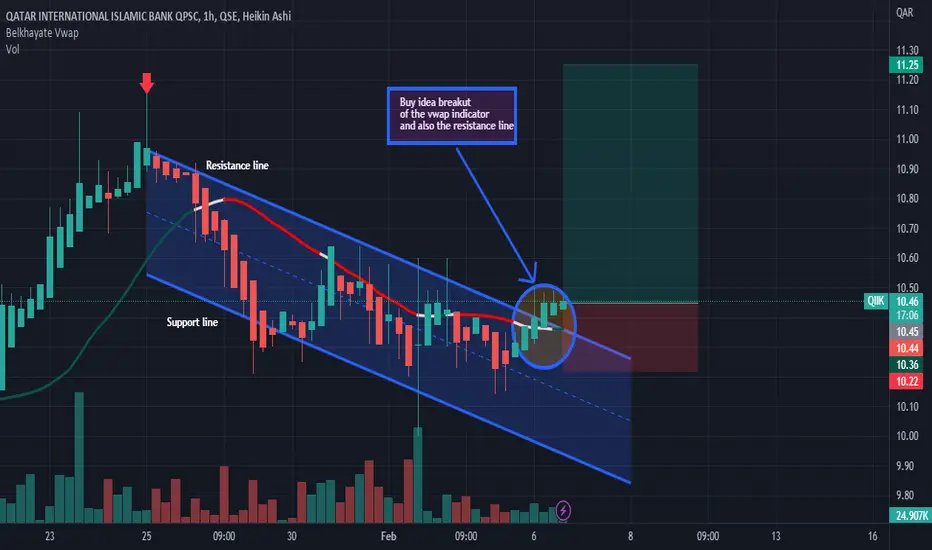
QIIK: Trading range situationas you see on the graph there is a balance between buyers and sellers. We really don't have a real trend. However, if the resistance line and the vwap are forcefully broken by a large green candle and followed by a large green volume it means that we would have a very high probability that the market will go higher. Therefore you enter a buy position as soon as the second green candle appears for more insurance. Furthermore, the market can also go down if and only if the vwap and the support line are forcefully broken by a large red candle and accompanied by a large red volume. So you can enter a sell position as soon as the second red candle appears for more insurance.Thanks!
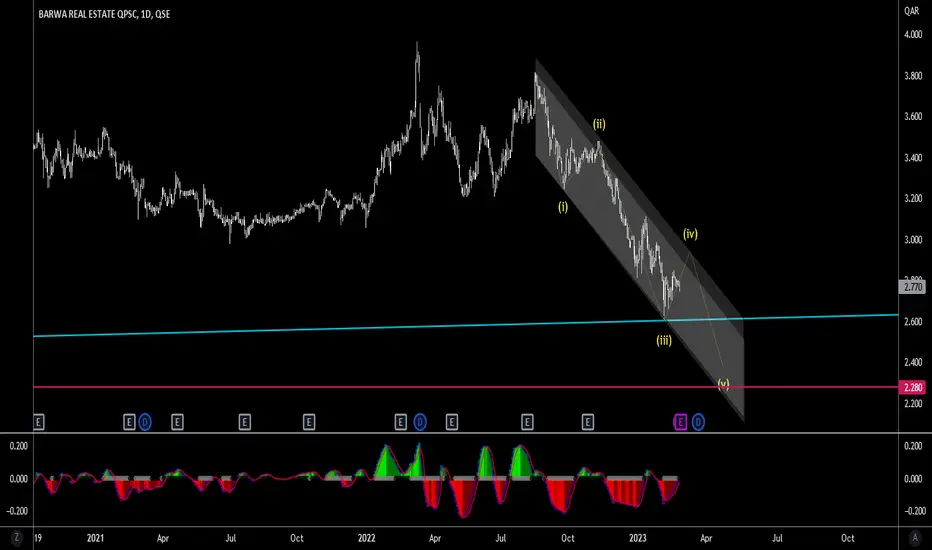
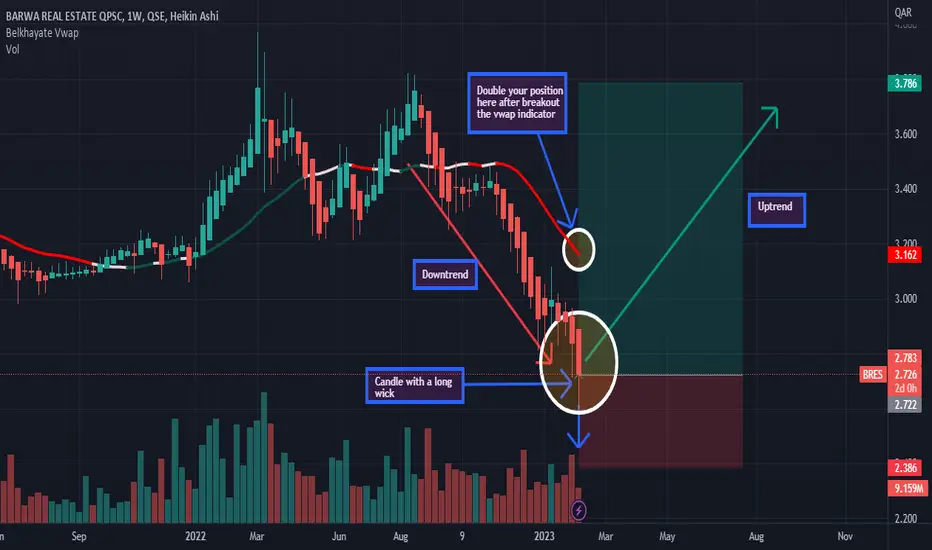
BRESBarwa Real Estate (monthly chart scale - classic)..the price rebounded from 2.6 QR (in conjunction with the rising historical trend line) and to confirm the reversal and target at least the ceiling of the price triangle, the stock needs to cross the level of 3QR with at least a weekly candle, and in case of failure... it may break the triangle It will target at approximately 2.280.QR
qnnsI think that qnns still has a lot of decline ahead of it, and this is due to the world entering a stage of economic recession soon, so do not count on the rise too much!!

markI think that mark still has a lot of decline ahead of it, , and this is due to the world entering a stage of economic recession soon, so do not count on the rise too much!!
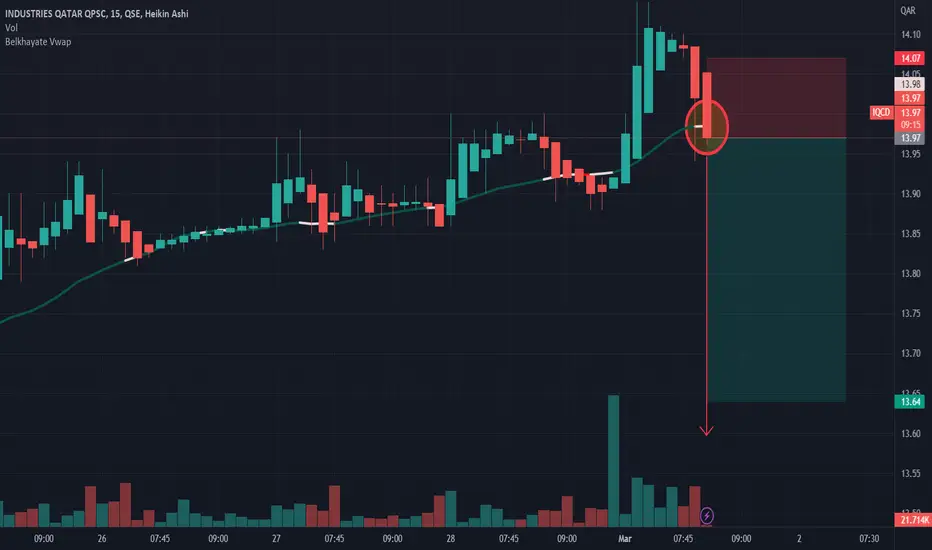
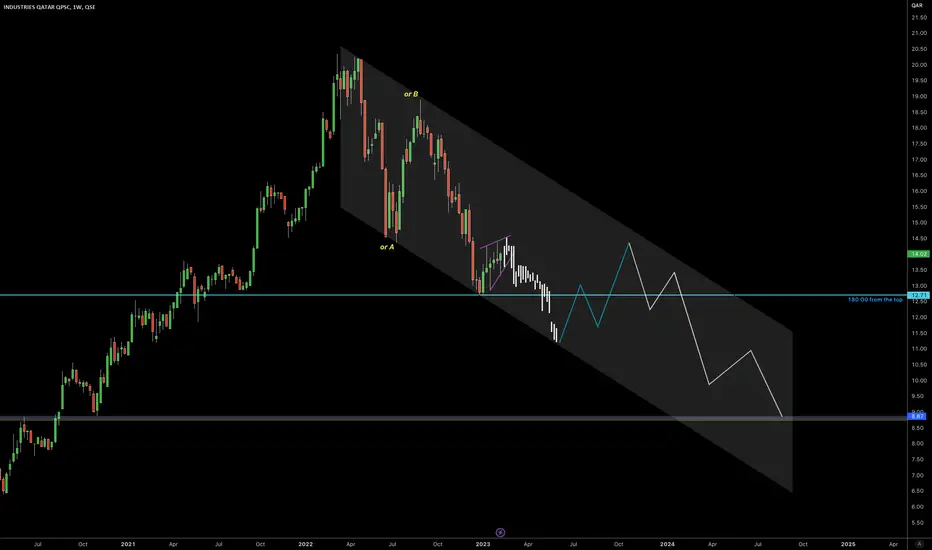
iqcdI think that iqcd still has a lot of decline ahead of it, and this is due to the world entering a stage of economic recession soon, so do not count on the rise too much!!
Buy idea As you see on the chart we will have a big probability of an uptrend. You can see the differents analysis conditions. Thanks!
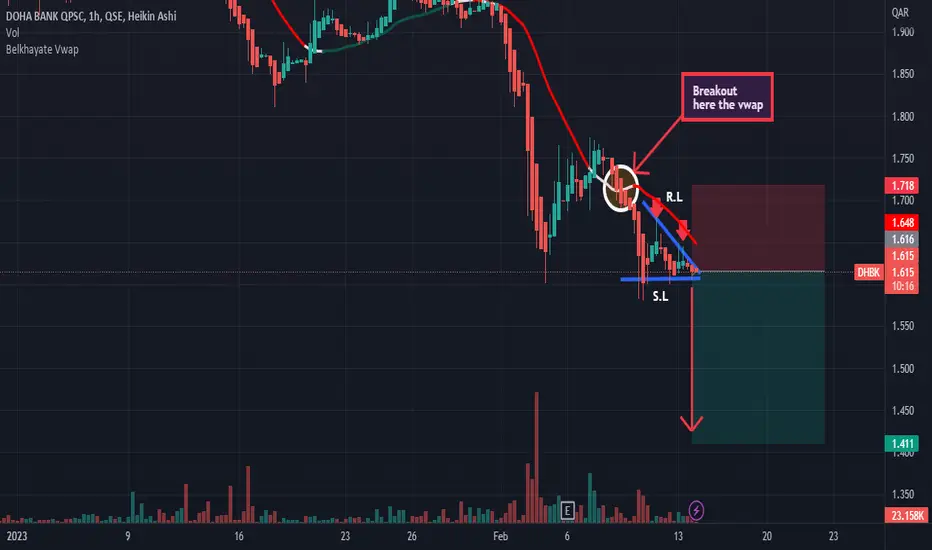
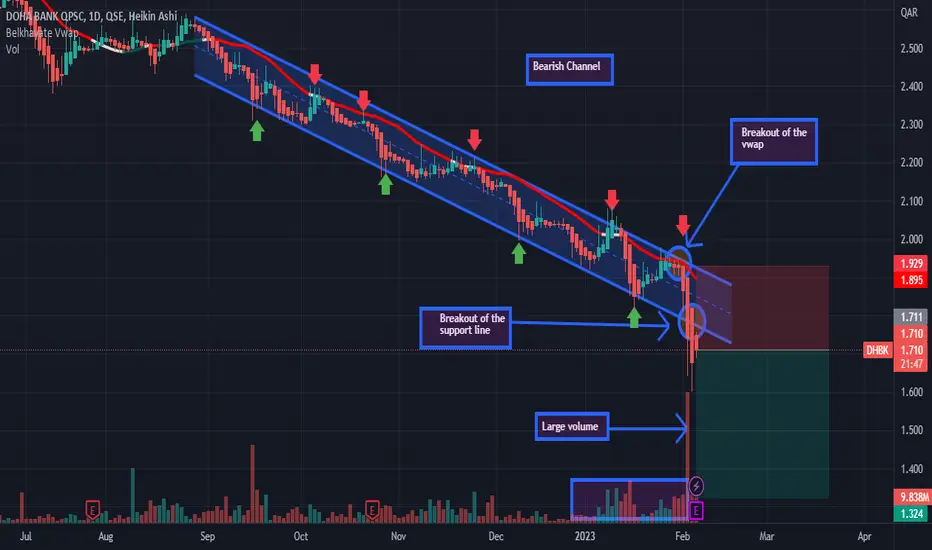
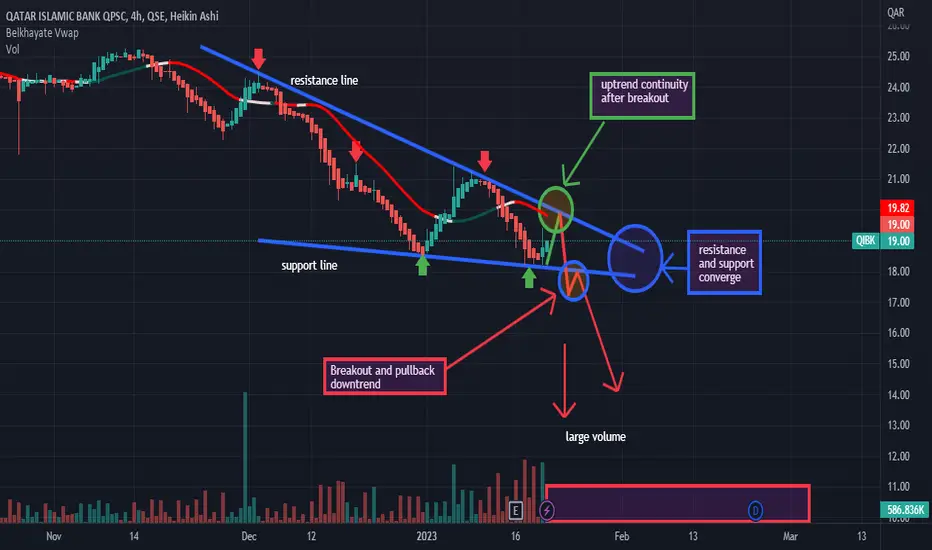
Analysis: Bearish Channel: Sell ideaBearish channel situation. Big probability of a downtrend because we have the breakout with force the support line and the vwap indicator. Thanks!
Buy ideaWe have a buy idea because we have the breakout of the resistance line and the vwap indicator by the buyers. Thanks!
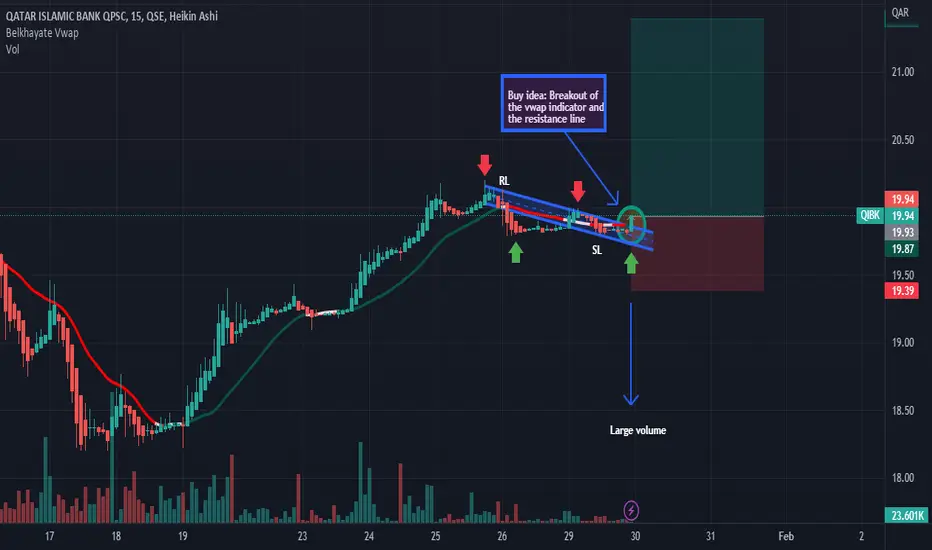
Buy ideaAs you see on the chart we will have a big probability of an uptrend after the breakout with force the resistance line by a big green candle with a large green volume so at the next green candle we can buy. In other hand, if we have the breakout with force the support line and the vwap indicator by a big red candle with a large red volume it's mean that we will have a big probability of a downtrend.Thanks!
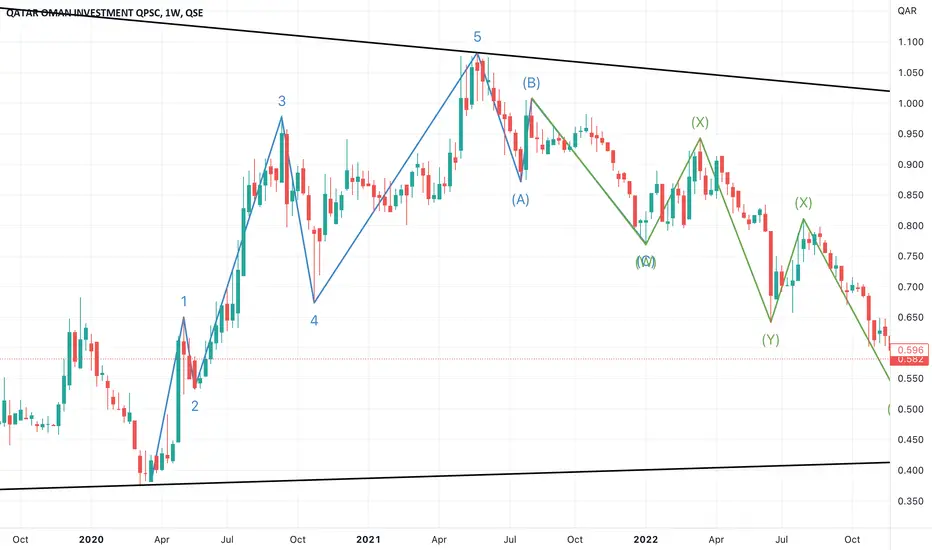
QOISThe completion of a complete cycle of Elliott waves, and the first wave was formed, and currently it is about to complete the third wave, and as it is known, the third wave is the best wave in terms of profit
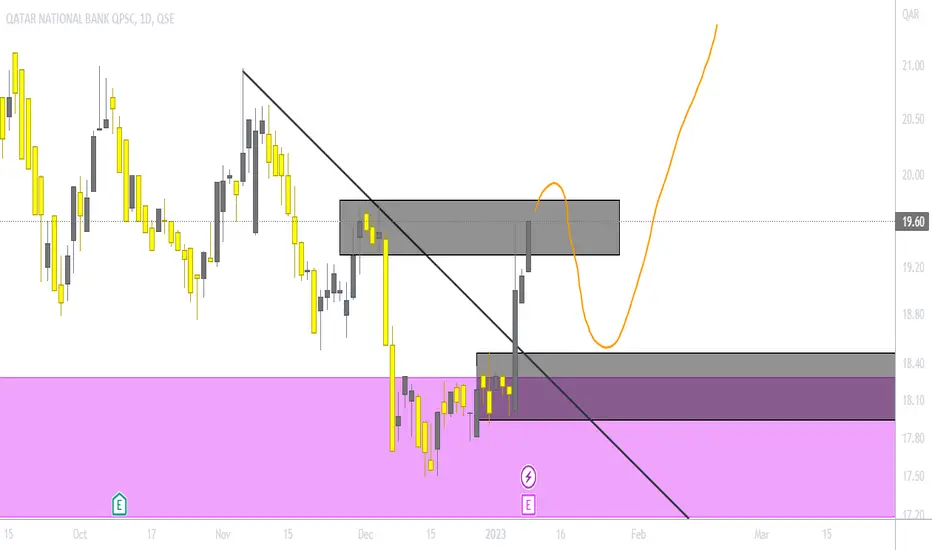
#qnbk qatar bank international ready to jump#qnbk qatar bank international after tocuhing monthly demand zone took action so its near wkly supply zone and all signs shows this demand will destroy
so wait for touch wkly new demand created or wait for daily new demand creation
wait for next move , so i will post another analyze
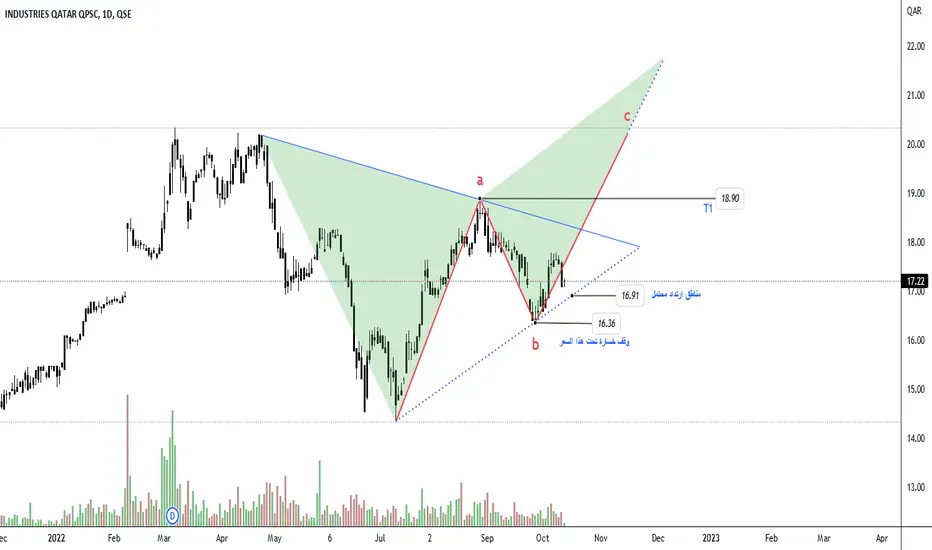
iqcdI think we are going to shift the price as shown on the chart
Activating the stop loss is important before entering the trade
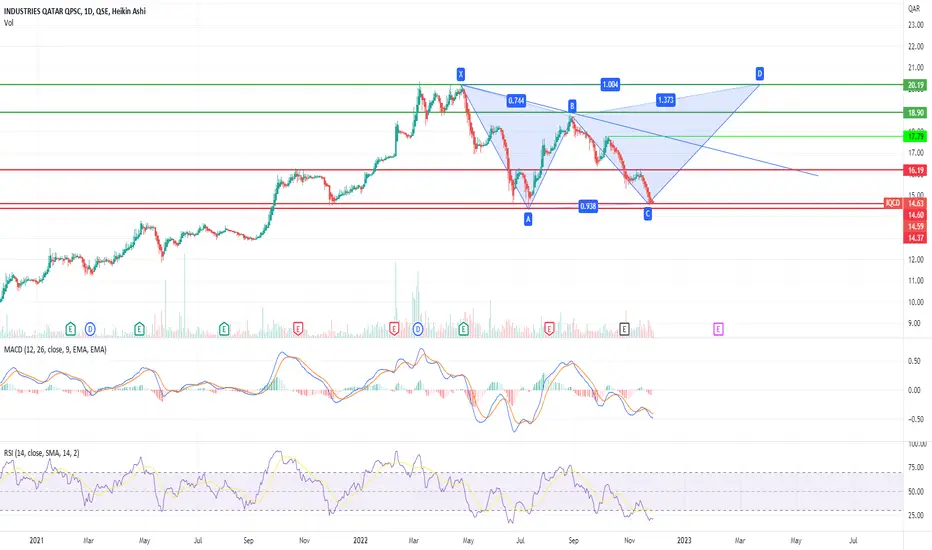
IQCD LongThere is a Double bottom pattern appare from the grapth
Stop Loss - Below 14.33
TP 1 - 16.17
TP 2 - 19
TP 3 - 20.20
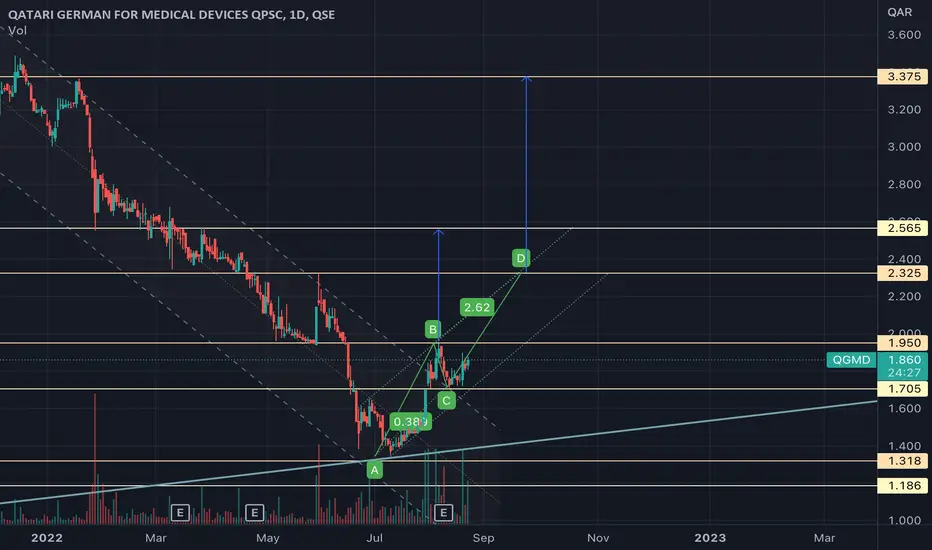
QGMD LongThe stock has broke-out above the descending channel, and made a higher high.
Activates after crossing 1.95
ABCD Harmonic Pattern Goal: 2.325
Cup and Handle Goal: 2.565
After crossing the second goal.
Mid-Term Goal: 3.375