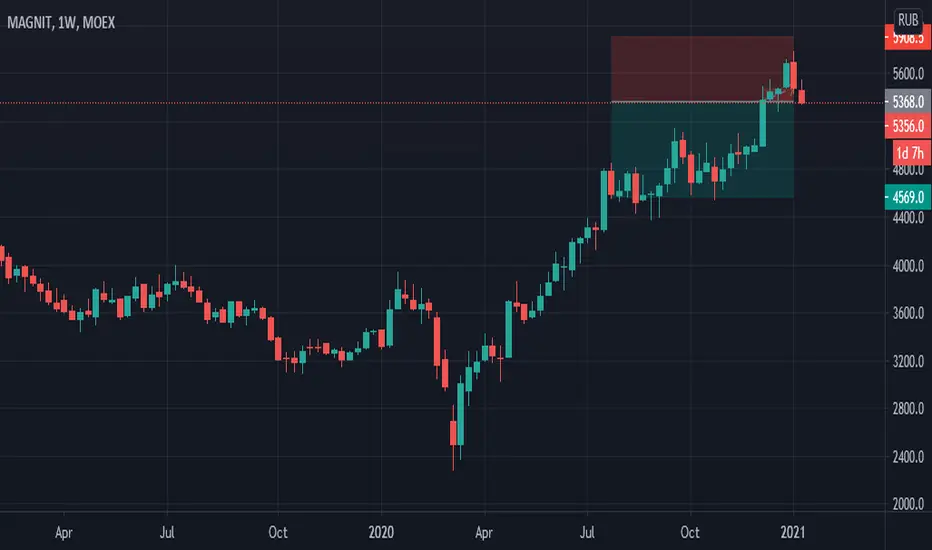
MAGNIT bearish swing to $4570One of the limits for the year has been triggered by this stock so I am short the stock. I typically close stocks based on weekly close so a weekly close above $5900 is my reason to close and potentially switch sides. This trade will be held for weeks once it goes into profit.
I got filled at 5362.50 with a SL of $5900 with a target of $4570
This is for entertainment purposes only.
Trading come with risk and you should consult a financial advisor for financial advice.
Traditional|MAIL|LongLong MAIL
Activation of the transaction only when the blue zone is fixed/broken.
The idea is to work out the local resistance level of an equilateral triangle created by the trend support level of the channel.
Attention to the area highlighted by the ellipse between the resistance of the triangle and the channel, this is an important zone because there may be strong resistance to further price growth.
*Possible closing of a trade before reaching the take/stop zone.
The "forecast" tool is used for more noticeable display of % (for the place of the usual % scale) of the price change, I do not put the date and time of the transaction, only %.
Blue zones - activation zones.
Green zones - take zones.
The red zone - the stop zone.
Working out the stop when the price returns to the level after activation + fixing in the red zone, breaking the red zone as the support level of the triangle and the channel.
Orange arrow - the direction of take.
Blue arrow - neutral scenario without activating the trade.
The red arrow - the direction of the stop.

Traditional|YNDX|Long and short *High riskLong and short YNDX
Activation of the transaction only when the blue zone is fixed/broken.
The idea is to working out the support and resistance levels of the consolidation triangle.
*Possible closing of a trade before reaching the take/stop zone.
The "forecast" tool is used for more noticeable display of % (for the place of the usual % scale) of the price change, I do not put the date and time of the transaction, only %.
Blue zones - activation zones.
Green zones - take zones.
The red zone - the stop zone.
Working out the stop when the price returns to the level after activation + fixing in the red zone, breaking the red zone as the support level of the triangle and the channel.
Orange arrow - the direction of take.
Blue arrow - neutral scenario without activating the trade.
The red arrow - the direction of the stop.


Traditional|QIWI|Long and short *High riskLong and short QIWI
Activation of the transaction only when the blue zone is fixed/broken.
Working out the support and resistance levels of the consolidation triangle, the risk of the short scenario is weak RR (risk/reward) + the general risk of the idea is high volatility, an increase in false breakouts and a weakening of the accuracy of the TA.
*Possible closing of a trade before reaching the take/stop zone.
The "forecast" tool is used for more noticeable display of % (for the place of the usual % scale) of the price change, I do not put the date and time of the transaction, only %.
The breakdown of the upper blue zone - long.
Breakdown of the lower blue zone - short.
Working out the stop when the price returns to the level after activation + fixing in the red zone.
Blue zones - activation zones.
Green zone - take zone.
Red zone - stop zone (S-SL short stop, L-SL long stop).
Orange arrows indicate the direction of the take.
Red arrows indicate the direction of the stop.

Traditional|SBER|Long and shortLong and short SBER
Activation of the transaction only when the blue zone is fixed/broken.
Working out local support and resistance levels.
The "forecast" tool is used for more noticeable display of % (for the place of the usual % scale) of the price change, I do not put the date and time of the transaction, only %.
The breakdown of the upper blue zone - long.
Breakdown of the lower blue zone - short.
Working out the stop when the price returns to the level after activation + fixing in the red zone.
Blue zones - activation zones.
Green zone - take zone.
The red zone - the stop zone.
Orange arrows indicate the direction of the take.
Red arrows indicate the direction of the stop.

Traditional|ROSN|Long and short *High riskLong and short ROSN
Activation of the transaction only when the blue zone is fixed/broken.
Testing the channel resistance level for a breakout and a rebound from this level, a high risk due to the difficulty of choosing the right stop.
The "forecast" tool is used for more noticeable display of % (for the place of the usual % scale) of the price change, I do not put the date and time of the transaction, only %.
The breakdown of the upper blue zone - long.
Breakdown of the lower blue zone - short.
Working out the stop when the price returns to the level after activation + fixing in the red zone.
Blue zones - activation zones.
Green zone - take zone.
The red zone - the stop zone.
Orange arrows indicate the direction of the take.
Red arrows indicate the direction of the stop.


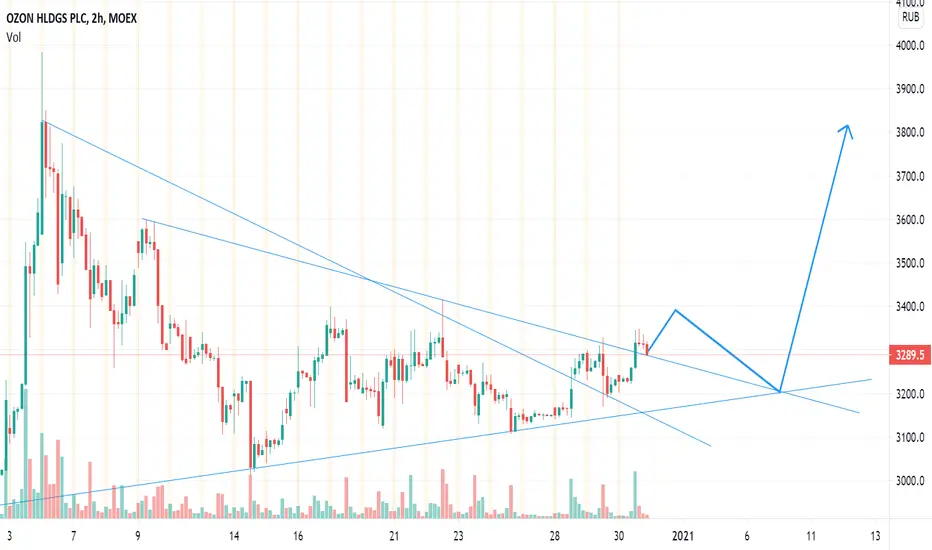
OZON LONG for a long time. Investing ideae-commerce Russian company with big potential. one of the biggest e-commerce company in Russia.
after IPO recieved 1billion dollars for developing business.
no a lot of technical marks, but 3800rur is the target for 6 monthes of 2021 y
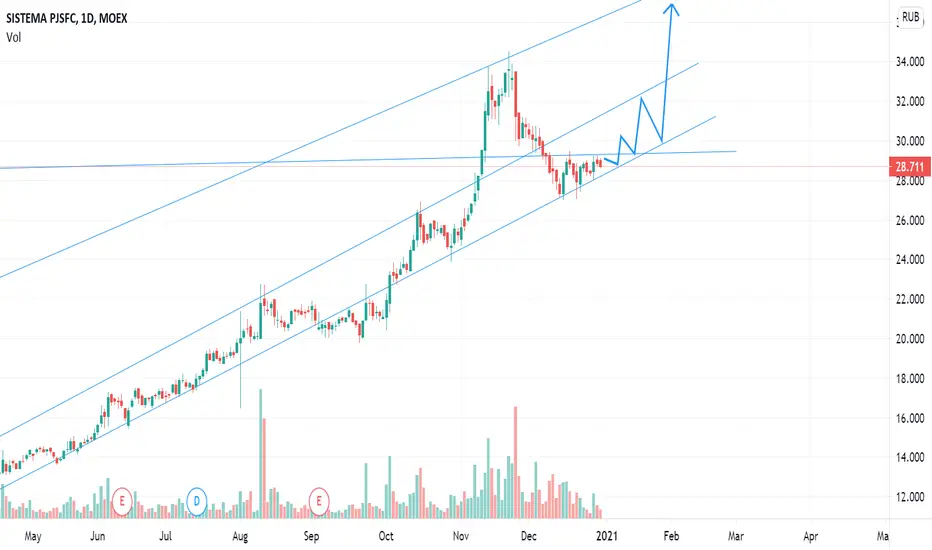
AFKS fundamental LONG. target 33rur in 2 monthsstrong company.
Potential grow 36-40 in 6-12 months (+35%)
main business:
MTSS
OZON
Segezha Group
MEDSI
Binnofarm
AGRO STEP
ETALON
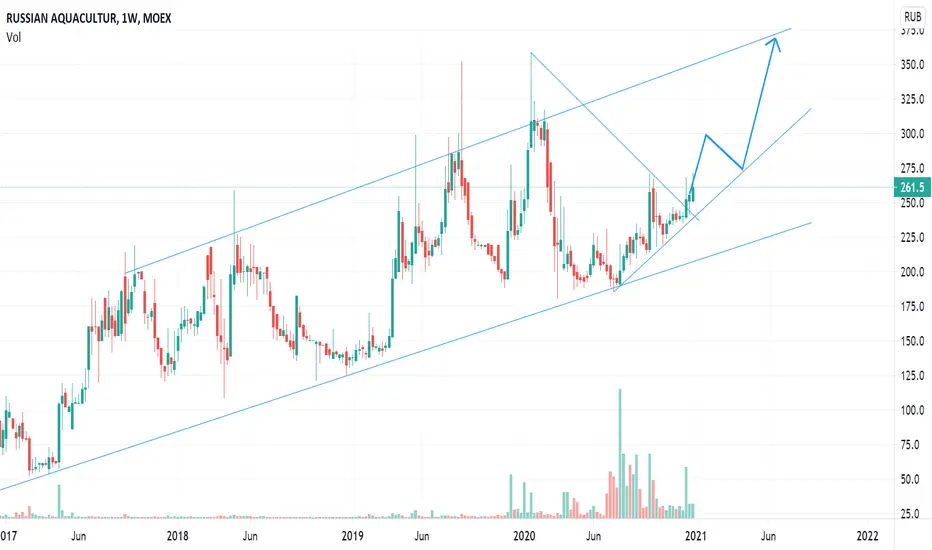
STRONG LONG AUQA up to Target 350rurstrong company with big potential. good profit and perfect EBITDA.
Fundamental target - 600rur in 2021year
LONG MTSS from local trendLONG MTSS, 5G network, Strong company. Target 345 in January , and the up way to 400 in 2021


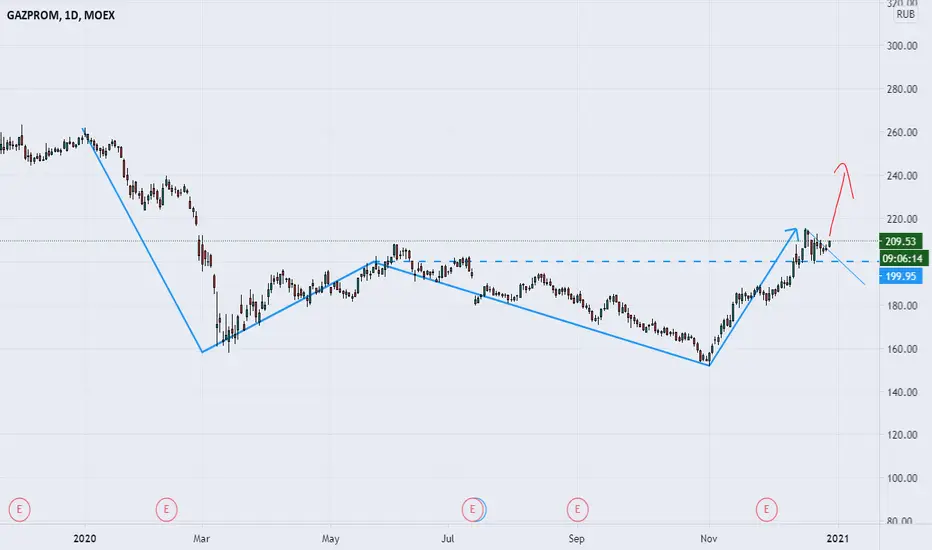

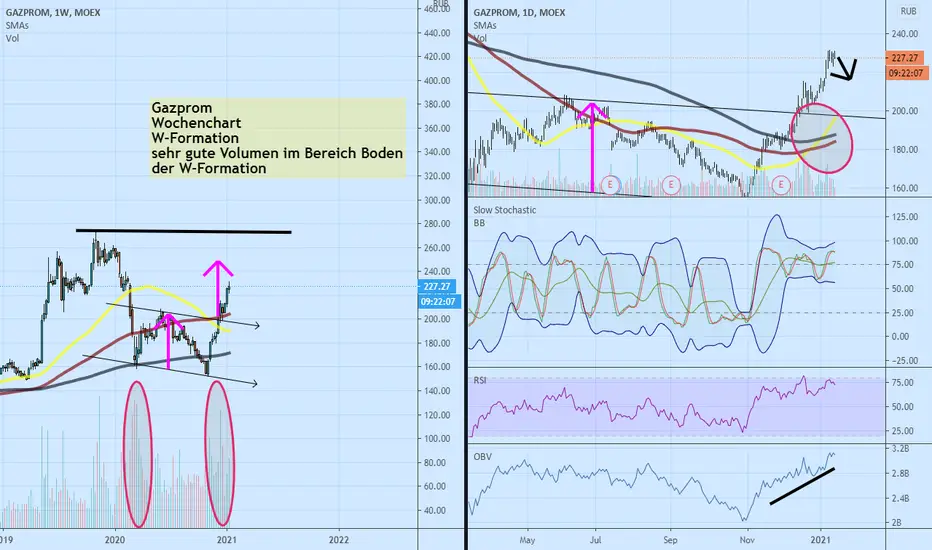
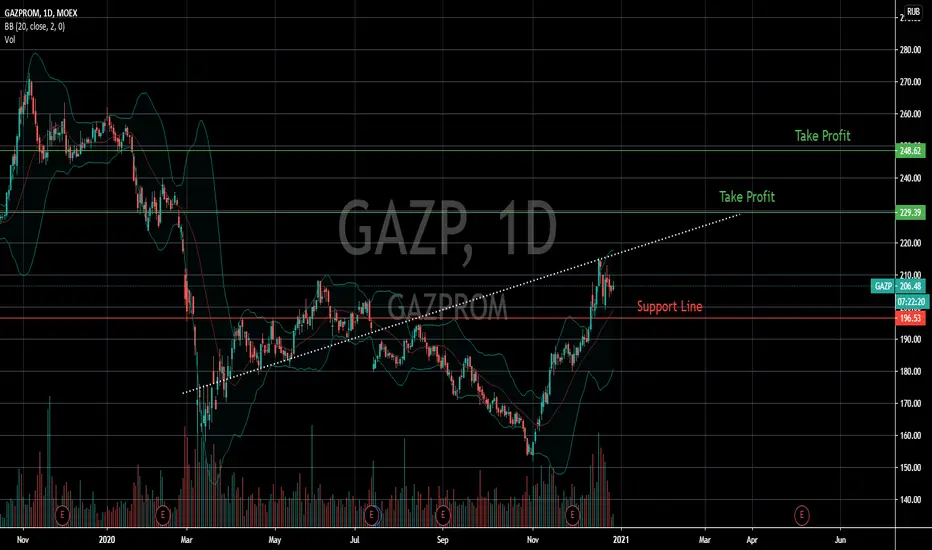
GAZPROM D1The Gazprom-Media holding has closed the deal for the purchase of a 50% stake in Roform LLC, which manages the Rutube video service. As a result, he became the owner of 100% of the company.
The holding intends to retain the team, which it considers as one of the main assets of the company, and further expand and strengthen it in order to modernize the service, according to a statement by Gazprom-Media.
From the beginning of next year, Rutube video inventory will become available for Gazprom-Media customers, and the video service will switch to the classic AVoD monetization model. Advertising on the site will be available both as independent inventory and as part of consolidation with other media. In addition, the video service library will be replenished with content from the Gazprom-Media holding. Gazprom is the largest gas supplier in Europe and Asia. The company annually supplies the largest volumes of gases to continents. During the heating season, sales grow significantly, because gas costs go not only to the industrial zone but also to heating the residential and commercial sectors. Large cash registers at this time are very good at stimulating the company's stock to grow. Given that the fall in the market during the pandemic was quite significant, the asset now has a wonderful entry point and huge growth prospects.
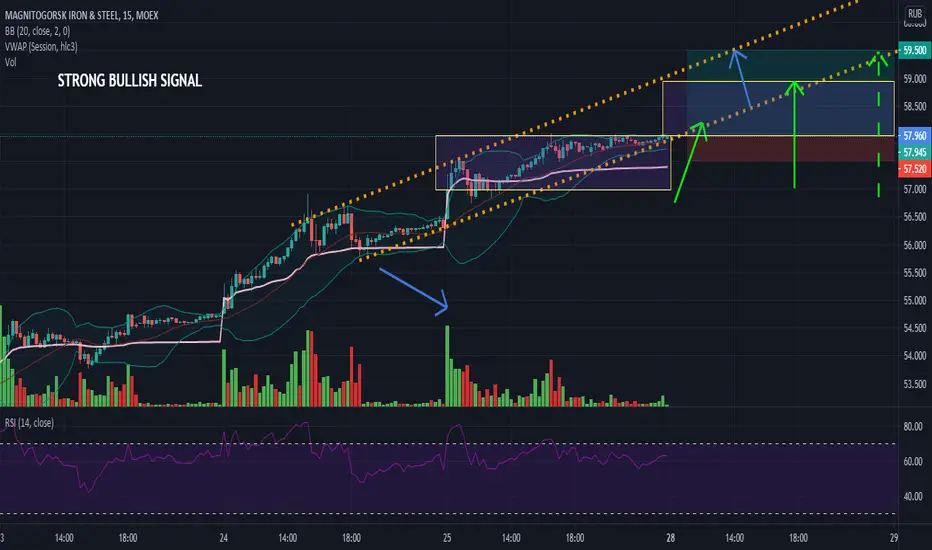
MAGNITOGORSK IRON & STEEL Course Hey guys, MAGNITOGORSK IRON & STEEL is in a great historical moment we are going to witness a new high in its history. It is in a bullish push with low buying volume, then high early trading volume to confirm the rise and a hammer candle shape. On the TIMEFRME M1 we see a kind of hammer candle with a purchase volume feedback issued, it goes towards the top for a new test of the equilibrium zone. Big possibility of breaking out the price at the same time the zone to access another and go for a new historical high.
Then go to the top of the equilbre zone for test and breakout with thereafter a symbolic number of 59,000 to go test the top of the bullish channel.
Please LIKE & FOLLOW, thank you!
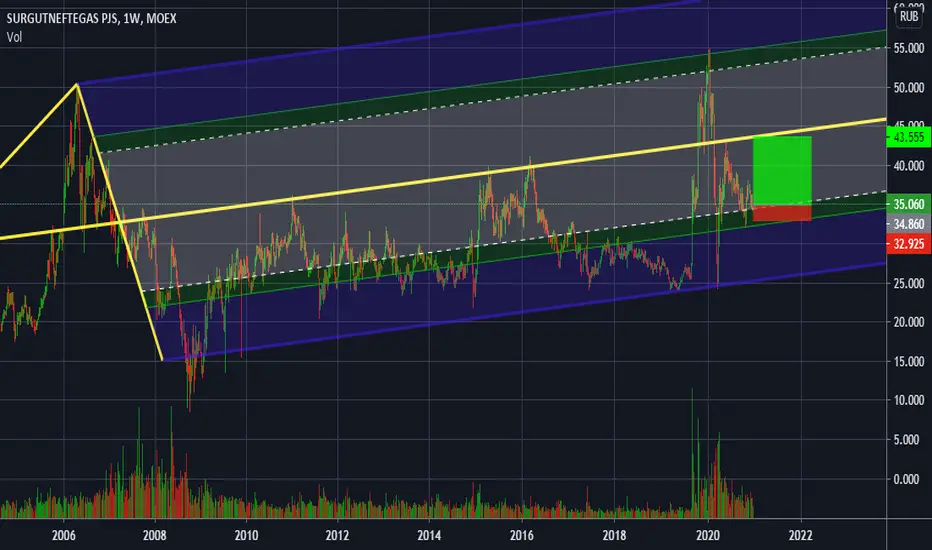

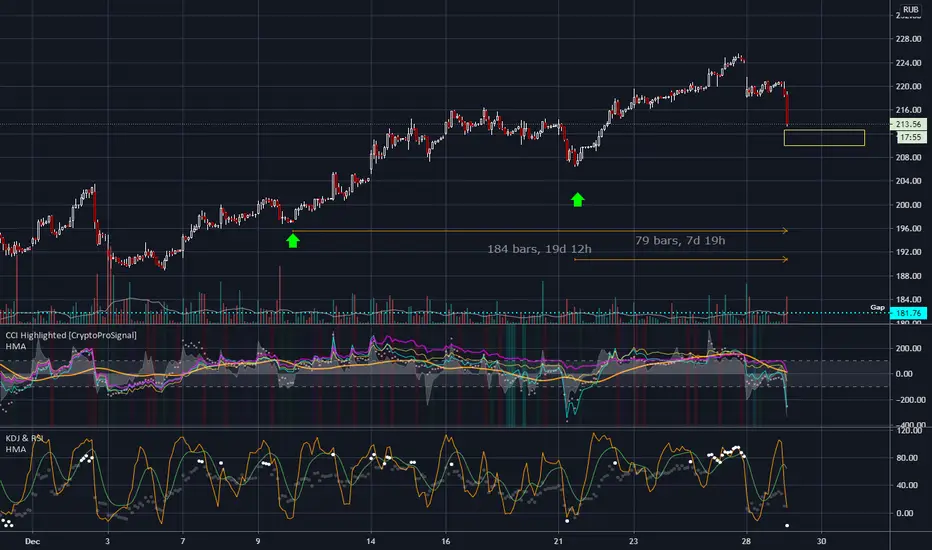
Long after retraceExperimental!
Near 2std of anchored vwap. Divergences.
May yet reach lower, but nice for long-term buy anyway.

FSK EES Strategy Hey traders, FSK EES is in a bullish push with large volume traded especially buy ending on sell volume and a hammer candle shape. The TIMEFRAME shows us a marubozu with a low volume of purchase made, it leaves on its top of the equilibrium zone and a possibly test of this one. Great potential to breakout the price then at the same time the zone to arrive in the next one and go to the next high (See TIMEFRAME H1). With higher just after (View on TIMEFRAME H4) before breakout of the equilibrium zone to go to test the following high then the bullish channel.
Please LIKE & FOLLOW, thank you!
