RUSAL - a good time to buyIt is probably a good time to buy RUAL as US lifts sactions!
This should attract a lot of investors.
RUAL
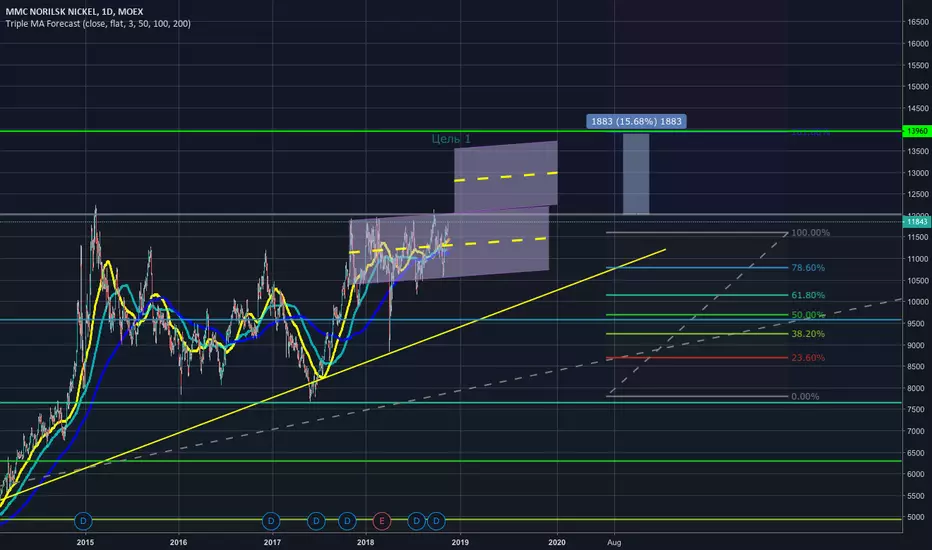
WATCHING THE TITAN NORILSK NICKELWhat do we have?
1. The price of MOEX:GMKN is at the upper limits of the maximum of 12,000 rubles.
2. The indicators feel calm, RSI is coming to the top mark.
3. In General, the chart looks very bullish since 2008.
Conclusion:
1. Breaking through the 12,000 level the price is likely to go up to the Fibonacci extension of 161.8, which corresponds to 13960 RUB per share.
2. Goal 13960 is confirmed by the next expansion of the flag in which the stock is traded since October 2017 (according to the rules of technical analysis, the exit from the flag is equal to its height).
Recommendation:
1. Put an alert at 11950 rubles., when the price reach this level important to foothold by the daily candle and then get up in the long and take your profit at 13960 rubles. (About 16% profit).
2. If we reaching 12000 RUB. and the rollback to the area of 11500 rubles, up in shorts to RUB 10715 level (since the price will continue to move in the flag).
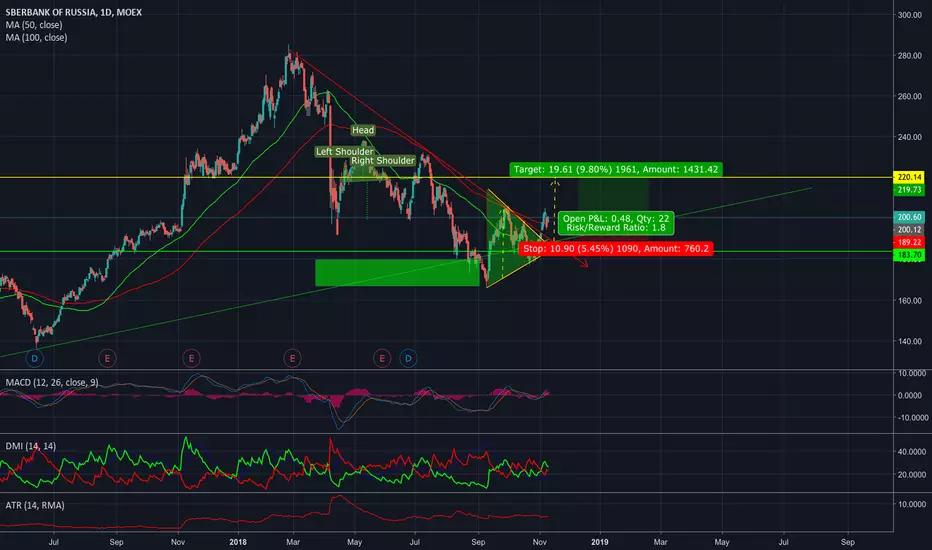
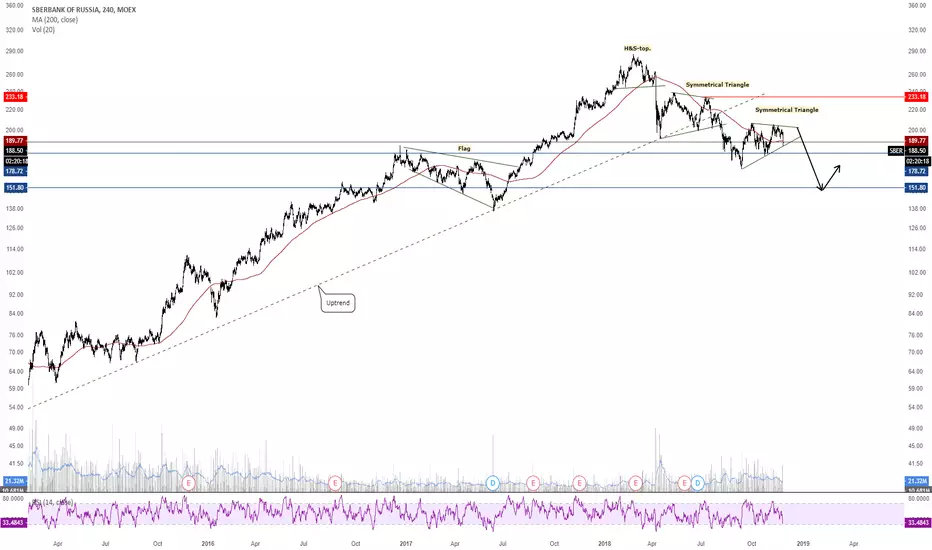
SBERBANK - ON THE WAY TO 220Last recommendation for MOEX:SBER worked at 100% (see below description), below is a new idea.
What do we have?
1. Broke up the line of price resistance, which was established in January 2018 (the red line)
2. Came up from the consolidating price triangle. (green triangle)
3. We pushed off the price support line formed in 2015(green line)
Conclusion:
In view of the above factors, most likely, the price of Sberbank shares will go up to the level of 220 rubles. (at this level, the previous support line and the zone of price exit from the wide part of the triangle were designated).
Trade recommendation:
Buy shares MOEX:SBER on the market and sell at the level of 220 rubles. (10% profit). Stop loss at 189 rubles (5.45% loss).
Chuvashov's fork and channel bounce$LKOH 4H has broken and retested Chuvashov's fork (orange line) after the bounces from the top of the trend channel. Expecting further downside to the bottom of the channel or lower, if megaphone formation plays out.


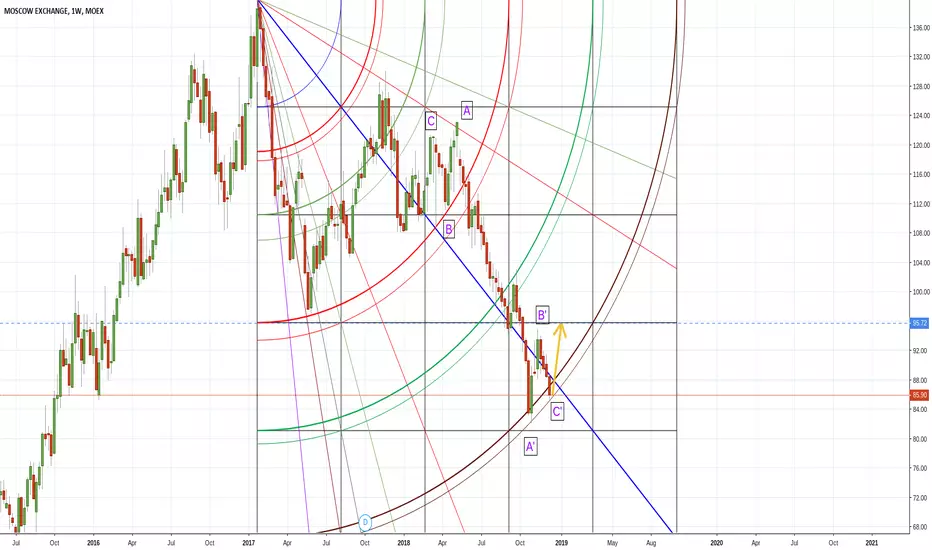
RUS SBERBANK: Waiting for better time.Following on US sanctions Sberbank shares are slipping towards Jan 17 lows. It seems preferable to wait for better times

Possible $SBERBANK short scenarioPossible SBERBANK short scenario from next week (11.11) and ~210 level till April 2019 and ~113 level
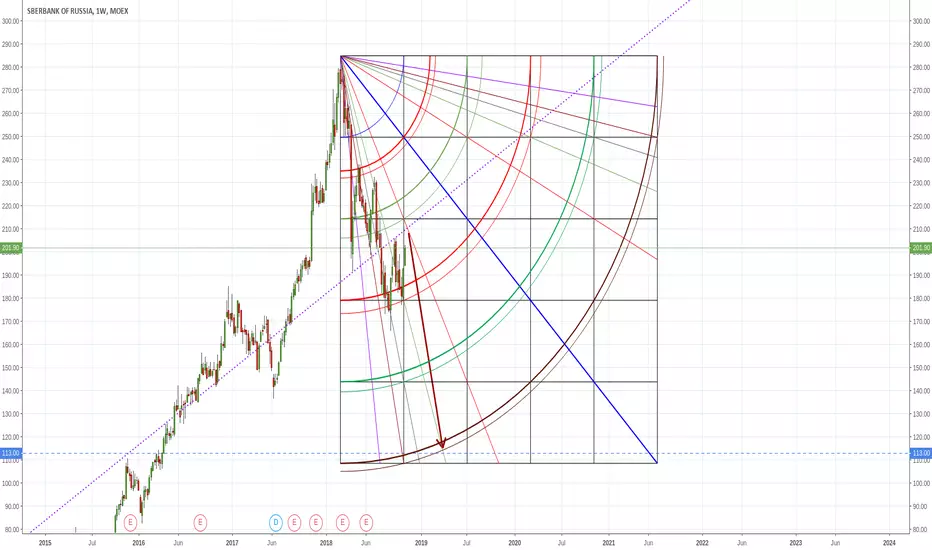

Looks like shorting SBER here is a bad idea3rd arcs pair and bottom of square of down setup providing solid support.

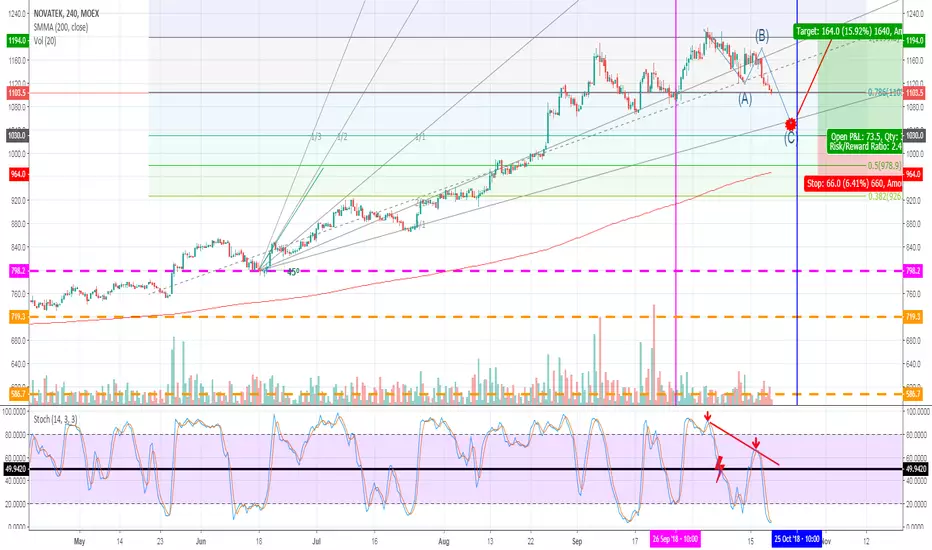
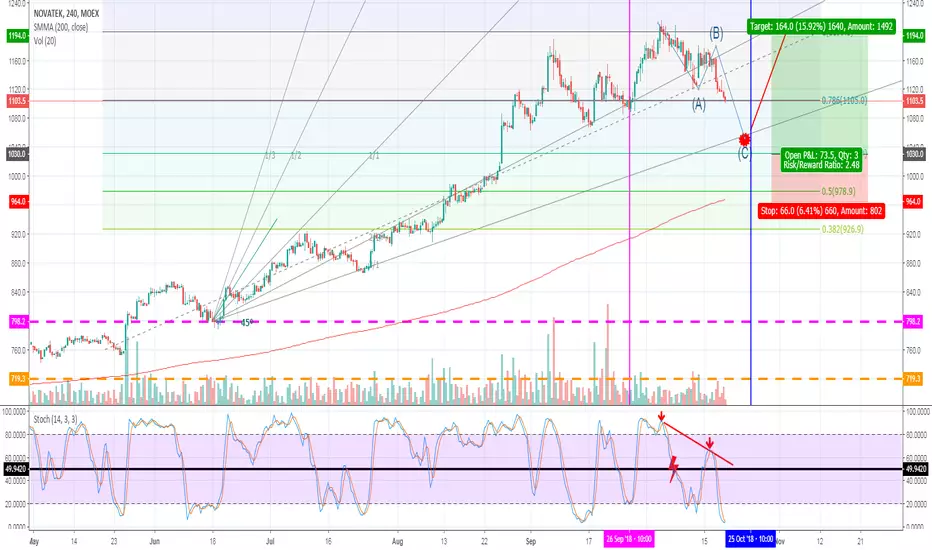
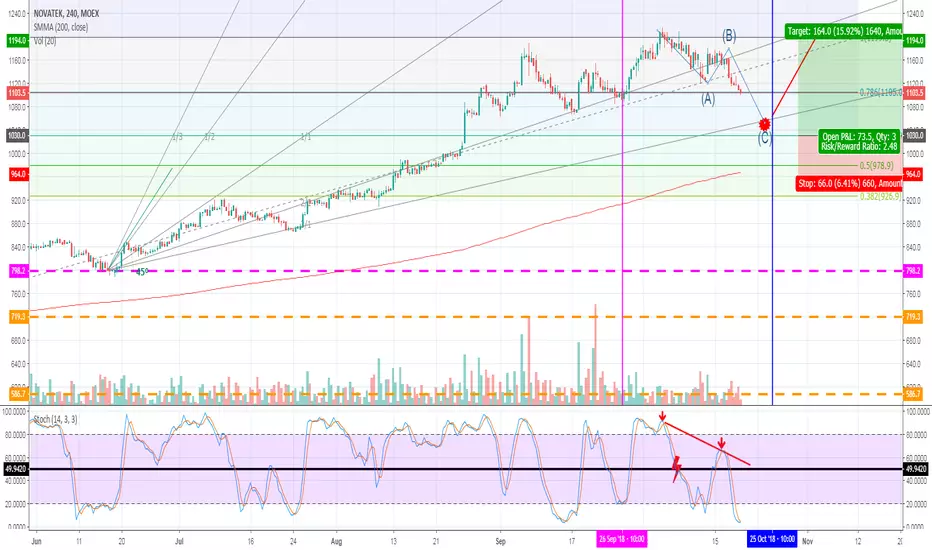
Novatek. October- November. Plan to doWeekly Novatek.
Uptrend, however slight changes in volumes.
RSI in overbought zone, but still no lower than 50, which is OK if its uptrend.
For me it was a test of psychological barrier of 1200.
O n Daily
RSI lower than 50
Convergnce with chart
No proper volumes
I exprect falling to Gann Level and Fibo 0.618 (Red Point)
4H
Here i analyze by Stochastic due to weakened trend.
Again I see divergence on stochastic, which makes lower low.
To recap with the usage of Gann waves 1/1 1/2 2/1 and Fibo I found crossovers.
Now the price works in Elliot Correction waves after fast moving up.
Due to breakage of Gann 1/1 i assume price movement from B to C -1050.
On C the gann level will be tested and rebounded back to 1/1.
The rebound to 1/1 is inescapable because of strong uptrend on W and D.
Maybe price will break Fibo 0.618 and drop on Fibo 0.5, then the uptrend will start from 985
I will open long from C ( 1030) with SL 960 and TP 1190
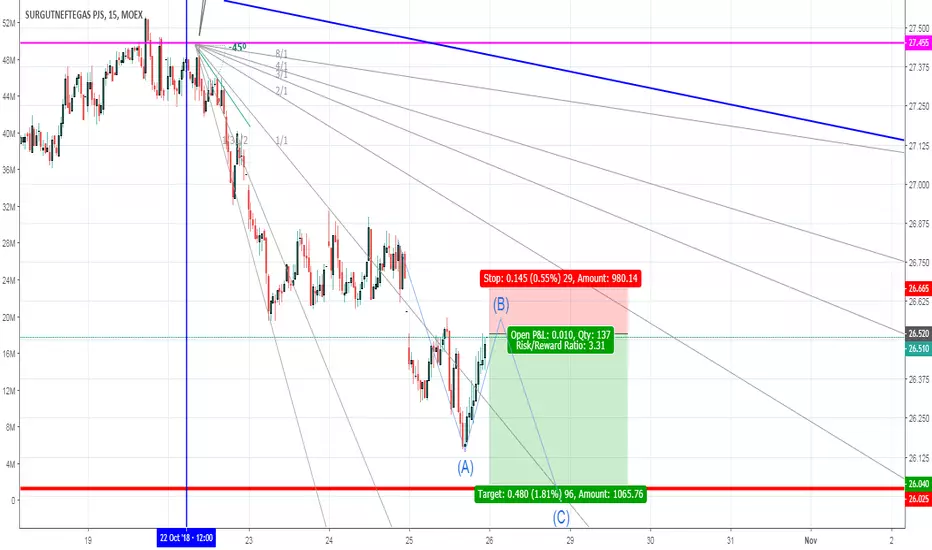
Surgut fallingWeekly
Flat, suppose to be long
Very strong old support on 24
Daily
Flat with slightly lowering price
Support on 26
4H
Downtrend, weak, assume low volumes.
All going to test 26 - psychological level
RSI convergnece down
Volumes bearish
1H
Since 22 of October power downtrend
RSI oversold. No higher than 50.
Stohastic also shown true oversold.
Seems it is a power trend which could brake 26.
On Gann price in downtrend, however successfully tested 1\1
30min and 15 min
Bearish bars have more power and look aggressive.
Now the pullback is going to end. Here I place entry
Considering short
ENTRY 26.550
SL 26.700
TP 26.040
RR 3.30

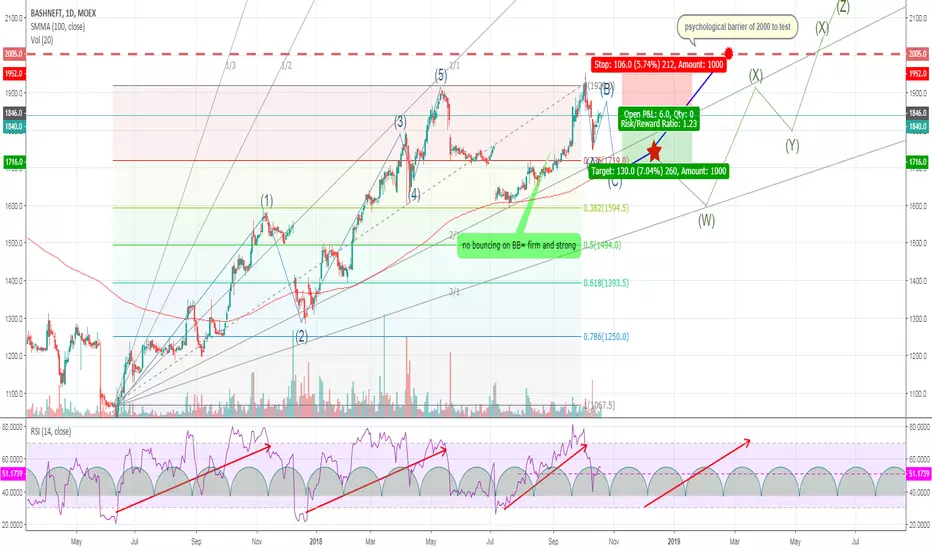
Bashneft - instruction to use. Short and get ready to test 2000Weekly.
high volatile during all chart
From the 2nd Half of 2016 Volumes increased.
Major uptrend started from August of 2017 after remarkable declining.
No Divergence on volumes = trend does not waste power completely.
No divergence on RSI.
Resistance level is unclear.
On RSI clear bullish trend. Did not cross level of 50 - confirmation of having power.
Above 100 SMA
Daily
The price approached level of 1720 - supportive, it has to be tested for breakdown after gap.
+ near SMA 100.
On RSI , strond uptrend seems to lost some steam, jumps lower than 50 on RSI
No volume changes = trend not so active., but exists.
I see harami candlestick - sign of uncertainty.
BB shows good power of uptrends.
No sign of nearest reversals, just correction
Considering trends on RSI, its clear for me - they became shorter,
frequency slightly reduced, however the angle still same.
Using that i expect the rest of price for a moment.
Elliot correction of ABC is ongoing = rest.
The lenght of rest zone = 1,5-2 intervals,
When rest zone is ended that will be the 3 uptrend aimed to test 2000 level.
Finally, the critical point foe me is how the price will act after star.
Do not want to go for some super long term bets.
For now, it is better to short due to rest of market, and work in elliot correction B-C
I propose open short with SL 1955 and TP 1720. RR 1.23
But in whole picture on W, seems that SuperCycle of Uptrend lowers, and probably the chart will finish formashion of head and shoulders and then goes to 2000
Trading Novatek. Forecast on October and November of 2018Novatek.
WEEKLY
Uptrend, however slight changes in volumes.
RSI in overbought zone, but still no lower than 50, which is OK if its uptrend.
For me it was a test of psychological barrier of 1200.
Daily
RSI lower than 50
Convergnce with chart
No proper volumes to confirm trend continuation
I exprect falling to Gann Level and Fibo 0.618 (Red Point)
4H
Here i analyze by Stochastic due to weakened trend.
Again I see divergence on stochastic, which makes lower high.
Now the price works in Elliot Correction waves after fast moving up.
Due to breakage of Gann 1/1 i assume price movement from B to C -1050.
On C the gann level will be tested and rebounded back to 1/1.
The rebound of 1/1 is inescapable because of strong uptrend that we have on W and D.
the price will be reinforced by main trend and goes higher.
Maybe price will break Fibo 0.618 and drop on Fibo 0.5, nothing critical , then the uptrend will start from 985
I will open long from C ( 1030) with SL 960 and TP 1190