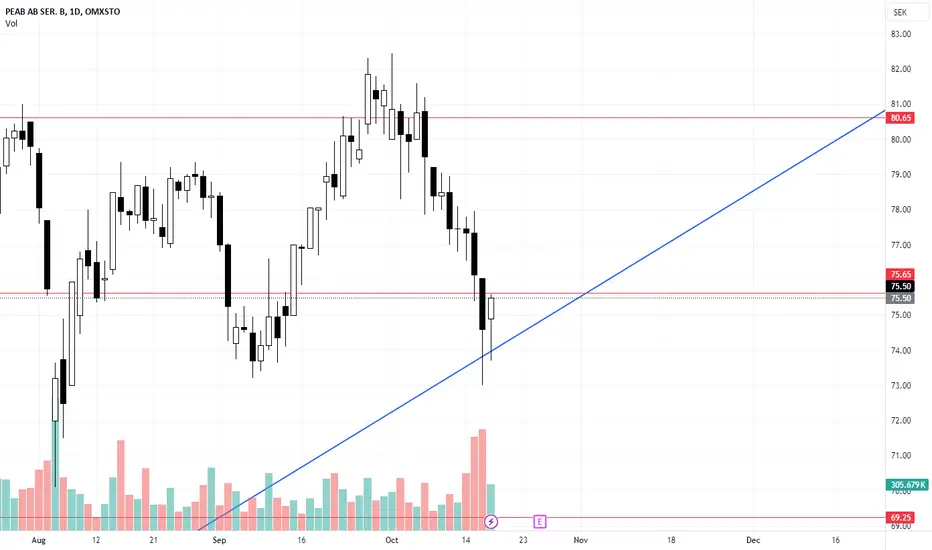
The Bullish HaramiPeab The Bullish Harami play. 50% upside.
Peab is showing us an The Bullish Harami in the daily chart. If we can break thru resistence we can make a run for a 50% upside!
The idea is to play this if Peab B reach 75.65 we buy long.
What is a bullish harami?
A bullish harami is a candlestick chart indicator used for spotting reversals in a bear trend. It is generally indicated by a small increase in price (signified by a white candle) that can be contained within the given equity's downward price movement (signified by black candles) from the past couple of days.
Peab is a leading Nordic construction and civil engineering company that also specializes in road paving. Known for its commitment to sustainable development and innovation, Peab has a strong portfolio that includes residential, commercial, and infrastructure projects. The company has demonstrated consistent growth and profitability, thanks to its focus on quality, a skilled workforce, and strategic investments in technology. As demand for sustainable building solutions and infrastructure, including road maintenance and paving, continues to rise, Peab is well-positioned for future success.
Disclaimer: Not Financial Advice
The information provided here is for informational purposes only and should not be considered financial advice. We strongly encourage you to conduct your own research and consult with a qualified financial professional before making any financial decisions. Ultimately, the responsibility for any investment choices lies with you.
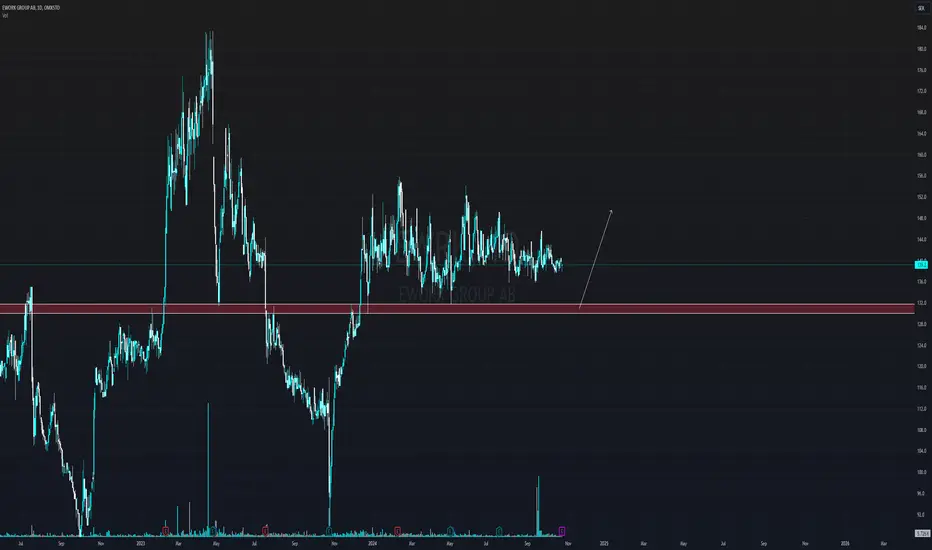
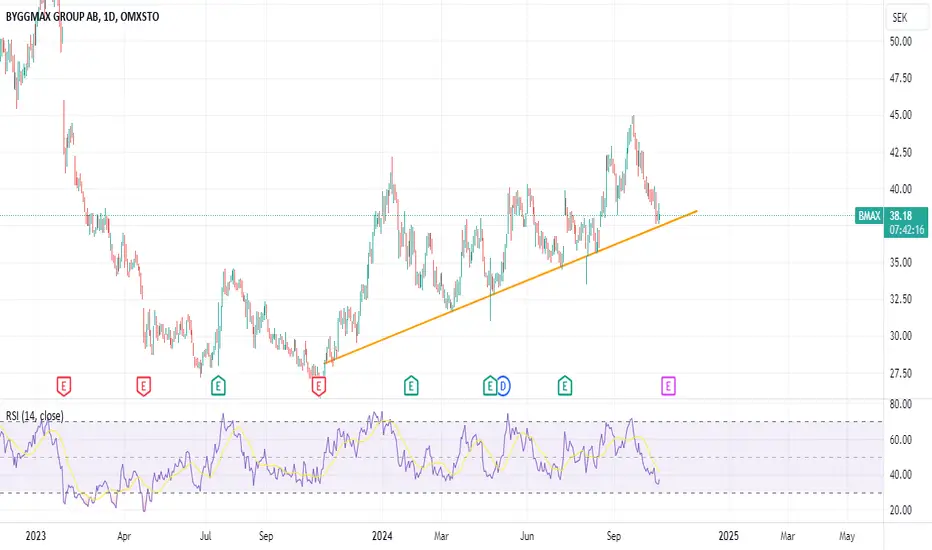
Byggmax trending upByggmax benefits from lower interest rates and increased housing transactions. More homes change hands and renovations and conversions will increase.
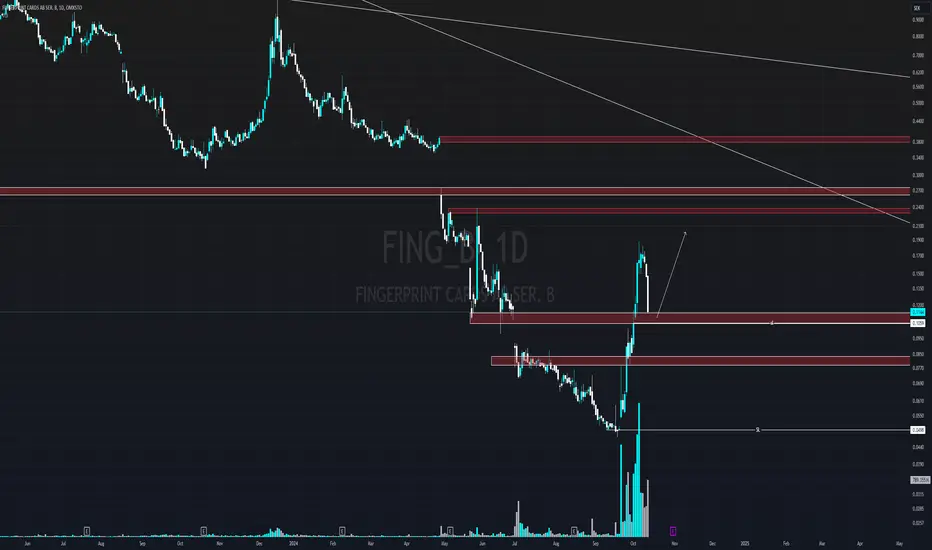
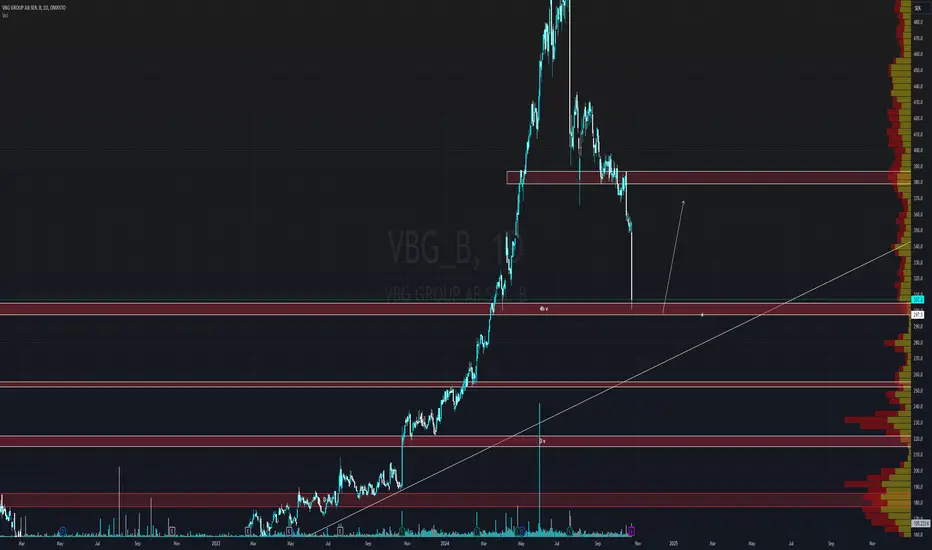
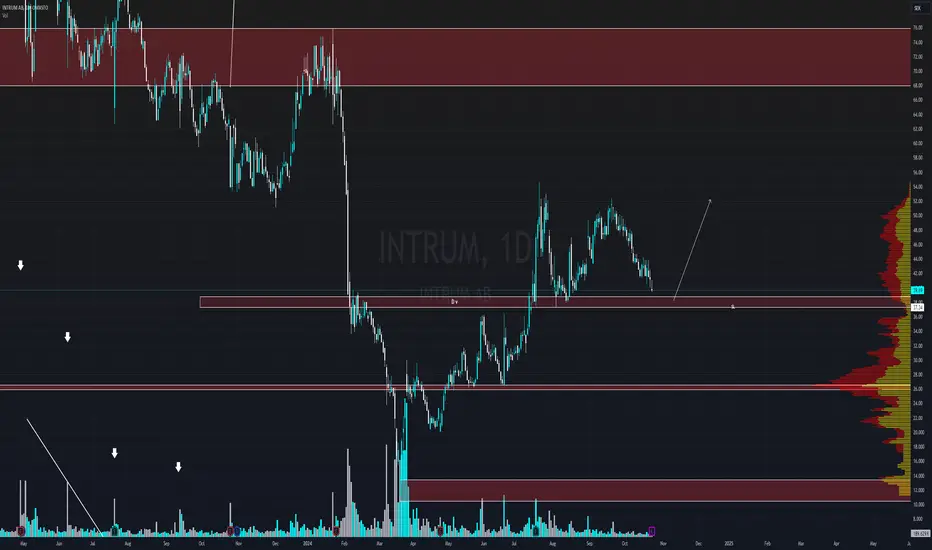
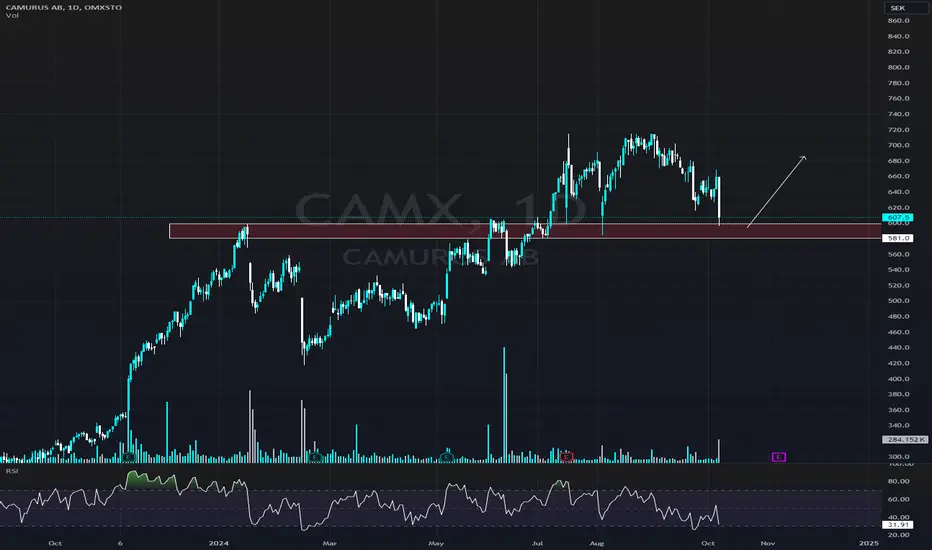
$CAMXI like what I see and will try going long here, but remember that it has tested this level a few times = weaker support.
stopploss = 580 (dayclose under)
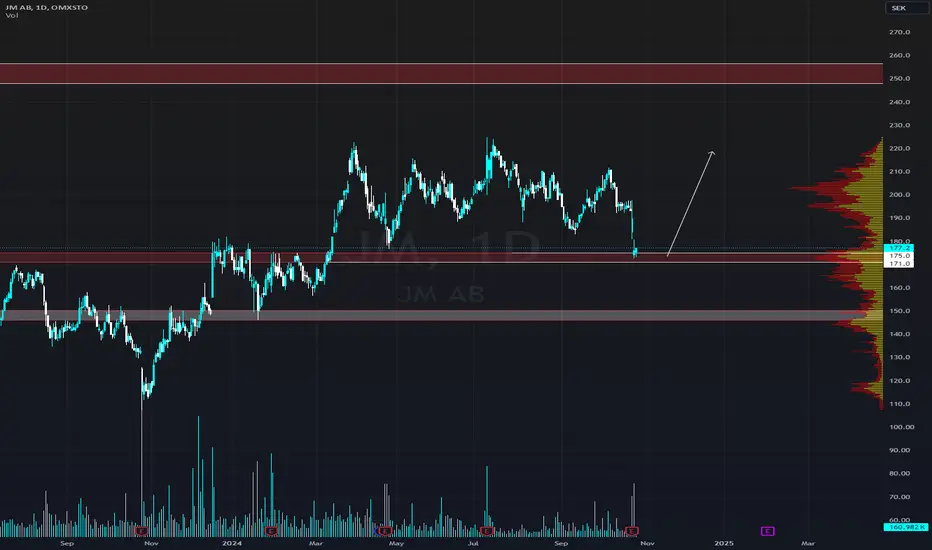
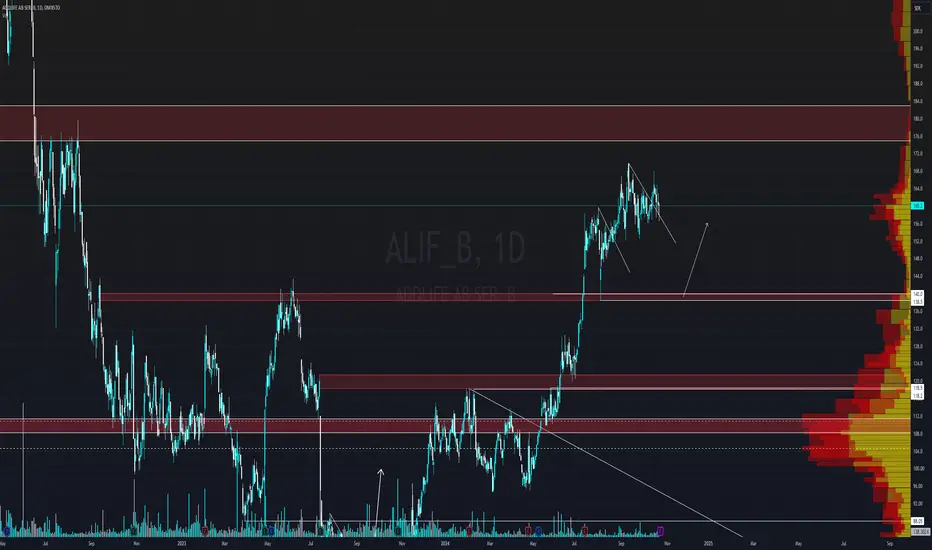
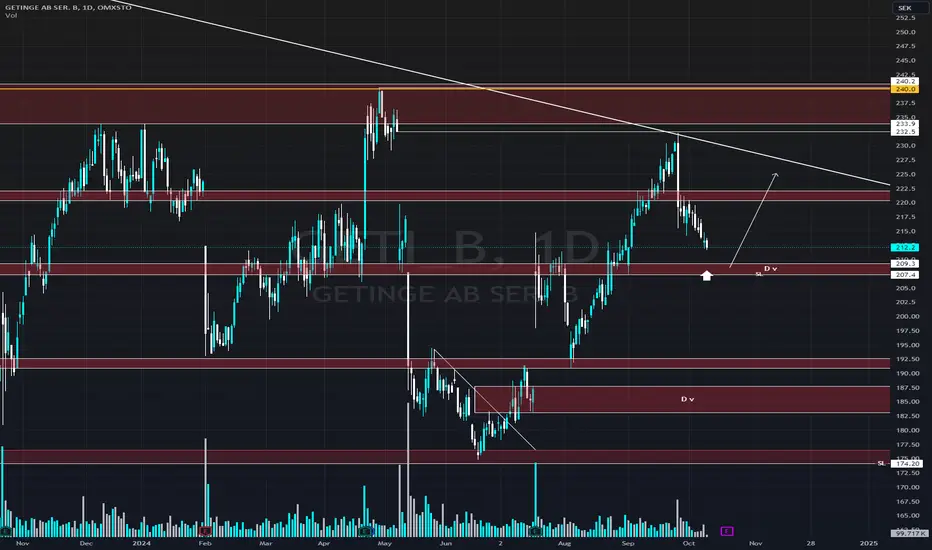
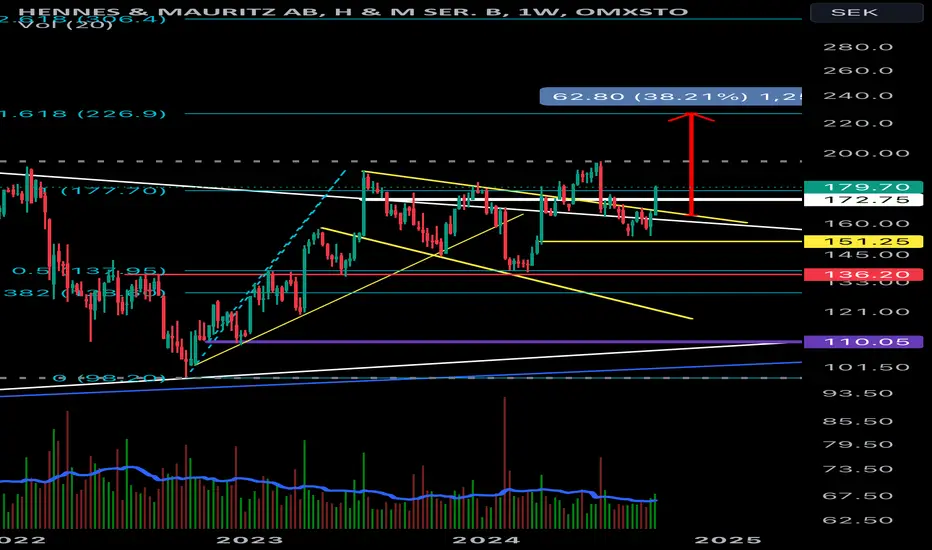
HMI have been waiting for this move for a long time I see no other good reason to add as long as the ullflagg is intact. 225 is my diet target
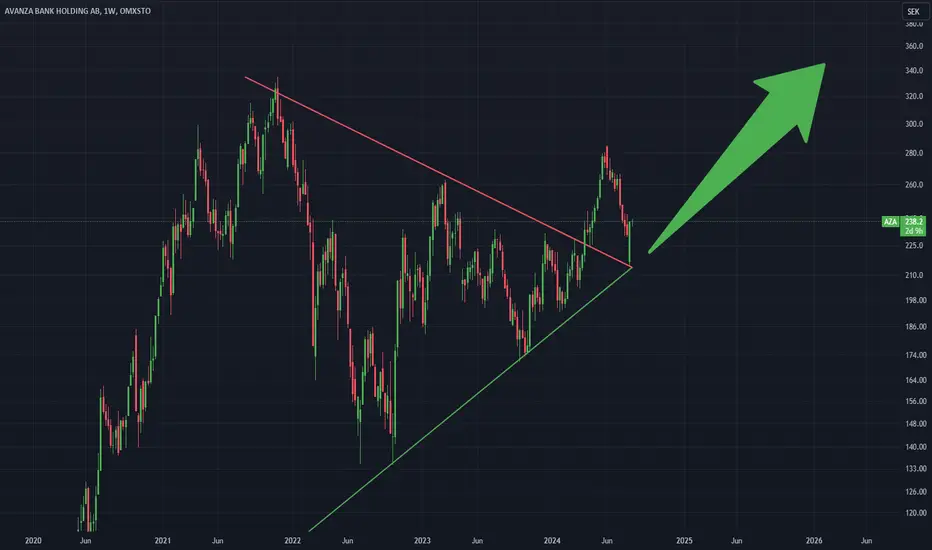
Avanza Breakout: Analyzing the Uptrend and RetestLong-Term Trend Analysis
Since its IPO, Avanza has demonstrated a clear uptrend, consistently forming higher highs and higher lows, reflecting a strong bullish sentiment over the long term.
Recent Price Action (Weekly Timeframe)
On the weekly timeframe, a triangle pattern emerged, which has recently broken out. The price then retraced, suggesting a potential retest of the previous resistance level, which could now act as support.
Retest and Key Levels
The recent retracement appears to be a successful retest of the previous triangle pattern's resistance. This successful retest often signals a continuation of the upward trend.
Examining further, we can see that the previous triangle pattern has now become a critical area for retests, followed by strong upward reactions. This supports the idea that the recent move down was indeed a successful retest.
Fibonacci Retracement Analysis
Using the Fibonacci retracement tool, the stock's recent reversal aligns perfectly with the 0.618 level, reinforcing its significance as a key support level. This level is often considered a strong area of support in uptrends.
Outlook and Potential Patterns
After analyzing the chart for patterns and key levels, we can anticipate potential future movements. A key level has been identified, which the stock has respected multiple times. This level could play a crucial role in forming a reversal pattern.
Two scenarios could unfold:
Inverse Head and Shoulders Pattern: The stock could form an inverse head and shoulders pattern, using the key support level as its neckline.
Double Bottom Formation: Alternatively, a double bottom pattern could emerge at the key support level, signaling a strong reversal.
Trading Strategy
To capitalize on this setup:
Conservative Approach: Wait for a clear reversal pattern (like the inverse head and shoulders or double bottom) to form before entering a position. This approach minimizes risk by confirming the trend direction, set a stop loss top minimaze risk.
Aggressive Approach: If you believe the stock doesn't require a full reversal pattern, consider entering now. In this case, setting a stop loss just below the key support level is crucial to minimize potential losses.
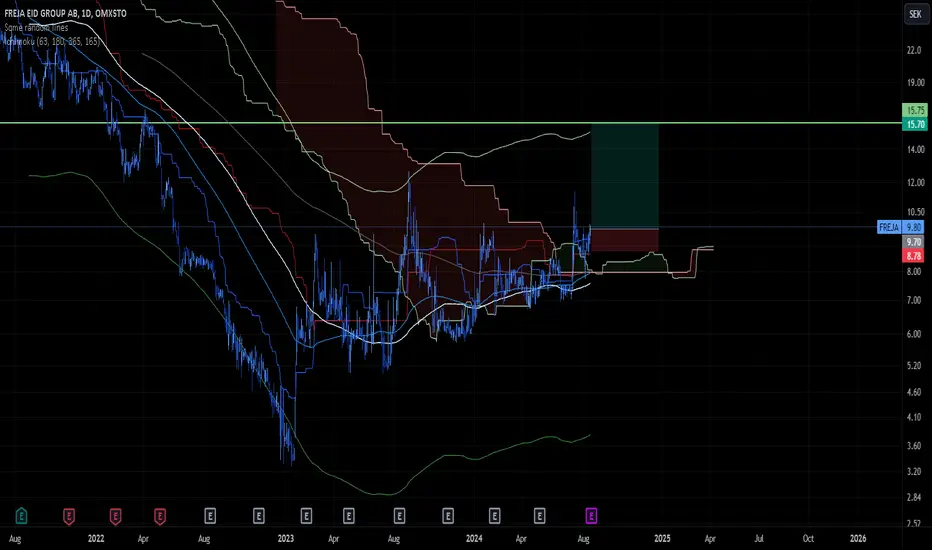
Small bet on second EID providerFreja EID provides EID in a environment where using multiple EID becomes more popular. I would not be surprised to see using several EIDs for different purposes becomes recommended by public instances and institutions, if not a requirement, in the near future.
Earnings report tomorrow.