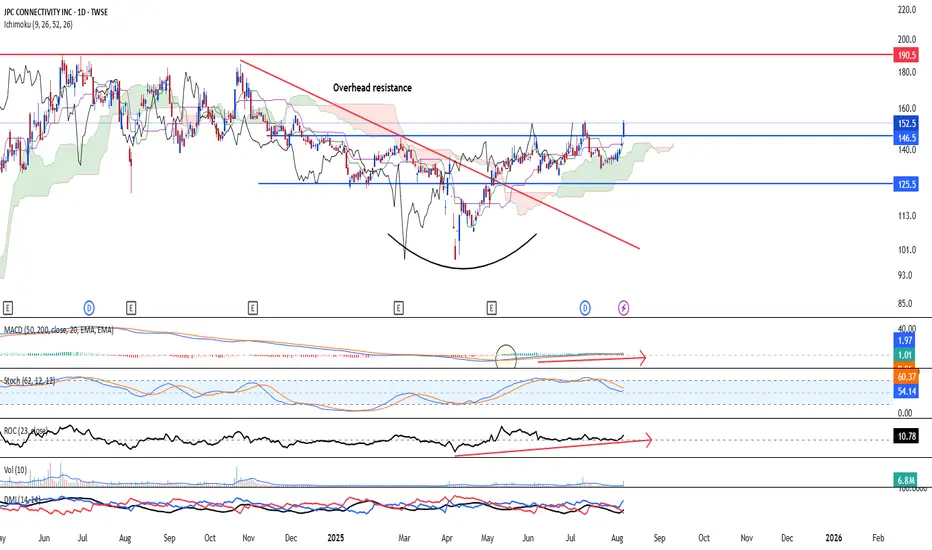
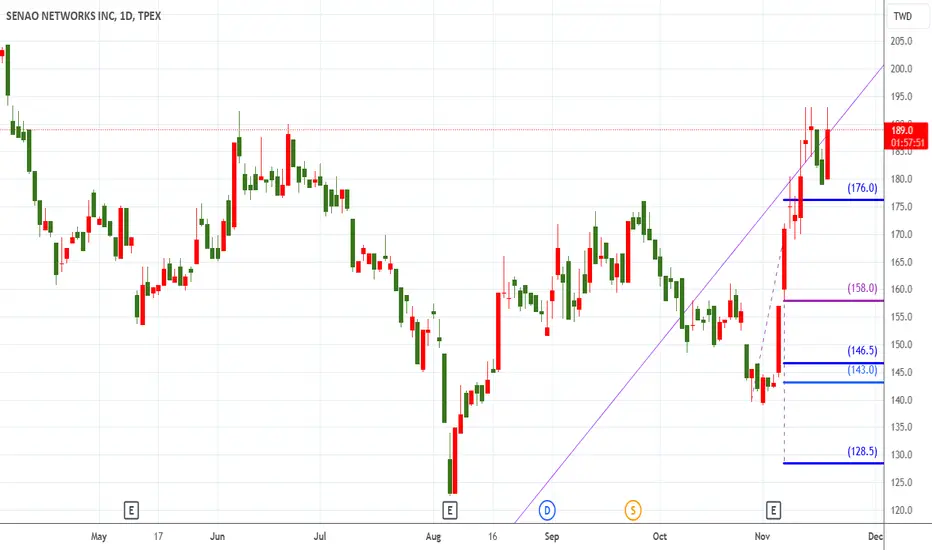
Bullish trend has returnedJPC CONNECTIVITY INC (6197. TT) is looking at a potential resumption of the uptrend after price action indicates a strong bullish break above the intermediate downtrend line and it has successfully cleared above the resistance at 146.50. We believe further upside is likely to continue as long-term MACD’s histogram remained positive and its signal/MACD line remained elevated above the zero line. Volume is also in a healthy position. Ichimoku shows a clear bullish signal. Short-term target is at 190.50 while long-term target is at 235.00. Support to accumulate on pullback is at 125.50.
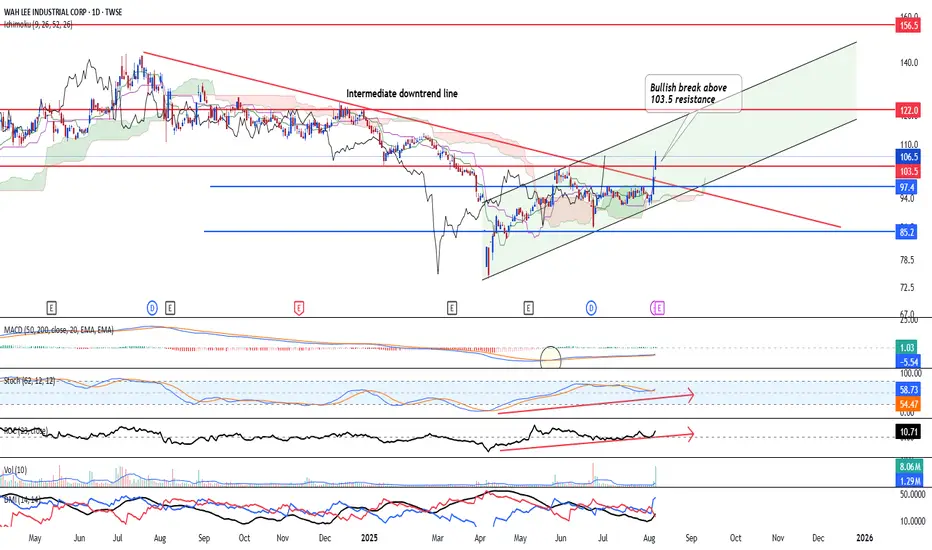
Clear breakout from intermediate downtrendWAH LEE INDUSTRIAL CORP (3010. TT) is looking at a potential resumption of the uptrend after price action indicates a strong bullish break above the downtrend line and it has successfully cleared above the resistance at 103.50. We believe further upside is likely to continue as long-term MACD’s histogram remained positive and its signal/MACD line has risen steadily. Volume is also in a healthy position. Ichimoku shows a clear bullish signal and all indicators are sloping up. Short-term target is at 130.00 while long-term target is at 170.00. Support to accumulate on pullback is at 93.30.
Bullish trend to continueCHUNGHWA PRECISION TEST TECH CO LTD TPEX:6510 has broken out of the larger symmetrical triangle which spans from 1 Aug 25 and latest break above the pennant coupling with a break above 922 resistance has confirmed the bullish trend continuation. We believe further upside is likely to continue as long-term MACD’s histogram has turned positive and its signal/MACD line remained elevated above the zero line. Stochastic has confirmed the oversold crossover. Volume is also in a healthy position. Ichimoku shows a clear bullish signal. Short-term target is at 1,130 while long-term target is at 1,350. Support to accumulate on pullback is at 773.

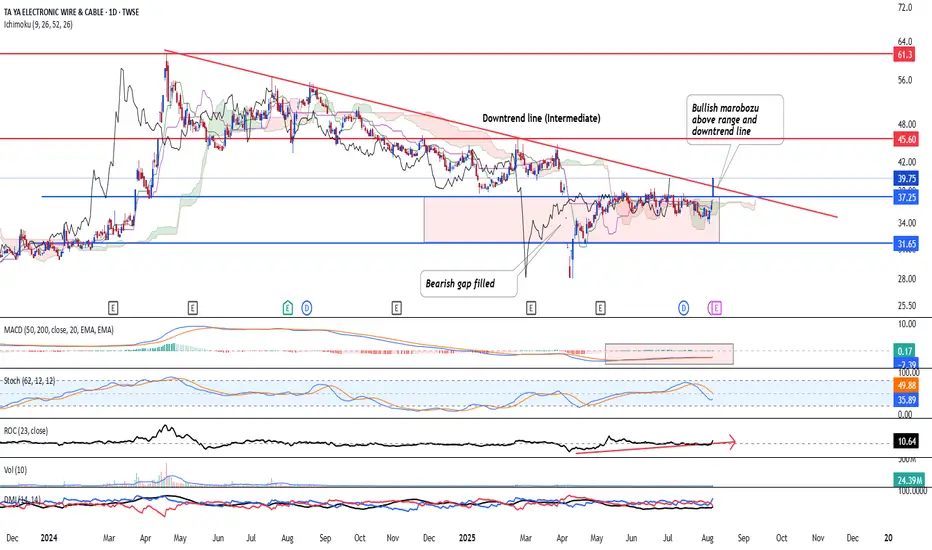
Clear breakout from intermediate downtrendTA YA ELECTRONIC WIRE & CABLE TWSE:1609 is looking at a potential resumption of the uptrend after price action indicates a strong bullish break above the downtrend line and it has successfully cleared above the bearish gap zone which occurs on 10 Apr 25. We believe further upside is likely to continue as long-term MACD’s histogram remained positive and its signal/MACD line has returned to the upside. Volume is also in a healthy position. Ichimoku shows a clear bullish signal and all indicators are sloping up. Short-term target is at 48.50 while long-term target is at 70.00. Support to accumulate on pullback is at 33.20.
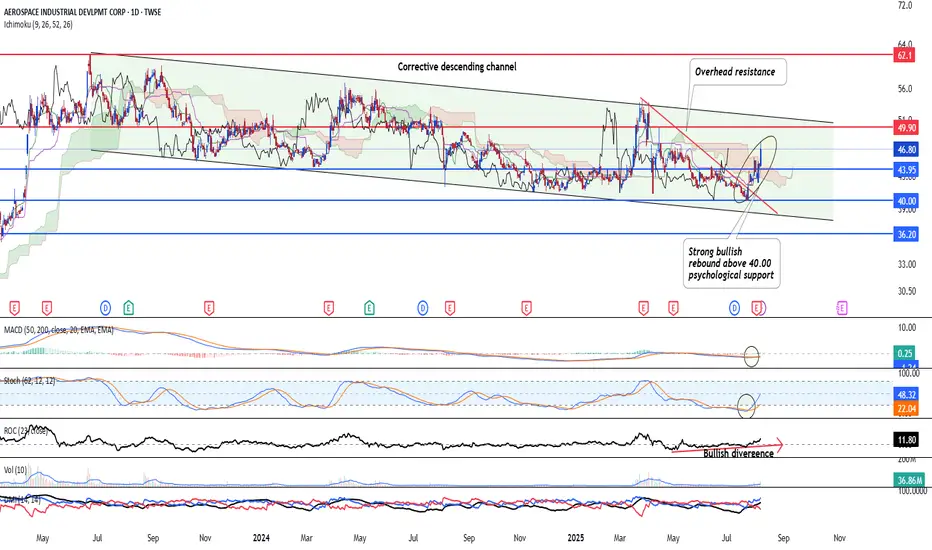
Corrective structure is at its terminal end Though Aerospace Industrial Development TWSE:2634 is still in its corrective downtrend channel, we believe that the correction has hit its terminal end and its getting ready for a bullish rebound after strong bullish pressure was seen sustaining above the 40.00 psychological level. We believe further upside is likely to continue as long-term MACD’s histogram has turned positive and its signal/MACD line has crossed and is sloping upwards towards the zero line. Stochastic has confirmed the oversold crossover. Volume is also in a healthy position. Ichimoku shows a clear bullish signal. Short-term target is at 58.00 while long-term target is at 72.00. Support to accumulate on pullback is at 43.95. TWSE:2634
Uptrend resuming SHIN ZU SHING CO TWSE:3376 is looking at a resumption of the uptrend after price action indicates a strong bullish after breaking above the bullish flag and it has successfully cleared above the bearish gap zone which occurs on 10 Apr 25. We believe further upside is likely to continue as long-term MACD’s histogram and its signal/MACD line has returned to the upside. Stochastic has risen steadily. Volume is also in a healthy position. Short-term target is at 282.50 while long-term target is at 345.00. Support to accumulate on pullback is at 209.20.

Ase technology -Corrective wave ended, upside resumingTWSE:3711 Ase Technology is looking at a possible end to its corrective wave and a bullish impulse wave is likely staging a return. From the price action perspective, there's a strong rebound previously at 123.6% expansion level of wave A-B. Furthermore, the stock has also formed an ascending triangle, which sees a potential break to the upside.
Momentum wise, long-term MACD's histogram just turned positive and stochastic oscillator has been rising steadily, giving a strong steady upside momentum.
As such, we are aiming a mid-term target of 187.00

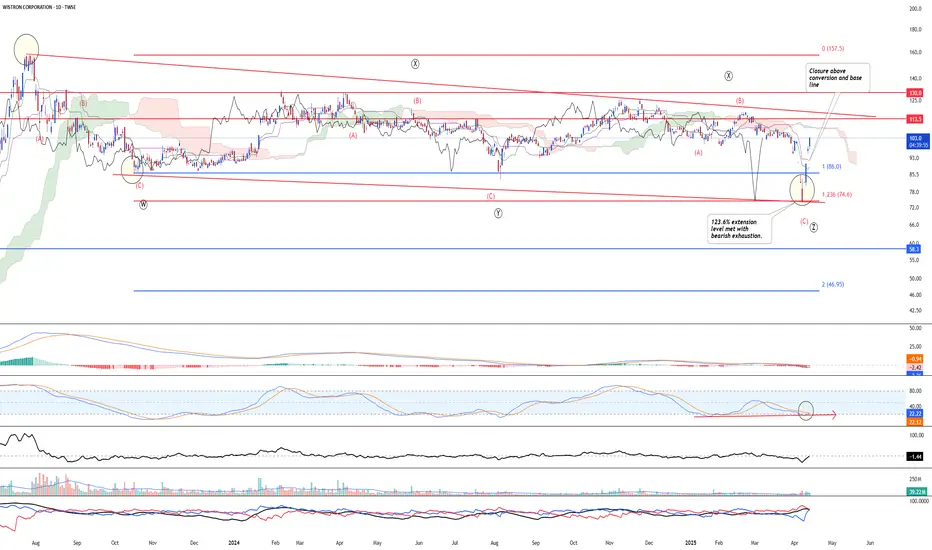
Triple three corrective wave done! TWSE:3231 Winstron is looking at a possible bullish rebound after the rare triple three extended corrective wave has been completed. Furthermore, the stock has seen a bearish exhaustion and a rebound after it reaches 123.6% extension level, a key crucial target level for terminal end of the corrective wave.
Stochastic oscillator has shown oversold crossover and 23-period ROC is showing bullish divergence.
Bottoming up reversal confirmedTWSE:2303 Micro Electronics is looking at an early bottoming out reversal after price action broke above the downtrend line and today was edging up higher with steady flow of volume. Furthermore, Ichimoku shows steady uptrend and is a strong reversal.
Momentum from long, mid and short-term are looking at a bullish momentum in unison. Long-term uptrend from the weekly chart shows uptrend remain intact.

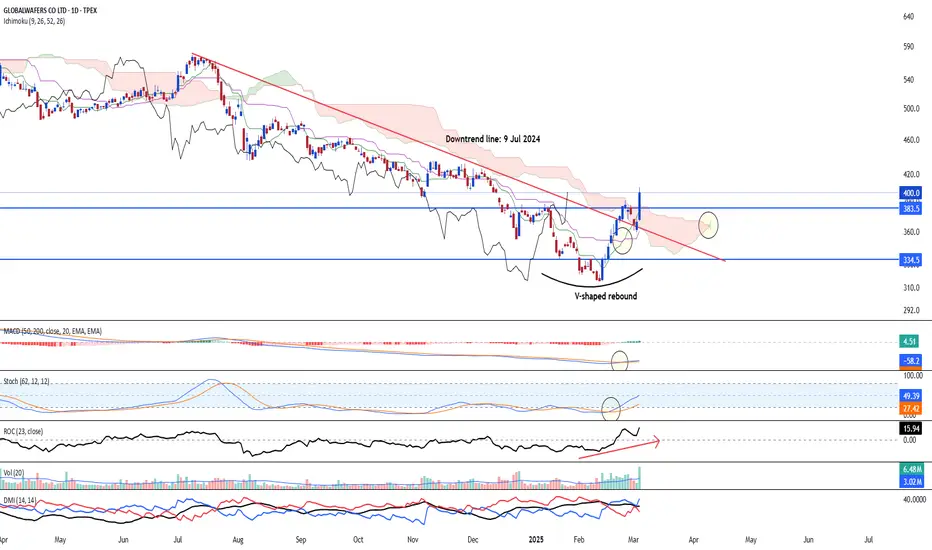
Bullish rebound at key supportTPEX:6488 Globalwafers is looking at a possible bullish rebound after price action shows strong upside. All momentum indicators are back to the upside and is likely looking at a strong momentum going forward.
Bottomed out with strong buyong pressureTWSE:2344 Winbon is strong and strong from the bottom. Ichimoku shows three bullish golden cross and the strong run up from 12th Feb is supported by the spike in volume.
Long-term MACD has turned bullish, supporting the strong run up in long-term momentum.
Stochastic oscillator has confirmed its oversold crossover and is starting to turn bullish.
DMI supports the bullish strength
Long-term monthly chart shows strong upside recovery after the 3-wave corrective structure was seen rebounding strongly at 1-123.6% Expansion of ABC.

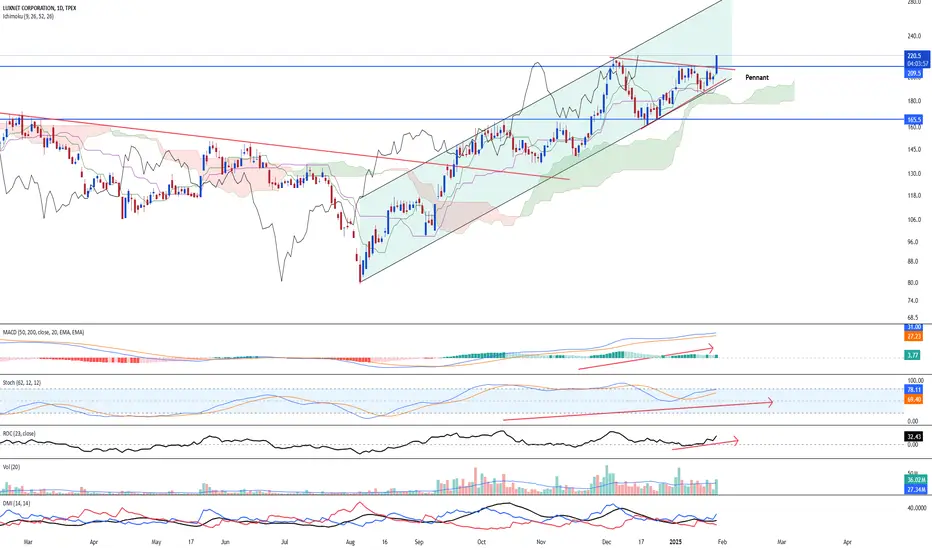
Bullish break above? More upside ahead?TPEX:4979 Luxnet had a strong rally above and has break into a new all time high. This confirmed the bullish outlook over the longer-term period and weekly chart shows a potential wave V in the making, with target at 292-336 region.
Daily chart price action shows a bullish continuation after prices breaks above the pennant, with the support of strong rising volume.
Momentum is strong, with long-term MACD rising strongly and Stochastic Oscillator staying elevated above the 50-mid point line. 23-period ROC is strong.
Volume and Directional movement index shows healthy expansion and rising steady strength.
Support at 180 and 165 are key support levels to watch for a rebound
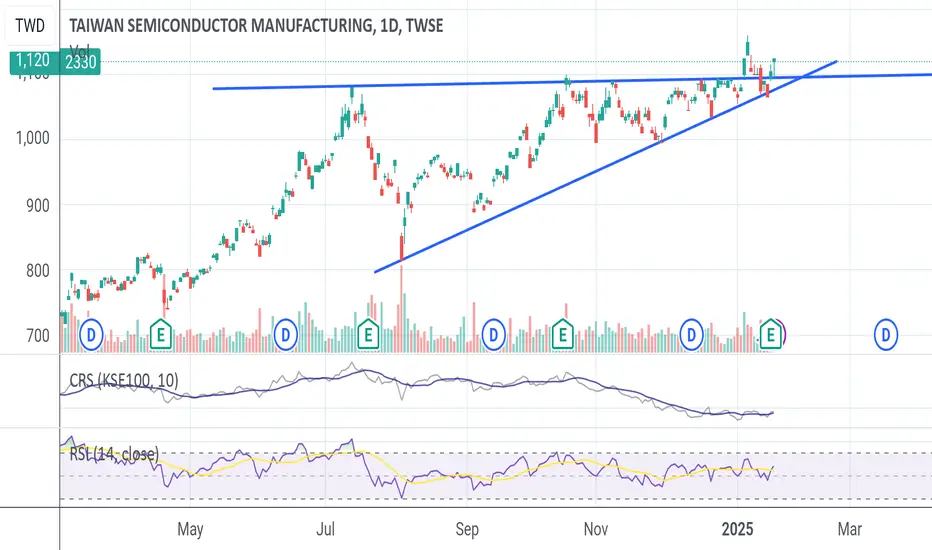
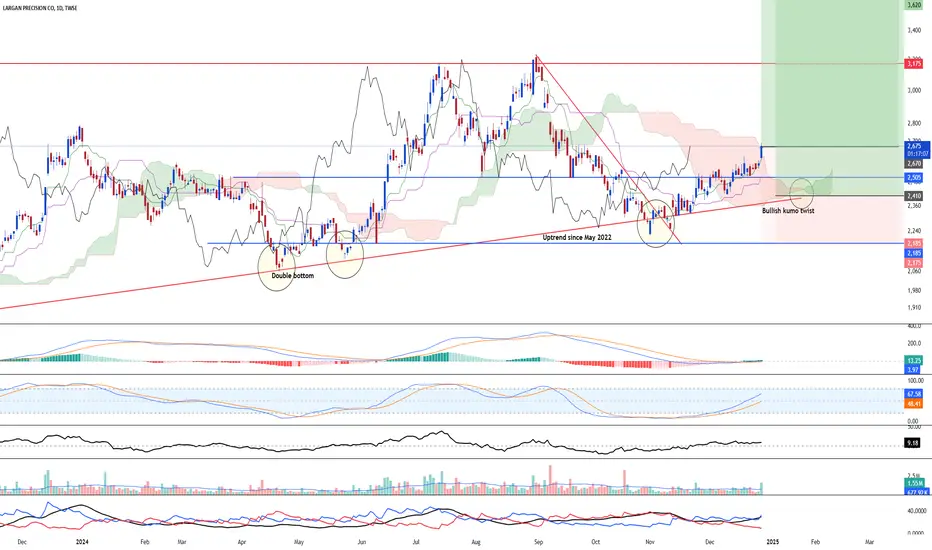
Uptrend is back for the mid-termTWSE:3008 saw a strong bullish recovery after it remain supported above the steady uptrend line which started since May 2022. Above all, the stock has also cleared above the overhead resistance and recent elevation above the Ichimoku's kumo further cement the bullish trend. As such, we are looking at a potential continuation ahead beyond 2,800.
Momentum wise suggest a strong recovery in the long-term MACD and Mid-term stochastic. Directional movement index confirms the bullish strength.
3558with Graphical Analysist to get these key prices
with Graphical Analysist to get these key prices
Clear bullish rebound at the bottom, potential triple bottomTWSE:3037 is looking at a strong potential rebound to the upside after prices breaks and filled above the 2 bearish gap on two different occasion. With the ichimoku showing two out of three bullish crossover, the stock is poised to rise further. To add on, the rise today was supported by strong rising volume. Breaking above 170 in the near future will cement the strong upside to come.
Stochastic oscillator has shown an oversold crossover and 23-period ROC has risen above the zero line.
Weekly chart shows a symmetrical triangle in formation and stock remain supported above the 200 weeks EMA.

Good level to buy and hold for this stock!I prefer to split my entry long into 2 position, NOW and around the 78.6% fibo level.
This set up is for mid to long term and it offers a very good R:R trade!
CHEERS!
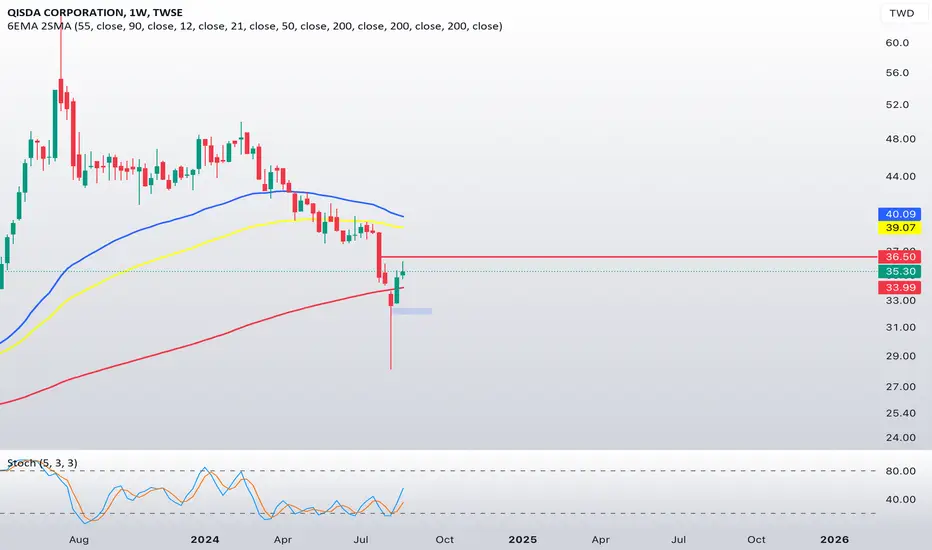
2352 buy zone2352 1W
rejection dynamic support
resistance minor 36.5
momentum candle rejection
stoch pointing up oversold
A P-E BAND FOR 8069.tw E-INKvisualize data that includes PE (Price to Earnings) and PB (Price to Book) band multipliers, monthly revenue, and big shareholder holding rates. To achieve this, we can use Plotly, which offers powerful and interactive plotting capabilities.
Here's an example to create a combined chart using Plotly:
Plot PE and PB Band Multipliers:
Use a line chart to show the PE and PB band multipliers over time.
Monthly Revenue:
Use a bar chart to show monthly revenue.
Big Shareholder Holding Rate:
Use a line chart to show the holding rate of big shareholders over time.

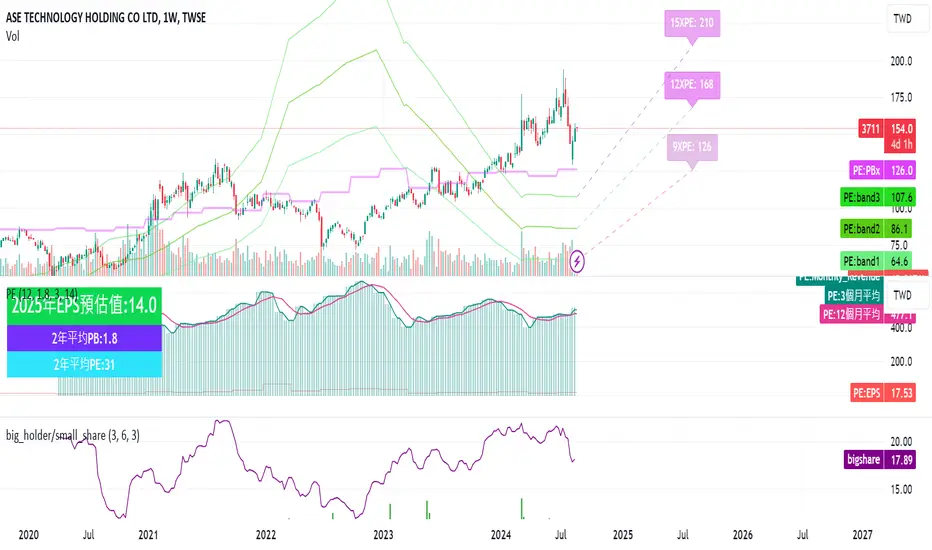
A P-E ban for 3711 ASEThis chart express ASE Pe band and Monthly revenue.
Also , an input of 2025 year EPS forecast will bring future P/E band till 2025 year.
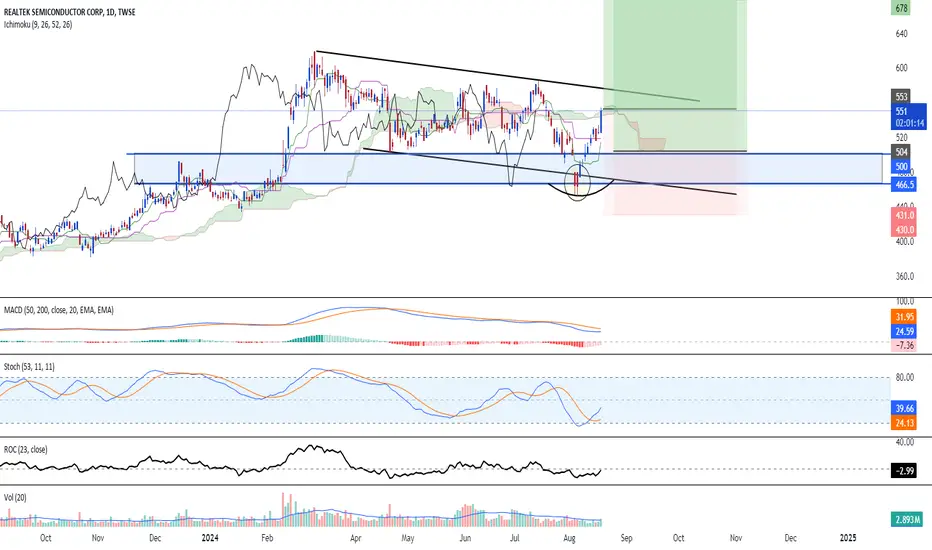
V-shaped rebound at SOW phaseRealtek Semi is likely looking at a possible bullish continuation to the upside after completing a three wave corrective channel with a recent v-shaped bottom rebound.
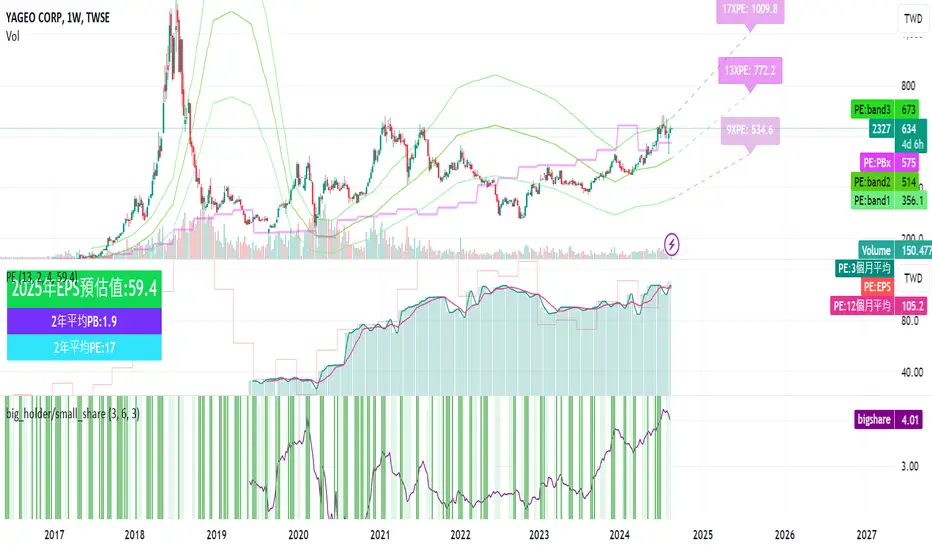
A P-E band for 2327 yaegoThis chart express yaego Pe band and Monthly revenue.
Also , an input of 2025 year EPS forecast will bring future P/E band till 2025 year.
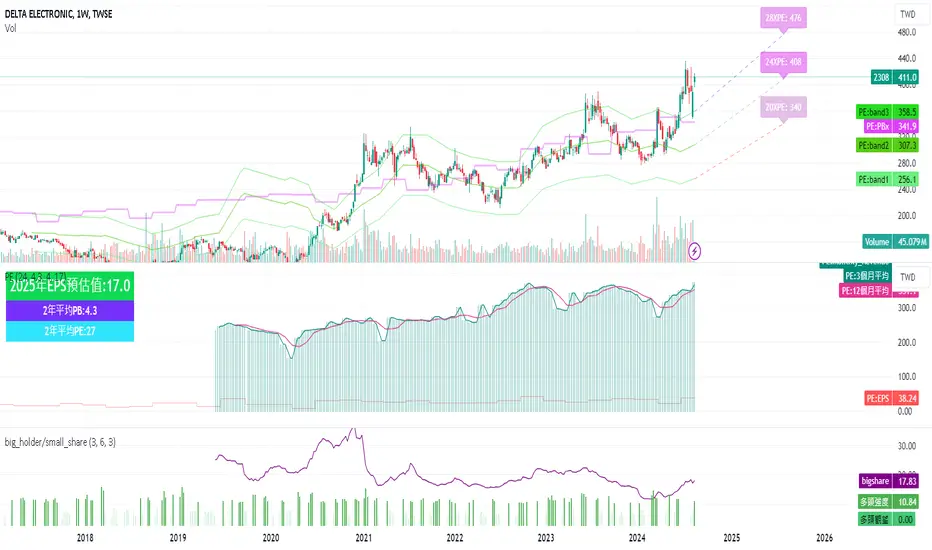
a pe band for 2308.TW quantaThis chart express quanta Pe band and Monthly revenue.
Also , an input of 2025 year EPS forecast will bring future P/E band till 2025 year.