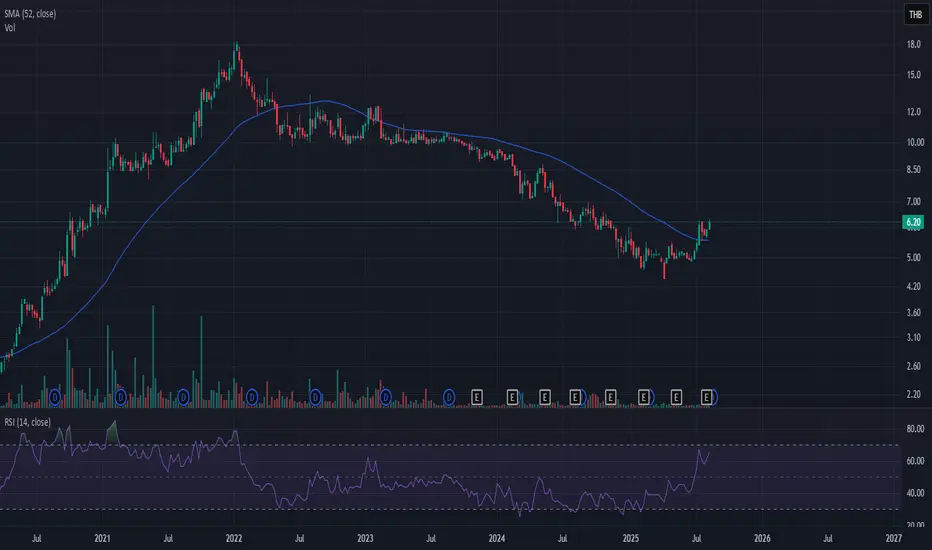
BOL Uptrend StartingBOL has turned bullish after a long downtrend, now trading at 6.20 THB. Price has broken above the 52-week SMA (5.55 THB), suggesting a potential shift into a new uptrend.
Analysis
Price reclaiming above the long-term moving average indicates a trend reversal.
RSI is currently at 65 — not yet overbought, but building momentum toward RSI70+.
Volume remains steady, supporting the breakout attempt.
UVAN Breaking HighHere’s a ready-to-publish draft for UVAN in your RSI70+ aggressive momentum style:
UVAN RSI70+ Breakout
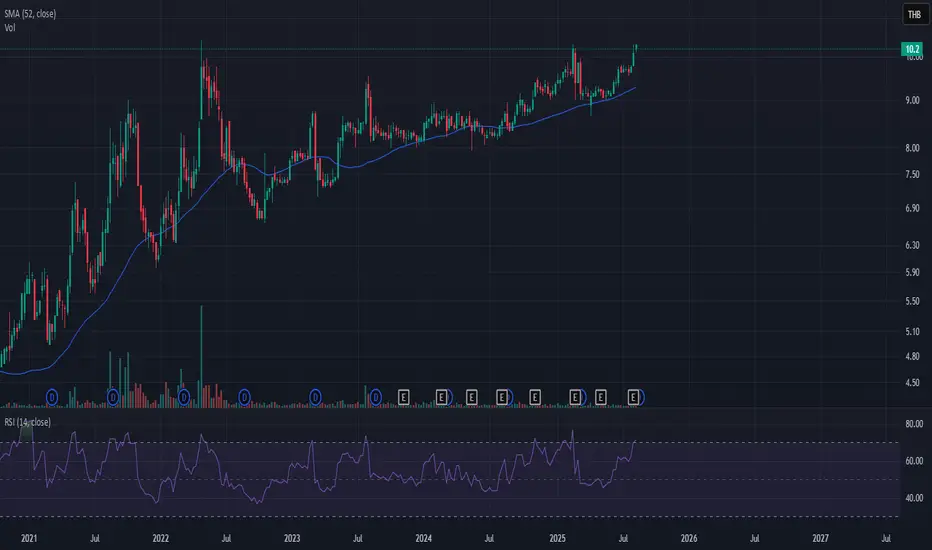
UVAN has just pushed into RSI70+ territory (~71.4) while trading at 10.20 THB. This comes after a steady multi-year uptrend, with price holding consistently above the 52-week SMA (~9.28 THB).
Analysis
Strong uptrend structure with higher lows and higher highs.
RSI breaking above 70 signals short-term momentum acceleration.
Volume shows steady participation, supporting the breakout.
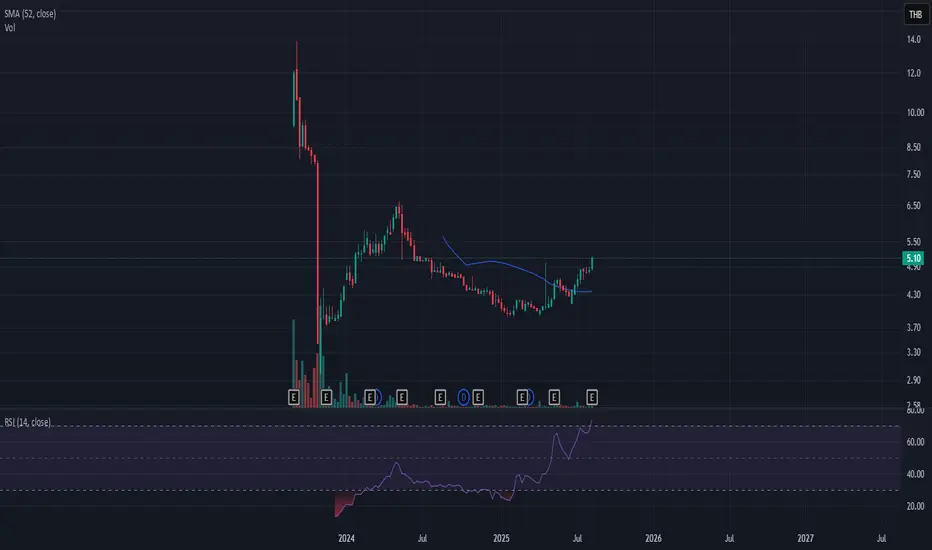
PSP First Time RSI70+PSP has just entered RSI 70+ territory (currently ~73), marking the first time it has reached overbought levels in this cycle. This is a strong momentum signal after a long consolidation phase.
Analysis
Price is trading above the 52-week SMA (~4.37 THB), confirming a bullish shift in trend.
Momentum has been building steadily, supported by increasing volume, showing strong market participation.
The RSI crossing above 70 for the first time is often a sign of the beginning of a short momentum run, not necessarily the end.
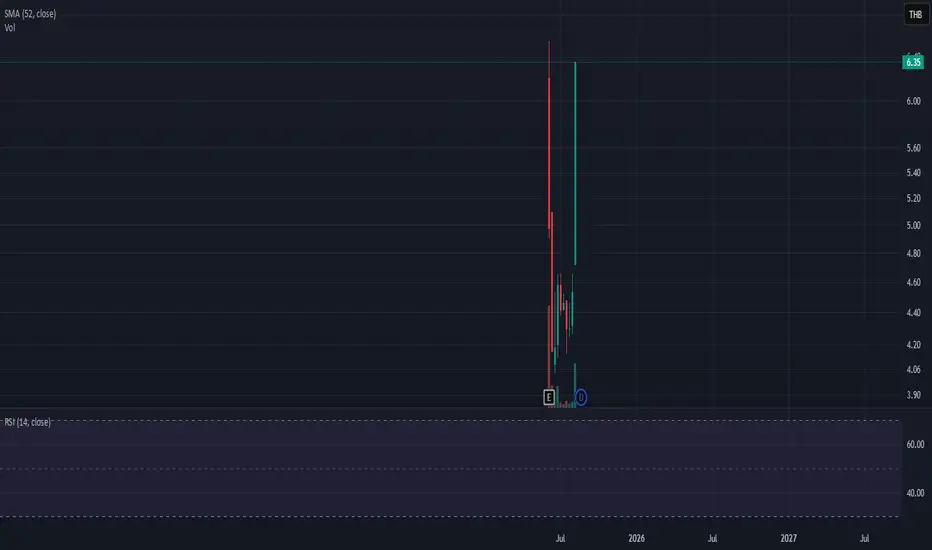
NUT Breaking High RSI70+NUT Breaking High RSI70+
NUT has recently shown extreme volatility with wide candlestick ranges, pushing the stock price above 6.30 THB. This strong move suggests heightened speculative activity and momentum-driven buying.
Key observations:
Momentum Breakout: Price has surged significantly from lower levels, breaking through key resistance zones.
RSI (14): The RSI is approaching overbought territory (70+). This indicates strong buying pressure, but also signals the risk of short-term exhaustion.
Volume Spike: Trading volume is very high compared to historical averages, showing strong market participation in the breakout.
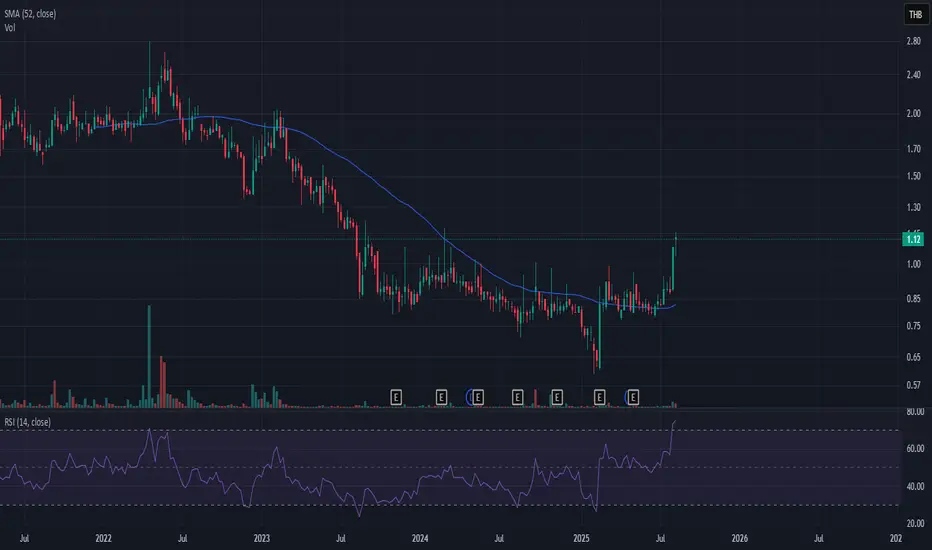
IND RSI 70+The stock price of IND has recently broken above the 1.00 THB level and is now trading around 1.12 THB. Notably, the RSI (14) has surged to above 70, currently at ~75, signaling that the stock has entered overbought territory in the short term.
From a technical perspective:
Momentum: The stock has shown strong bullish momentum after consolidating for an extended period below 1.00 THB.
Trend: Price is now trading above the 52-week SMA (currently ~0.83 THB), which suggests a potential shift from long-term downtrend into recovery mode.
RSI Signal: With RSI above 70, there is a risk of short-term pullback or profit-taking, although strong momentum can sometimes sustain RSI in the overbought zone.
AOTAOT price is now near the support zone of 27-25. If the price cannot break through the 25 baht level, it is expected that the price will rebound. Consider buying in the red zone.
🔥Trading futures, forex, CFDs and stocks carries a risk of loss.
Please consider carefully whether such trading is suitable for you.
>>GooD Luck 😊
❤️ Like and subscribe to never miss a new idea!

BDMS TF Month (Buy TP 22.40/24.00/26.50)BDMS TF Month (Buy TP 22.40/24.00/26.50)
1- Looking at the past, we see that the lowest point in 2020 was around 13.90, with the RSI at approximately 37.
2- Currently, it has dropped to the same level, around 38. We believe the price should reverse upwards.
3- When the Fibo (black line) is drawn, we see that the price has retraced to the 61.8% level at 20.30 baht, which is a key historical support level.
///
If 19.80 is a reversal point,
it's possible the price will rise to test 22.40/24.00/26.50.
///
Strategy:
Buy and sell at 22.40/24.00/26.50, respectively.
If the price falls below 19.80, cut your losses.
Good luck.

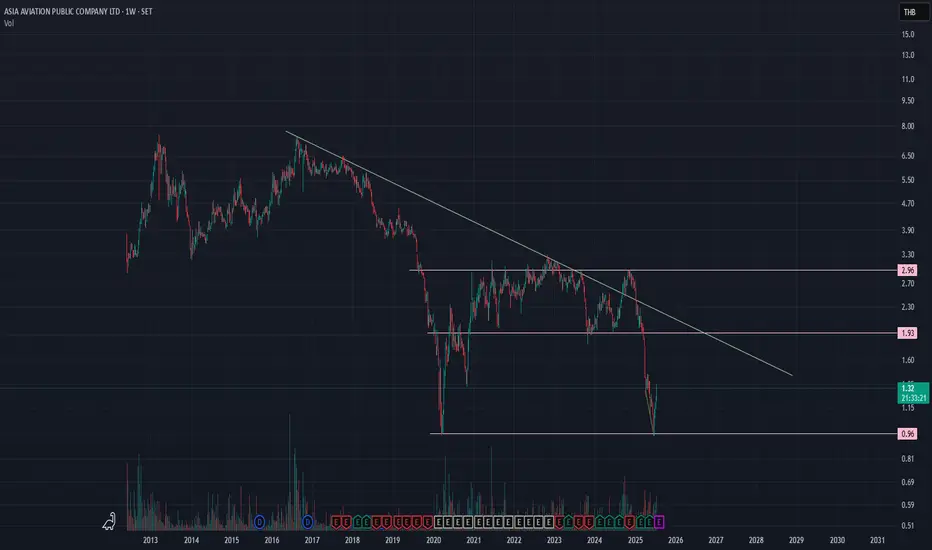
AirAsia. Most popular domestic airline of Thailand.AirAsia has become most popular domestic airline in Thailand. They now hiring more and more mechanic and investing more airplane on their fleet.
The chart showed false break-out once because SET pull it down the whole market which normal.
Buy now not the Q4. Even how bad Thai economy been but we cant denied that tourists love to visit Thailand on the New Year. Our rating might under performance but we airliner will make more profits on the end of the year. Transit flight included.
Hopefully price can stand above 3 THB and up to 7 THB.
Mid term investment.
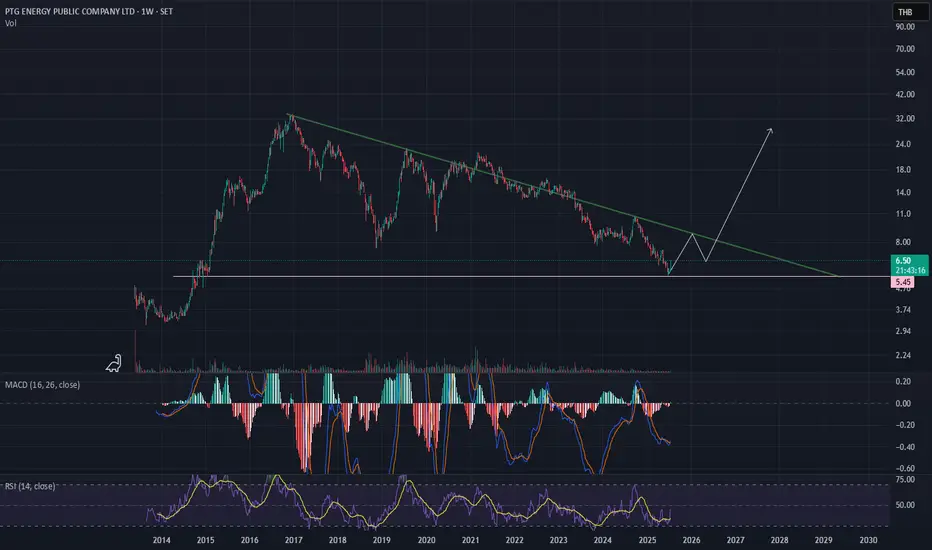
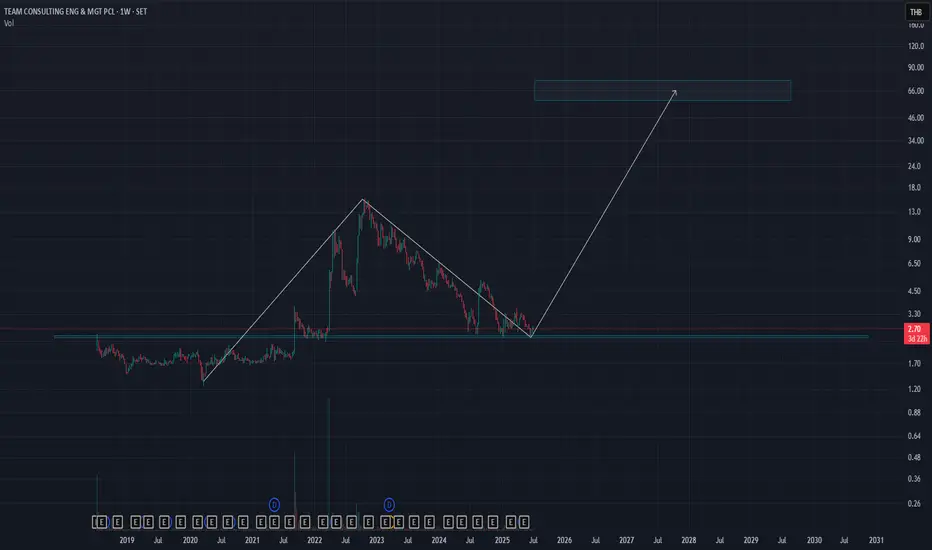
PT station I believed. Long-term investment. Such a hell on SET stock trading but there always opportunities for us.
PT Station has became the one of the most popular gas station in Thailand and not just the gas station but also PUNTHAI cafe which gained a lot of market share for low-end cafe market.
Huge triangle have to be breakout and do HH. watch daily TF for confirmation.
This is Long-term investment
See you all at 33 Bath.
NEX, BYDSET: NEX & BYD Technical Analysis - Key Resistance Levels Ahead
NEX POINT PCL (NEX) - BULLISH REVERSAL**
- **Current Price:** 0.98 THB
- **Target 1:** 1.02 THB (+4.1%)
- **Target 2:** 1.05-1.07 THB (+7.1% - +9.2%)
- **Stop Loss:** 0.85 THB (-13.3%)
- **Risk/Reward:** 1:2.5
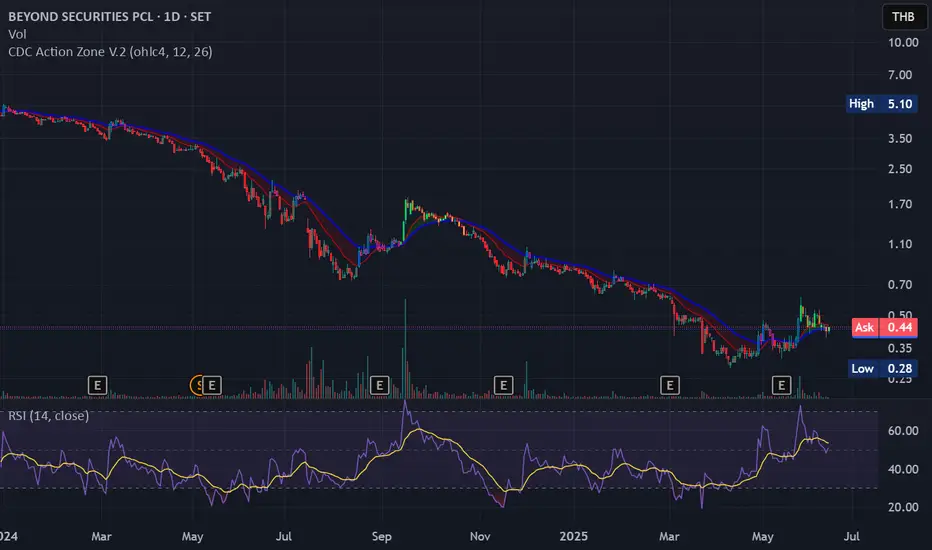
BEYOND SECURITIES PCL (BYD) - ACCUMULATION PHASE**
- **Current Price:** 0.36 THB
- **Target 1:** 0.45 THB (+25%)
- **Target 2:** 0.52-0.54 THB (+44% - +50%)
- **Stop Loss:** 0.34 THB (-5.6%)
- **Risk/Reward:** 1:4.5
Technical Analysis**
NEX Analysis:**
Bullish Signals:**
- Price recovering from 0.85 support level
- RSI at 78.12 showing strong momentum (though overbought)
- Volume confirmation at 1.56M
- Breaking above key moving averages
Risk Factors:**
- RSI in overbought territory - potential short-term pullback
- Need to break 0.98-1.00 resistance convincingly
Key Levels:**
- **Immediate Resistance:** 0.92, 0.98-1.00
- **Major Resistance:** 1.02, 1.05-1.07
- **Support:** 0.85, 0.90
BYD Analysis:**
Bullish Signals:**
- Bouncing from critical support at 0.35
- RSI at 42.68 - plenty of room for upside
- Consolidation pattern forming - accumulation phase
- Low volume suggests institutional accumulation
Growth Potential:**
- Multiple resistance levels provide staged profit-taking opportunities
- Strong risk/reward ratio due to tight stop loss
**Key Levels:**
- **Immediate Resistance:** 0.43-0.45
- **Secondary Resistance:** 0.48-0.50
- **Major Resistance:** 0.52-0.54, 0.58-0.61
- **Critical Support:** 0.34-0.36
Time Horizon: July - August 2025
Expected Scenarios:
Bull Case (70% probability):**
- NEX reaches 1.05+ as tech sector recovery continues
- BYD breaks 0.45 and moves toward 0.52 on improved sentiment
- SET Index supportive environment
Base Case (20% probability):**
- Sideways consolidation within current ranges
- NEX: 0.90-1.02 range
- BYD: 0.36-0.45 range
Bear Case (10% probability):**
- Market correction affects small caps
- NEX retests 0.85 support
- BYD falls below 0.34
Trading Strategy
For NEX:
1. **Entry:** Current levels (0.98) or on pullback to 0.94-0.95
2. **Position Size:** 2-3% of portfolio
3. **Take Profit:** 50% at 1.02, 50% at 1.05+
4. **Stop Loss:** Strict at 0.85
For BYD:
1. **Entry:** Accumulate between 0.36-0.38
2. **Position Size:** 3-4% of portfolio (higher conviction)
3. **Take Profit:** 30% at 0.45, 40% at 0.50, 30% at 0.54+
4. **Stop Loss:** 0.34
Catalysts to Watch
Positive Catalysts:
- Q2 2025 earnings season results
- SET Index breaking key resistance
- Sector rotation into small caps
- Economic recovery momentum
Risk Factors:
- Global market volatility
- Thai economic data disappointments
- Profit-taking in overbought conditions
- Liquidity concerns in small caps
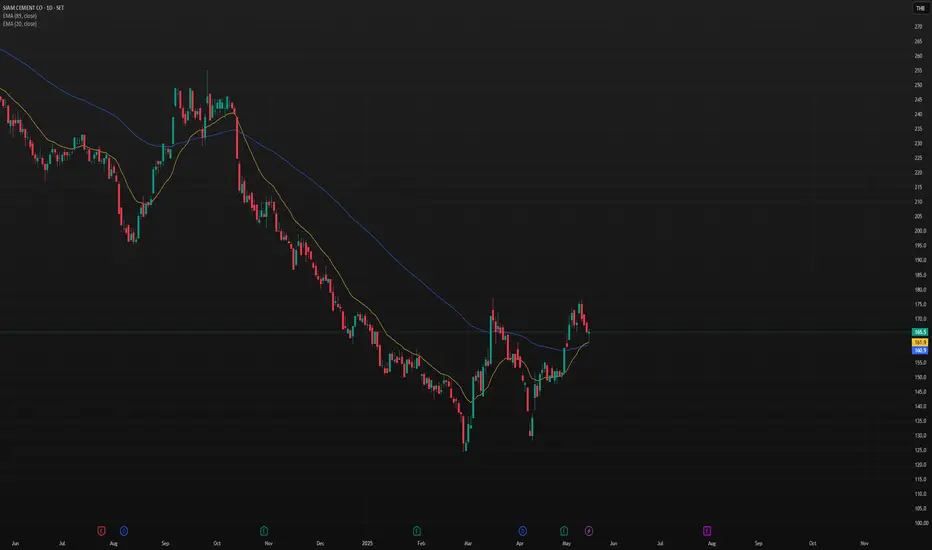
SCC BuySCC Buy 165 cut 160 TP 2-3 R
SCC Going up and pull back , it's time to buy,
Remember dont over risk, just risk 1-2% per trade
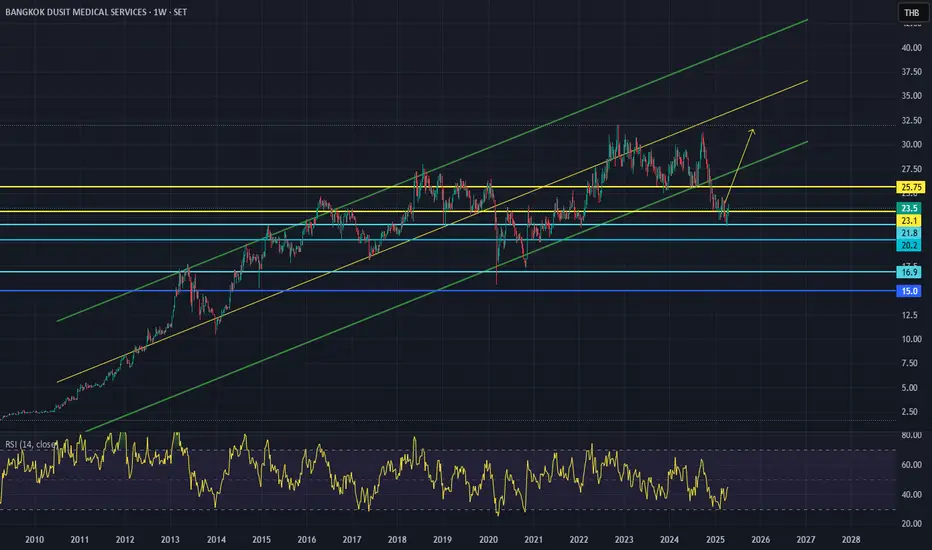
BDMS BDMS: Perfect Entry Point? 🏥📈
Looking at BDMS (Bangkok Dusit Medical Services) - this setup is screaming opportunity! 🔍
The chart is telling us a clear story:
Price just bounced off the long-term uptrend channel support (green line) 💪
Currently trading at 23.5 THB with a perfect rejection at the 23.1 THB support level
RSI at 44.63 shows momentum picking up from oversold conditions 🚀
That yellow arrow pointing up? That's the projected move everyone's watching!
What I'm seeing here is a classic "buy the dip" scenario in a quality healthcare stock. BDMS has formed a solid base at current levels after the recent pullback, and now looks ready to resume its uptrend toward 30-32 THB region 📈
Smart money strategy:
Entry: Current levels around 23.5-23.8 THB look optimal
Target: 30-32 THB (previous resistance zone) = 25-35% potential upside! 💰
Stop loss: Below 22.5 THB to manage risk
Healthcare sector has always been defensive with reliable growth, and BDMS is the premium player in Thailand. This isn't just a technical trade - it's backed by fundamentals too! 👨⚕️
Time to load up before the next leg higher begins! 🔥 #InvestingForFuture
Disclaimer: Just sharing my chart analysis - do your own DD before pulling the trigger 😉
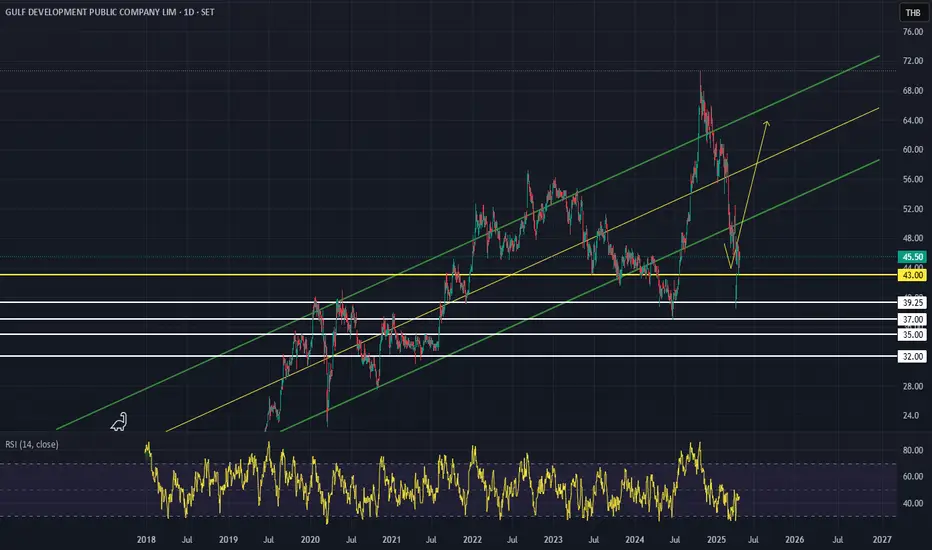
Gulf GULF: Time to Invest? 📈
GULF is looking super interesting right now! See how the price beautifully bounced off that 43 THB support level? 🚀
My analysis:
Price moving in a long-term upward channel (green lines) since 2018 💪
RSI at 44.92, nowhere near overbought - plenty of room to run
Notice that yellow arrow pointing up? That's what traders are waiting for 👀
I'm targeting 60-64 THB (check previous peaks) with potential 30-40% gain 🤑 But keep a stop-loss below 43 THB to stay safe!
Honestly, energy sector still looks strong, and GULF has solid fundamentals with powerful business owners. This looks like a good long-term hold, not just a short trade 👍
Bottom line: Buy now at 45.xx THB and ride it up to the 60 THB zone! 🔥 #GetRichOrDieTrying
Remember this is just my idea - do your own research before investing (not financial advice) 😉
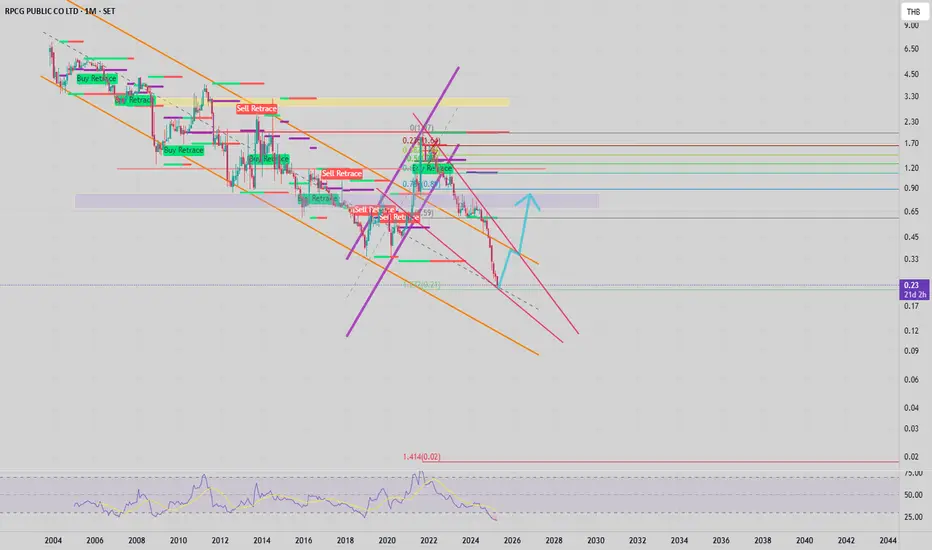
RPC falling wedge pattern? RPC has historically exhibited occasional large bullish candlesticks indicative of sudden upward momentum. Currently, the stock is significantly oversold, trading at its lowest price on record. It has now retraced to the 1.272 Fibonacci level, suggesting a potential setup for a rebound or a technical bounce.
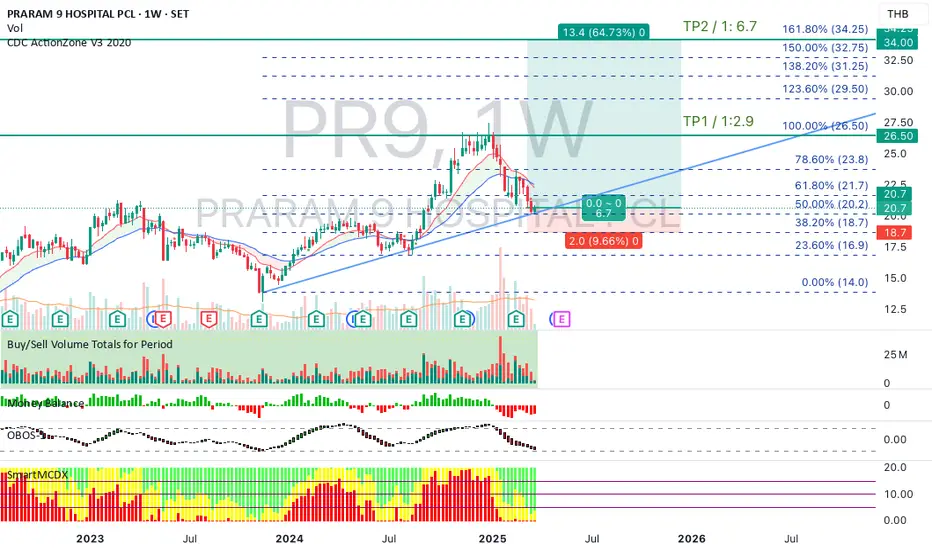
PR9 < PRARAM 9 HOSPITAL >The price has retraced to the trendline and the 50% Fibonacci level, while the financial statements have shown positive results.
TP1 > 26.5 > RR > 1:2.9
TP2 > 34.0 > RR > 1:6.7
SCB and Bank Trend and Thailand Economy TrendSCB and Bank Trend and Thailand Economy Trend, This is not investment advice this is just for case study

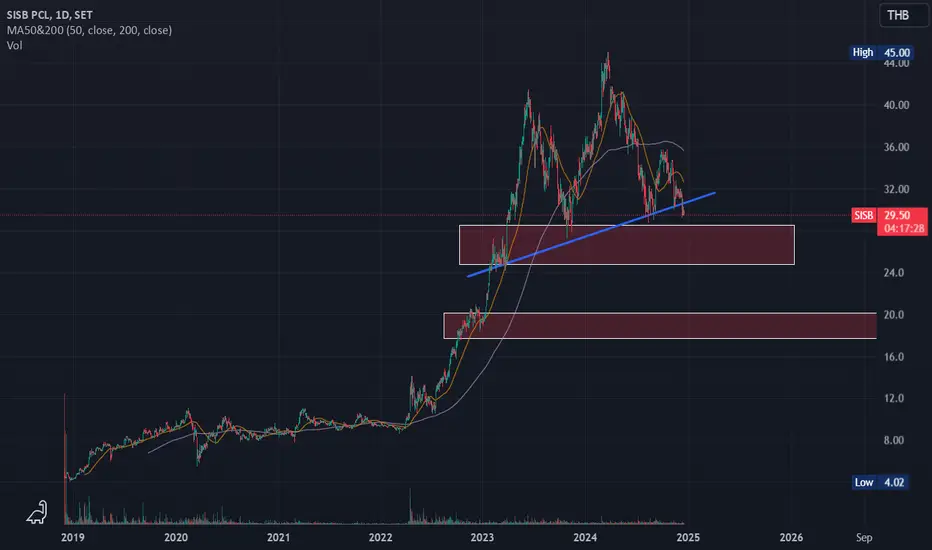
Singapore International School of Bangkok ( Short )Cooling off. Overshot to the upside. Needs time to grow into earnings.
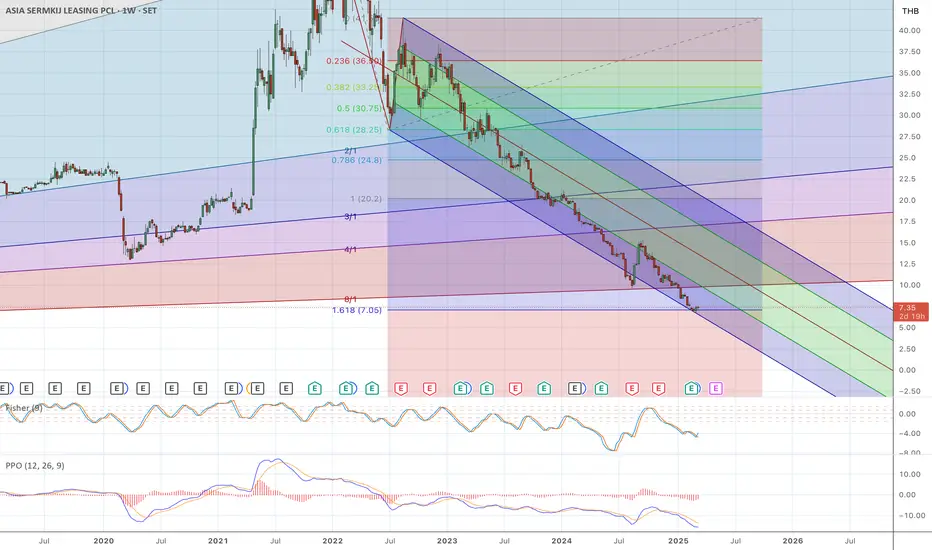
ASK hitting 1.618 fibonacci extensionOn a longer-term chart, the price has hit the Fibonacci extension level in a downtrend of 7.05 THB. Currently, this level seems to support the price. Putting the fundamentals aside, this could be a good entry point for technical play.
The fisher transform on the weekly chart has also crossed up.
Entry: ~7.35 THB
TP: 17 THB
SL: 6.40 THB
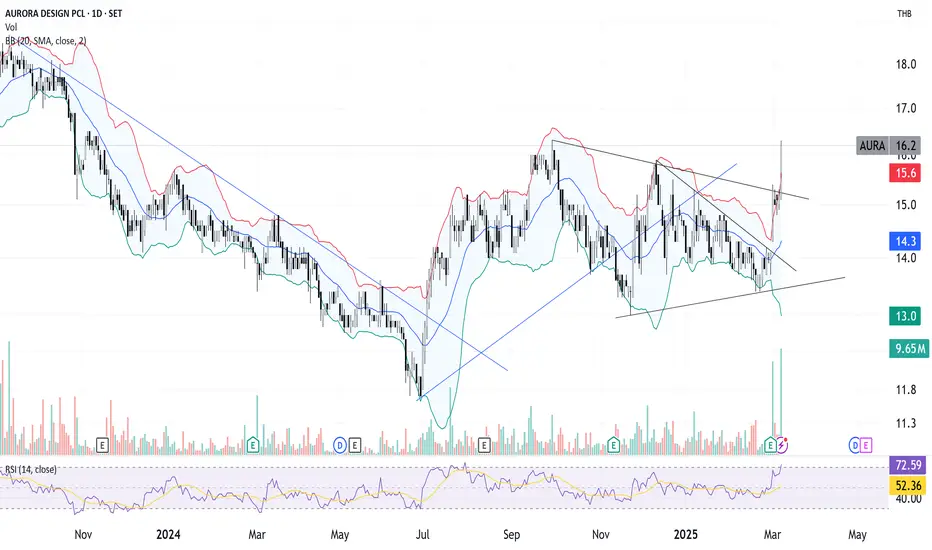
AURA broke out of trendline and Bollinger band for a breakoutAURA had broken out of the Bollinger Band and the Trendline resistance which is a good candidate for a breakout trade
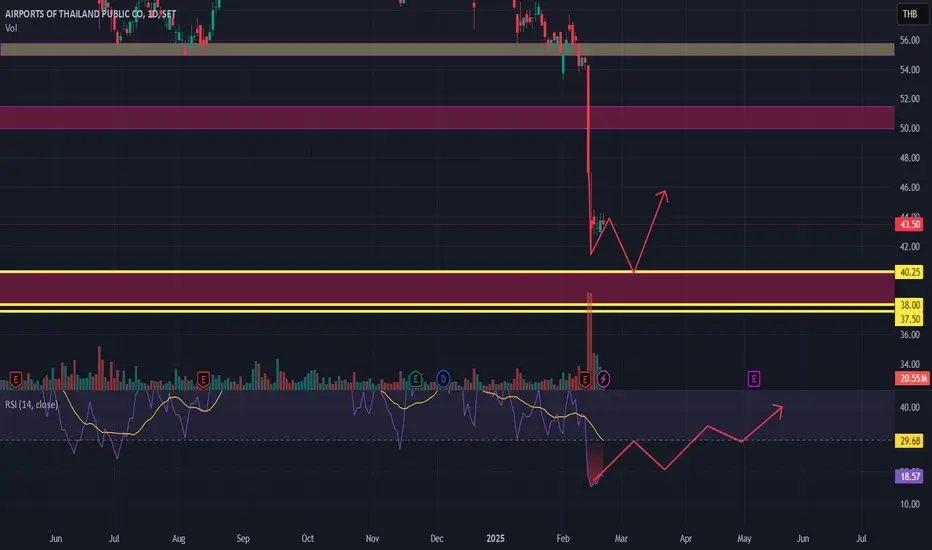
Buy AOT When Price Back To Demand ZoneAOT Down Trend.
For Now Wait And See.
Buy When Price Back to Demand Zone.
Buy AOT Price 40.25-38.00 Bath.
If Price Close Under 38.00 cut loss.
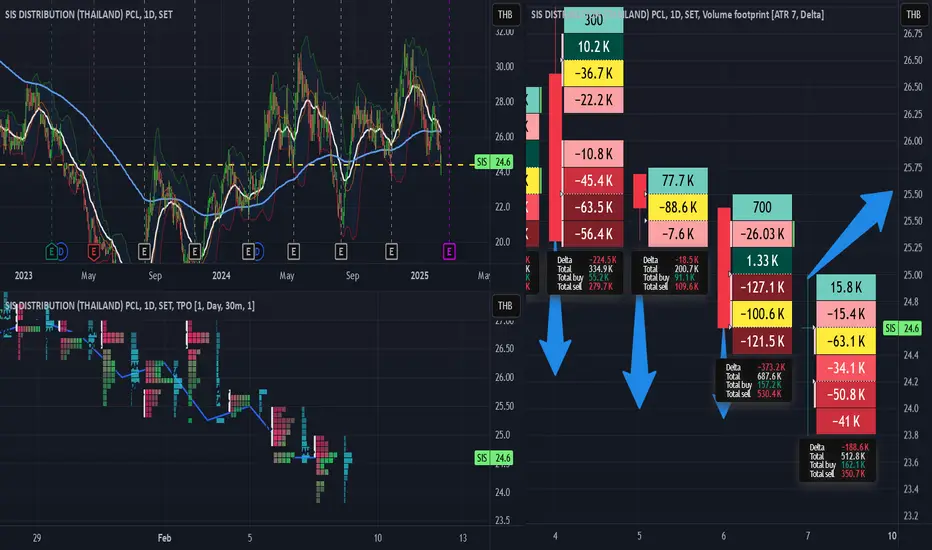
Is SIS going up? How far?SIS is currently around a major support level, shown as the yellow dashed line. In my opinion, it is still likely to bounce off this level and test the next resistance.
This is supported by a strong and robust volume profile, which, for me, is a sign of potential upward movement.
However, SET sentiment and the Thai economy remain weak, and the major trend for SIS is still downward. Therefore, I don’t expect SIS to go too far.