TH | Bullish Bat Harmonic | Breakout Signal Entry Position TH | Thailand SET Index | Financial Sector | Price Action & Chart Pattern Trading
Chart Pattern: Falling Channel - Bullish Bat Harmonic Pattern
Price Action: Breakout Entry Position
Indicator:
> RSI Bullish signal crossing up MA line above 50.
> MACD Bullish - golden cross signal just below the baseline.
Trade with affordable risk ratio 3:1
Trust in your system indicator
Never panic trade
Always respect stop-loss
Goodluck
DP

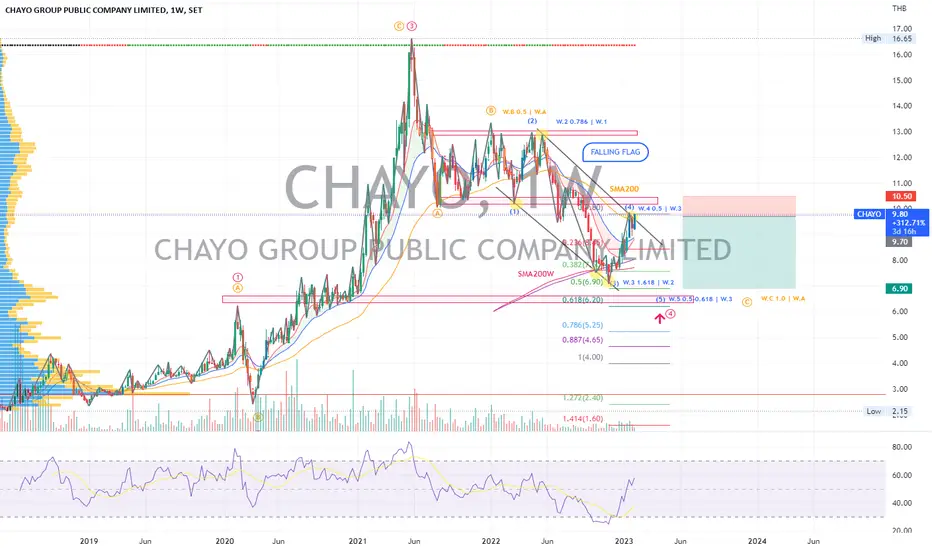
CHAYO | Elliott Wave | Correction Projection - 25%Price action and chart pattern trading
> The current price C-wave correction is moving within a falling flag
> Potentially 4-wave uptrend targeting 0.5 retracement of 3-wave approaching / fakeout SMA200 day resistance zone.
> Entry @ SMA200 breakdown
> Target @ 0.5-0.618 Wave 3 extension zone -25% - 30%.
> Stop @ 8% previous 1-wave correction zone
Always trade with affordable risk and respect your stoploss
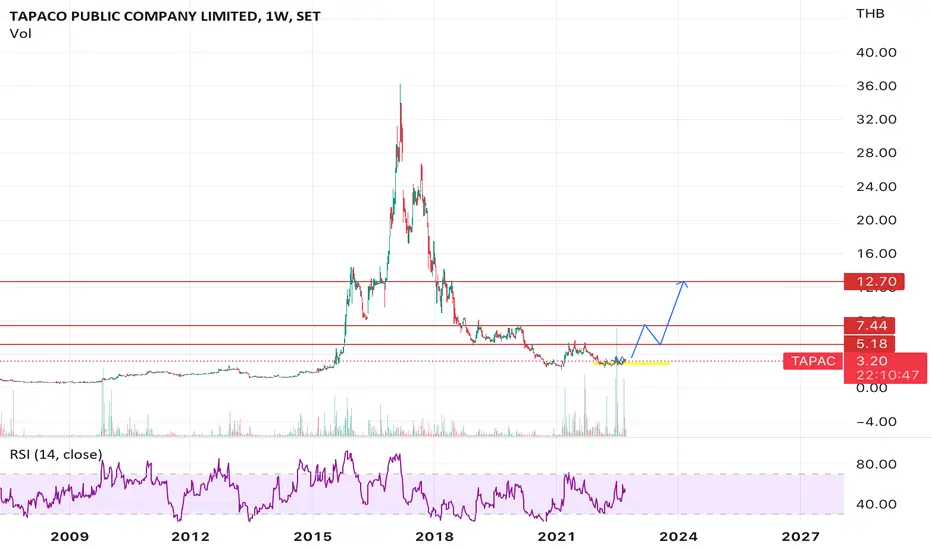
TAPAC Collecting <3.00 and Hold :DTAPAC Collecting <3.00 and Hold, Long Term Stock Hold, Buy under 3.00
IIG | Elliott Wave Analysis | Falling Wedge Breakout Target +22%Price action and chart pattern trading setup:
> A minor wave 2 correction ended with a falling wedge breakout with a potential target +22%.
> The current price is trading between SMA200 and SMA50 - a possible pullback entry at SMA50 and 20 golden cross price position.
> Stop @ the lowest inverted head & shoulders -7%
> Risk reward ratio: 3:1
Always trade with affordable risk and respect your stoploss.
Good Luck

SAWAD and Buy on Dip SetupSAWAD is one of my watch-list stocks, category of leasing company. There was golden cross signal in early this year and I have waited for another entry. Buy on Dip is one of my favorite signal to buy the stock at limited risks. Good luck for your trading.

BPP | Wave Analysis | Bullish Divergence Uptrend Target +25%Price action and chart pattern trading setup:
> ABC correction - main downtrend channel breakout in TFW and bullish Anti Nenstar pattern - possible a major trend reversal pivot point
> Indicator: MACD / RSI bullish divergence - strong reversal signal in TFW
> Entry @ Breakout retest zone SMA50 - 20
> Target @ TP1 17.2 + 15% Inverted Head & Shoulders Target / TP2 18.7 + 25% - Falling Wedge Target - 0.618 Fibonacci retracement and volume profile POC
> Stop @ Inverted head position -7%
> Risk reward ratio: 2:1, 3:1
Always trade with affordable risk and respect your stoploss - nothing 100%

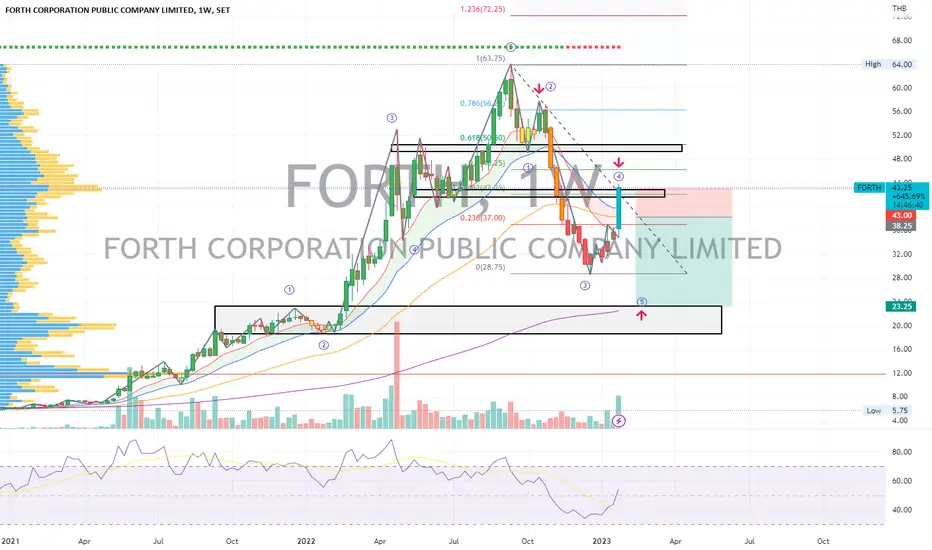
FORTH | Elliott Wave Correction | Breakout or Fakeout? Price action and chart pattern trading setup
> A possible strong rising uptrend 4 Wave correction making a false breakout at EMA200D
> Wait and see at EMA200 retest confirmation
> Entry: EMA200D breakdown
> Target 5 wave correction of A-wave at EMA200 week -40% downside
> RRR: 3:1
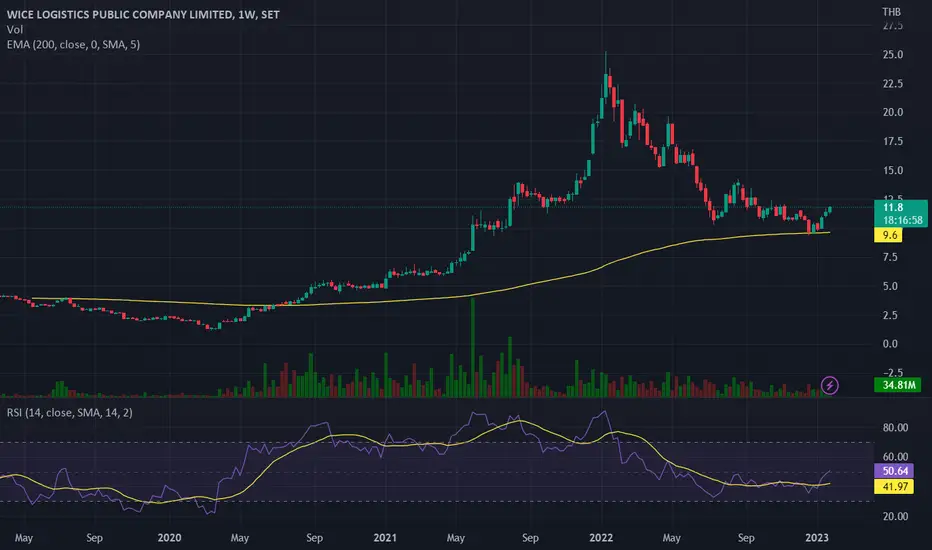
WICE - weekly chartAfter profit taking by Insti investors due to slower profit. Share price is now parking at EMA200 weeks with stable profit QoQ. However, China's re-openining policy, WICE is expected to get back to the track once again.
TIPH | Elliott Wave - Wave 4 Uptrend Target or A Bull Trap? Price action and chart pattern trading - A possible bull trap false breakout SMA200D
> The price strong breakout last week could be forming an inverse head & shoulders pattern for a possible 4-wave correction uptrend
> Wait for a pullback to complete the right shoulder consolidation pattern.
> Entry : breakout - right shoulder after pullback consolidation
> Target: Upper resistance +10-15% (0.382 - 0.5 Fibonacci retracement zone)
> Stop: right shoulder support - 4%
> Risk Reward Ratio: 2:1
Always trade with affordable risk and respect your stoploss
Good Luck

SFLEX buy 2.5-2.9Rsi Weeks divergent and fibo look good , need making head & shoulder before rise up
Collecting One here.
:)


VGI | Wave Projection | Inv. H&S TFW Breakout Target +30% upsidePrice action and chart pattern trading setup & target
> This wave analysis in weekly timeframe indicates a possible new 1-wave ABC uptrend reversal pattern with an inversed head & shoulders pattern support.
> ENTRY: A possible pullback trade at neckline breakout zone
> TARGET: head & shoulders targeting 1.618 extension +30% upside
> RESISTANCE: 1.0 Fibonanci extension zone 5.30+ baht
> STOP: right shoulder zone -10% risk
> RRR: 3:1
Always trade with affordable risk and respect your stoploss
Goodluck

B | Wave Projection | TFW Bullish Divergence | Ending Diagonal?Price action and chart pattern - descending triangle with a bullish divergence pattern in weekly timeframe is considered a strong reversal trading signal.
Wave projection: A possible 5 wave of major A-wave correction coming forming an ending diagonal wave targeting 0.5 - 0.618 fibonanci extension of previous 3-wave downtrend.
Entry: Descending triangle breakout / SMA200W zone
Stop: Lower triangle support -12%-15%
Target: 0.382 - 0.5 retracement of current downtrend A-wave +40% - 50%
Risk reward ratio: 3:1
Always trading with affordable risk and respect your stoploss
Good Luck

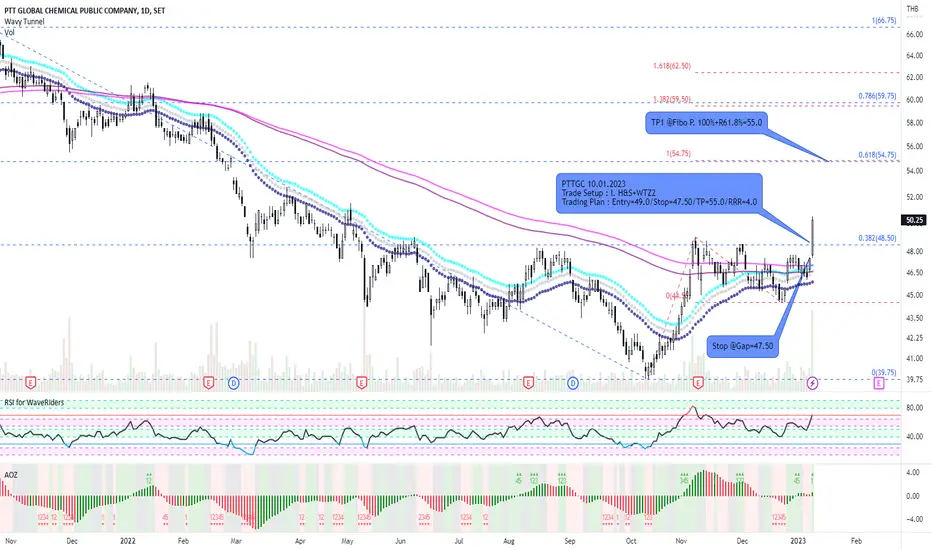
PTTGC with Inverted H&S Pattern and WTZ2I apply chart pattern (Inverted H&S) together with WTZ2, my favorite setup for trading strategy of this stock. In addition, if finding their financial statement, you will not doubt to entry. Once again, don't forget to calculate your risks well before trading. Good Luck!
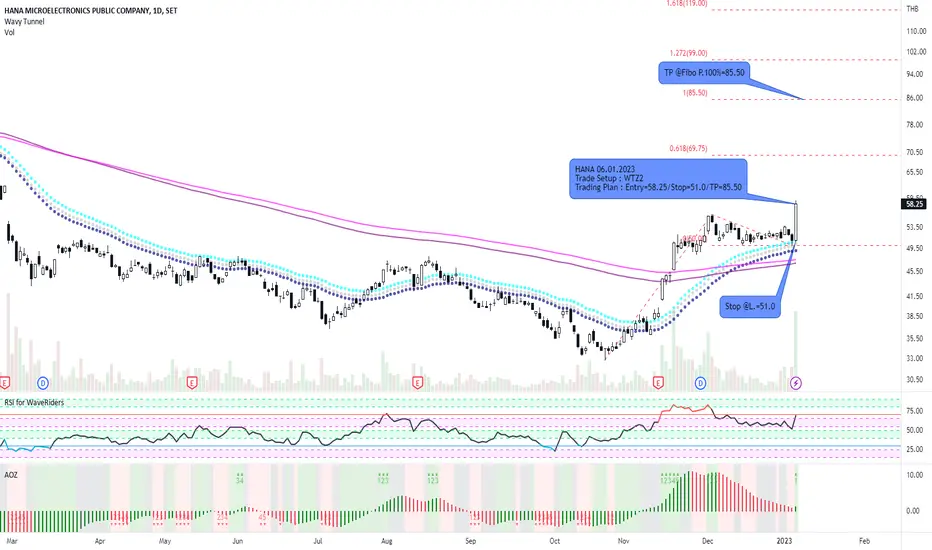
HANA and WTZ2HANA and WTZ2. If applying Elliott Wave, we will notice the complete impulse wave and another corrective wave; thus, the existing leg could possibly another impulse wave or wave 3. I apply WTZ2 for trading as one of my favorite setup. Good Luck!
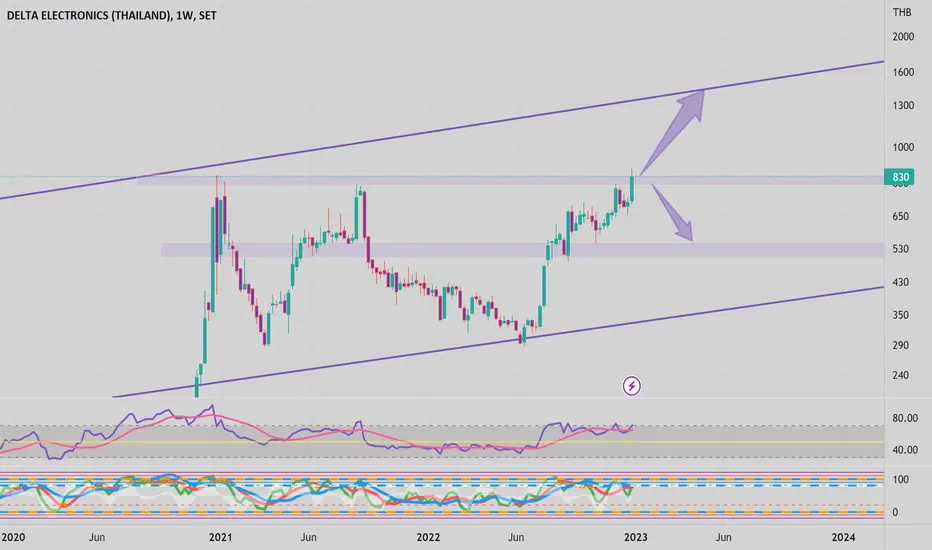
DELTA : Breaking the resistance ?I havnt followed up this one
previously people thought this is like crypto spinning
but now it turns the biggest capital stock of Thailand already
.
Trade safe n fun
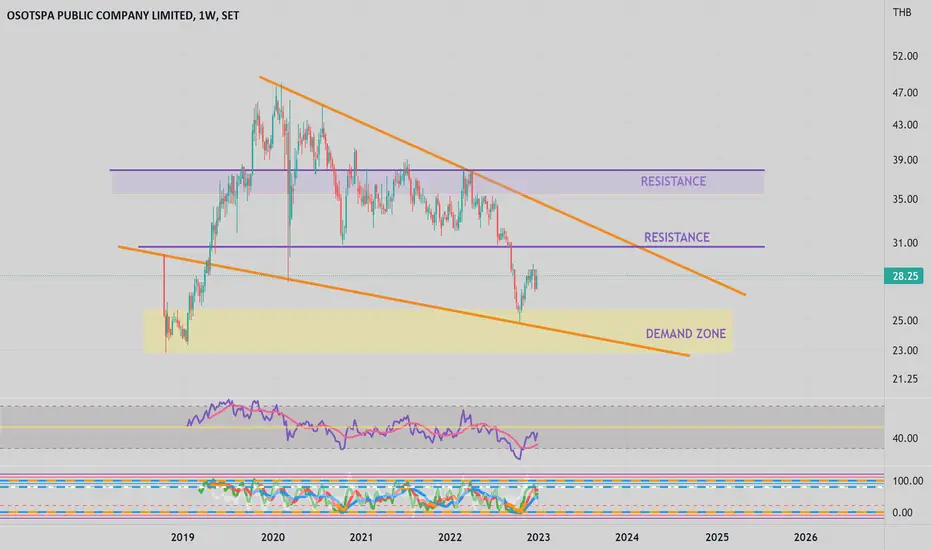
OSP : Collect at demand zoneEverything is on the chart
its interesting to collect at demand zone
and will still be moving in bullish wedge for a while (Orange)
Trade safe and fun ;)
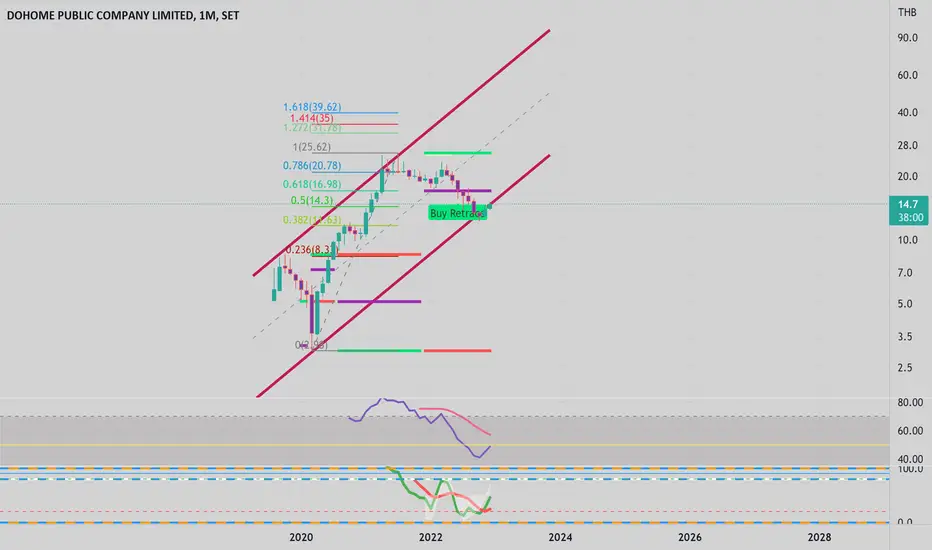
DOHOME : Monthly chart looks greatEverything is on the chart!
16.9 should be next resistance
Trade safe and fun !
------------------------------------
P.S.
Im short term trader
I'm back to stock market (SET : Thailand)
I will post more often
My crypto account got blown from FTX
(that's the only exchange i used)
and i cant make up my mind to get back to crypto yet.
it's quite complicated way of transferring money here n there
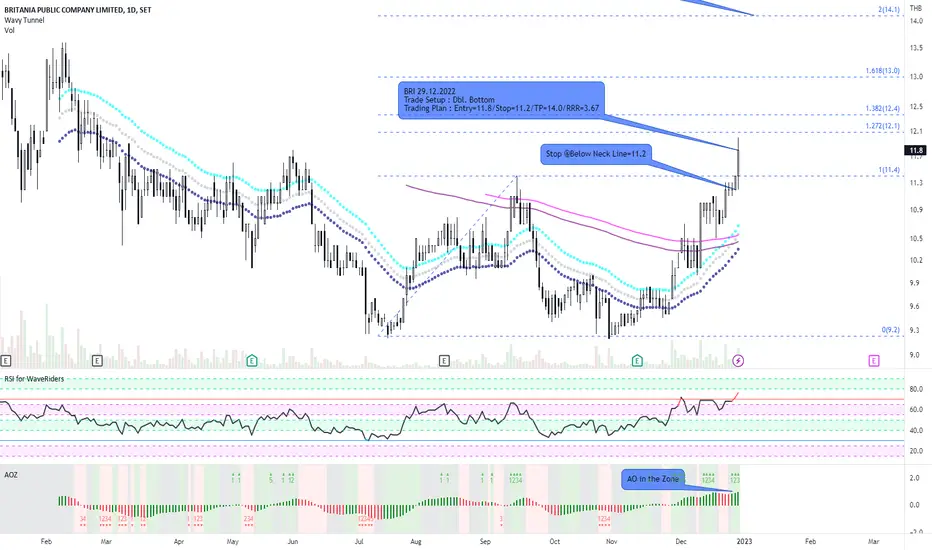
BRI and Dbl. BottomI sometimes prefer trade on price pattern setup, especially profitable entry. I apply Awesome Oscillator for enhancing entry signal on this trading plan. It's another strategic tool. However, don't forget to calculate your risks before trading. Good Luck!