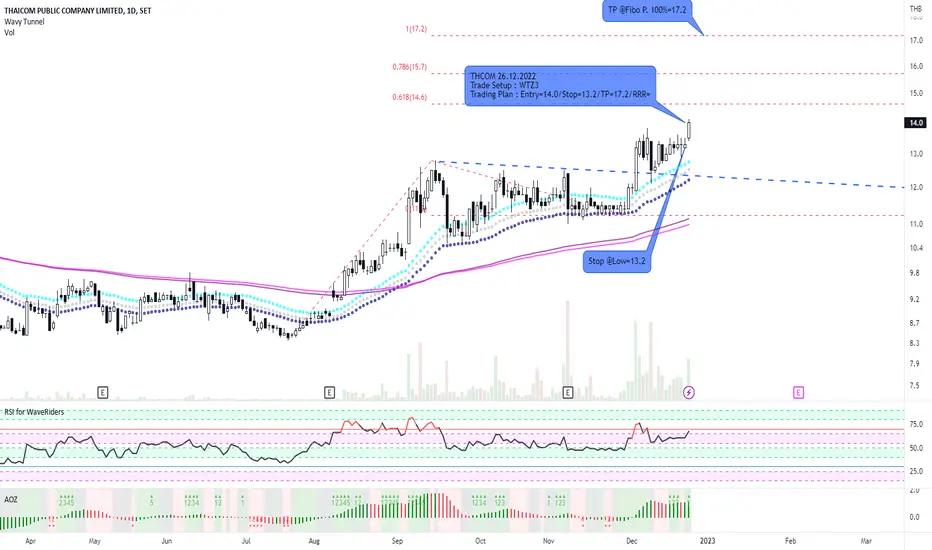
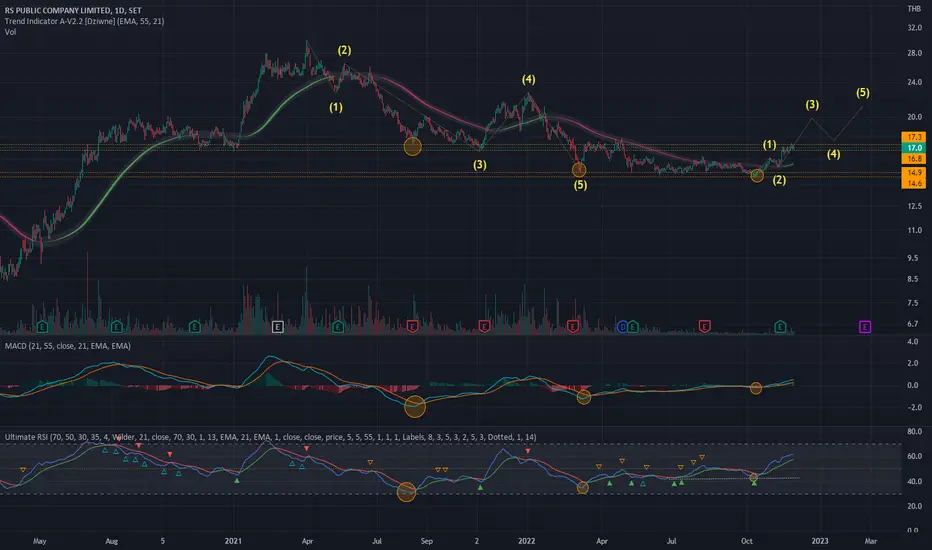
THCOM and WTZ3THCOM and WTZ3 are one of my favorite trade setup. According to its current financial chart, its revenues and profits reflect its chart. Don't forget to manage your risks before trading. Good Luck!
CHAYO and WTZ4+Inverted H&SCHAYO could be potentially traded by WTZ4, one of my favorite Setup, together with price pattern, Inverted Head and Shoulder. Although the setup is so competitive, managing risks is still necessary. Enjoy your trading.


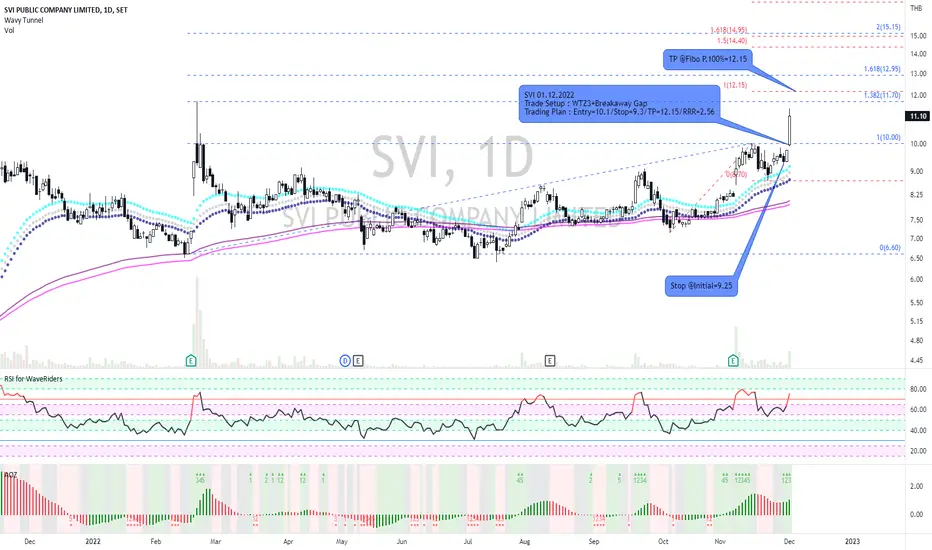
SVI and WTZ3+Breakaway GapSometimes, trading strategy might be simple than you think but it depend on some situations. For SVI, I use WTZ3, another my favorite setup, combining with AO indicator and gap theory for entry signal. It's really simple but practical. However, trading method is important but managing your own risks is still more. Good Luck!
PTTGC with H&S Pattern and WTZ2PTTGC with H&S Pattern and WTZ2. I wait for AO signal for confirmation on the next bar. If the next bar can break out the entry level, it's interesting. If the next bar break out with gap, it's more interesting. Good Luck!
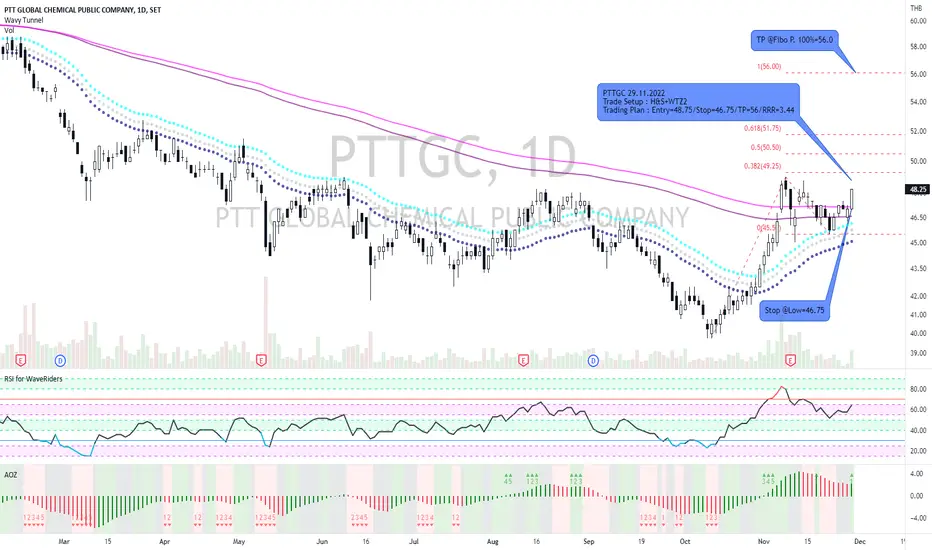
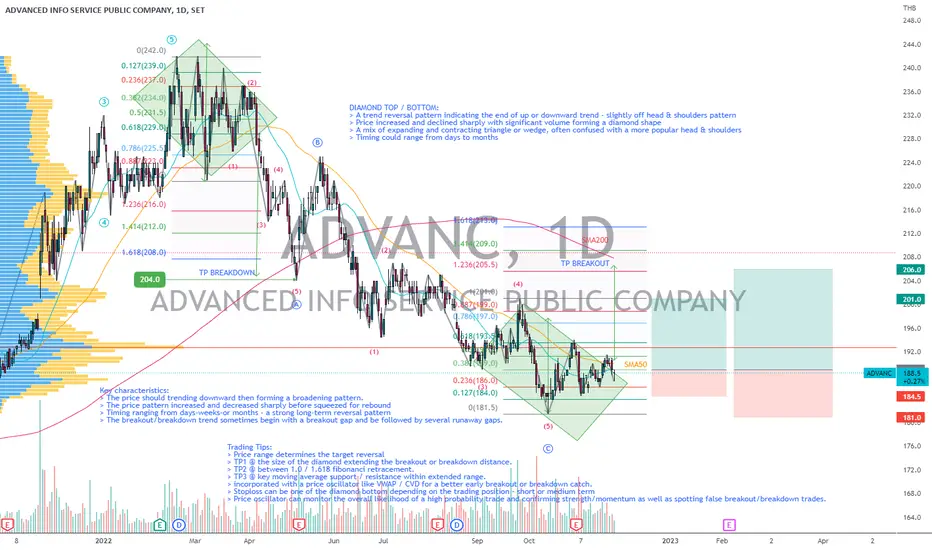
Chart Pattern Review | Diamond Top / Bottom ReversalDIAMOND TOP / BOTTOM:
> A trend reversal pattern indicating the end of up or downward trend - slightly off head & shoulders pattern
> Price increased and declined sharply with significant volume forming a diamond shape
> A mix of expanding and contracting triangle or wedge, often confused with a more popular head & shoulders
> Timing could range from days to months
Key characteristics:
> The price should trending downward then forming a broadening pattern.
> The price pattern increased and decreased sharply before squeezed for rebound
> Timing ranging from days-weeks-or months - a strong long-term reversal pattern
> Most trends will begin with a breakout gap and be followed by several runaway gaps.
Trading Tips:
> Price range determines the target reversal
> TP1 @ the size of the diamond extending the breakout or breakdown distance.
> TP2 can be targeted between 1.0 / 1.618 fibonanci retracement.
> TP3 @ key moving average support / resistance within extended range.
> Putting the chart together with a price oscillator like VWAP / CVD for a better early breakout or breakdown catch.
> Price oscillator can monitor the overall likelihood of a high probability trade and confirming strength/momentum as well as spotting false breakout/breakdown trades.
Always trade with affordable risk and respect your stoploss, nothing 100%
Good Luck!
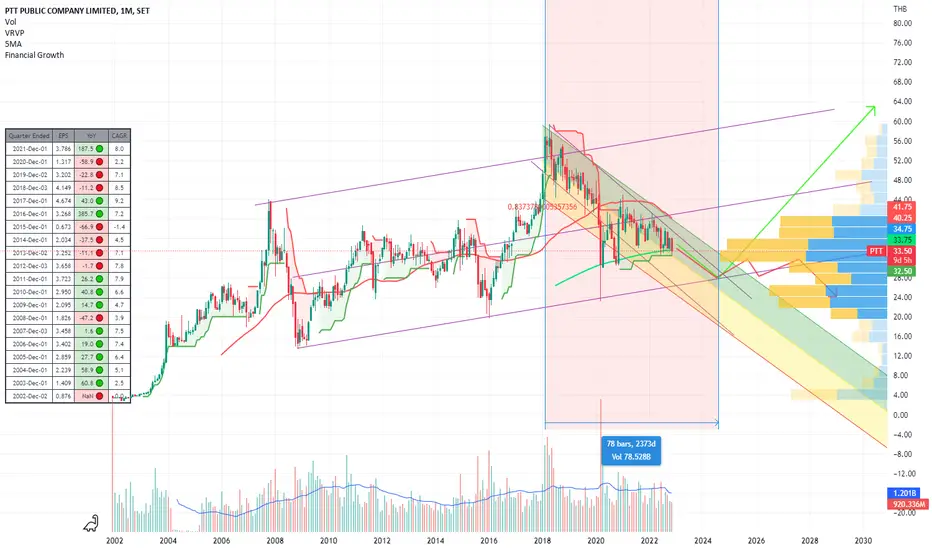
PTT : A long side way down to nowhere!!PTT has a long down trend since it historical high.
I will wait until end of first half 2024.
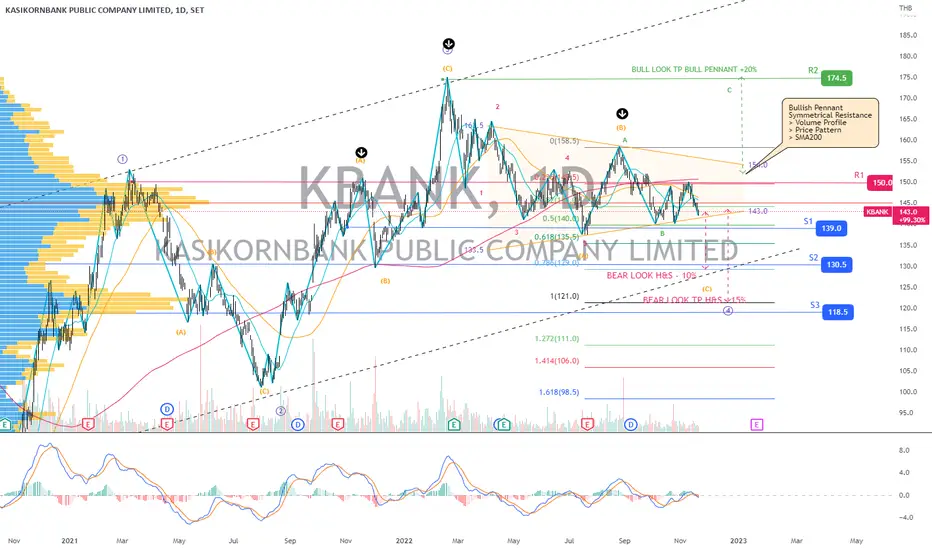
KBANK | Wave Analysis | Bearish Projection Diagonal 4-wavePrice action and chart pattern trading
> A 2 conflicting pattern with a bearish move from the larger Head & Shoulders pattern and a bullish one with current bull pennant.
> The larger HS pattern could be overshadowing the smaller pennant pushing the price lower - SMA20 dead crossed SMA50.
> A strong symmetrical resistance; upper volume profile, price resistance, and SMA200.
> This 4-wave diagonal projection is based on the unsuccessful breakout scenario with an upcoming C leg downtrend extension 0.786 - 1.0 approximately - 10 - 15% downside.
> A bullish scenario is based on the successful breakout of bull pennant and SMA200 targeting the previous 3-wave high with a +20% upside.
> Indicator: bearish MACD signal crossing below the signal and baseline
Always trade with affordable risk and respect your stoploss!
PTT | Wave Projection | Bullish Flag - Bullish Divergence Price action and chart pattern trading:
> A possible upcoming short term rebound B-wave of mega bullish flag 2-wave ABCDE triangle correction
> The price made LL last week from 34 baht support, assuming minor 5-wave of A leg to 32.75 baht then a strong buy back signal with bullish engulfing candlestick.
> Entry signal @ breakout recent resistance 33.75 baht
> Stop @ the current low 32.75 baht -3%
> Target 0.618 - 0.786 retracement 36-37 baht +8-10%
> RRR: 2.5:1

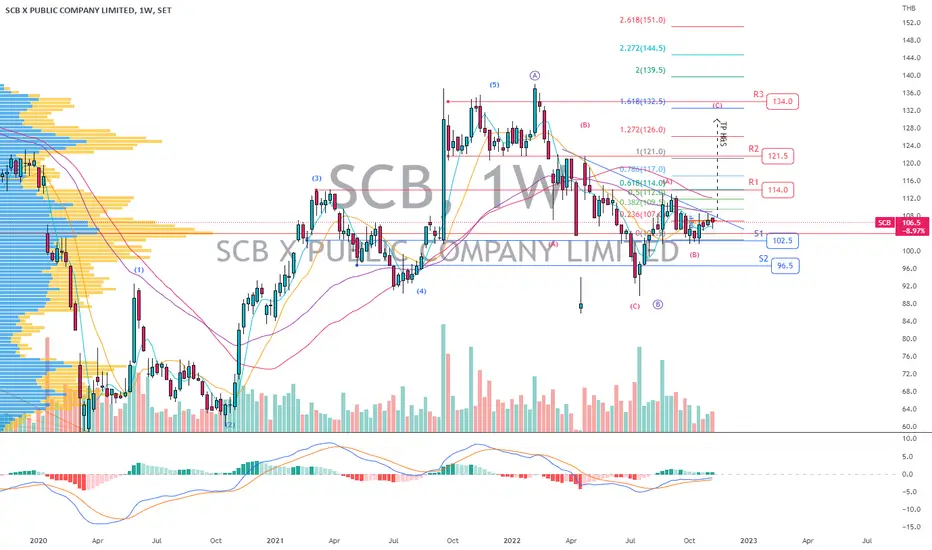
SCB | Wave Projection | ABC Target Bullish Pennant +22%Price action and chart pattern trading:
> The price during last few weeks squeezed just under EMA200D with a series of bullish candlestick pattern
> A possible ABC uptrend wave with bullish pennant pattern target +22% at TP3 1.618 fibonanci extension.
> Support @ S1 -7% and S2 -10% downside
> Risk reward ratio: 2:1
> MACD squeezed momentum under the baseline
Always trade with affordable risk and respect your stoploss

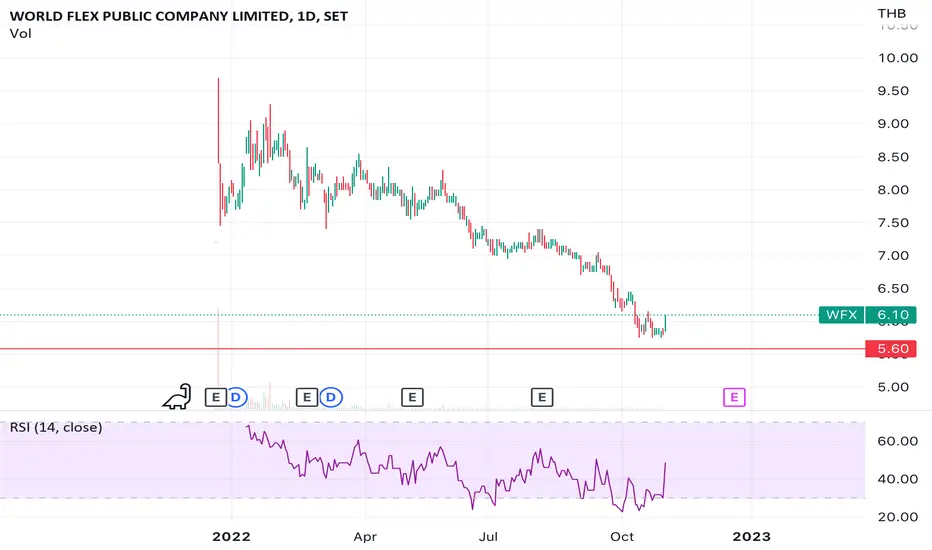
WFX Fair price 5.00-5.6WFX Fair price 5.00-5.6, Add to our list, Wait and See how bid offer do everyday
TU | Wave Projection | Bullish Dragon Pattern +25%Price action and chart pattern trading setup:
> A bullish dragon pattern with an uptrend ABC wave currently making a pullback to the rising channel support at the volume profile point of control
> The price is below key dynamic support SMA200 and SMA50 which is considered a downtrend movement or could just be a false break dump and pump
> Entry @ SMA50 and SMA200 breakout zone once the price recovered
> Stoploss @ B wave position -7% downside
> Target @ 1- 1.618 extension dragon head & shoulder zone
Always trade with affordable risk and respect your stoploss