GPSC | Wave Projection | Bullish Dragon Flag SetupPrice action and chart pattern trading setup
> Bullish Dragon pattern in correction wave A, possible reversal for uptrend wave B
> Entry @breakout channel dragon ridge
> Target @ 0.618 retracement of previous top SMA200 zone
> Stoploss at the low A position - RRR: 2:1 downside -7%
Indicator:
> MACD bullish divergence signal crossing up baseline 0.

AVC Just rebound, It has the sideway channel and already test previous heigh. 2 way for this. First, retest heigh and breakout. Second fall down to support line. 40/60

BBGI | Wave Projection Dragon Pattern - Bullish divergencePrice action and chart pattern trading setup
> An impulse downtrend Elliott Wave channel with a dragon pattern forming rear legs
> possible upcoming bullish divergence signal at the next support 8.00 baht targeting 2.618 extension
> Entry @ dragon ridge breakout
> Short term target @ previous wave 4 position
> Medium term target @ wave 1 and wave 2 position + 15 - 20% upside
> RRR: 2:1 for short term and 3:1 for medium term trade
Always trade with affordable risk and respect your stoploss

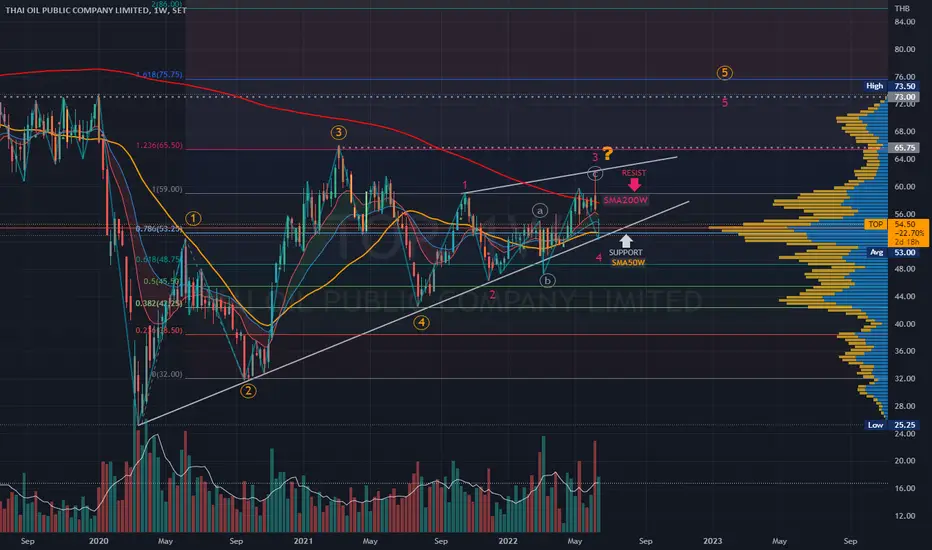
TOP | Wave Projection - Leading Diagonal Trading SetupPrice action and chart pattern trading
> Leading diagonal - contracting triangle pattern
> Entry @ triangle support
> Target @ Wave 3 position + 20% upside for short term trade
> RRR: 2:1 with -10% downside
> Long term trading target primary wave 5 at 1.618 extension zone at 75 baht +40% upside
Always trade with affordable risk and respect your stoploss
GULF Energy Energy stock is the growth stock in my country lol. With the strong fundamental and political background, I would be waiting for the accumulation zone but the board keeps buying back their stock right now .. So, fundamentally the price may not retrace to the zone.
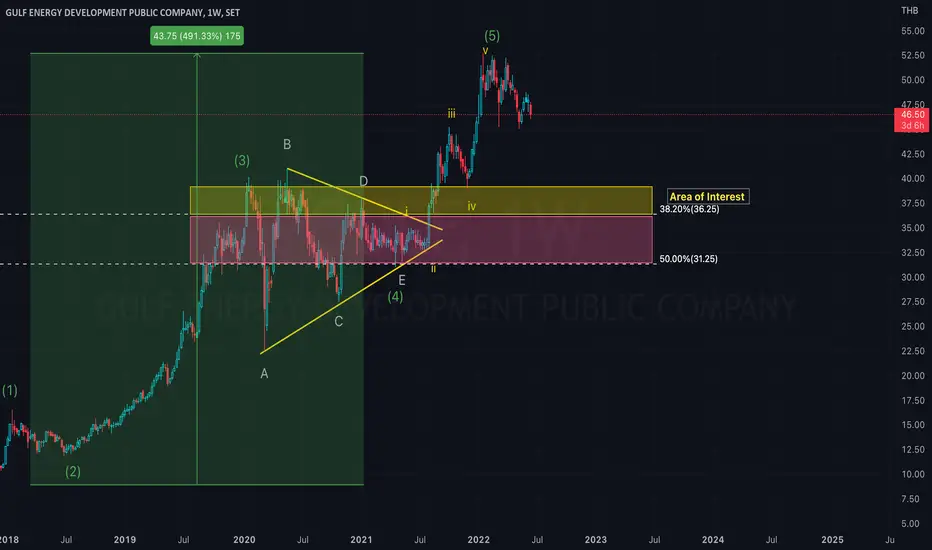

B | Wave Projection | Downtrend channel breakout Price action and chart pattern trading setup
> ABC Zigzag wave correction with a breakout at wave 4 downtrend channel
> Target downtrend zone at Fibonacci 1.0 extension - 0.45 baht price
> A possible upcoming bullish divergence for wave 5 with ending diagonal pattern
> Wait for retest at the low position?
always trade with affordable risk and respect your stoploss

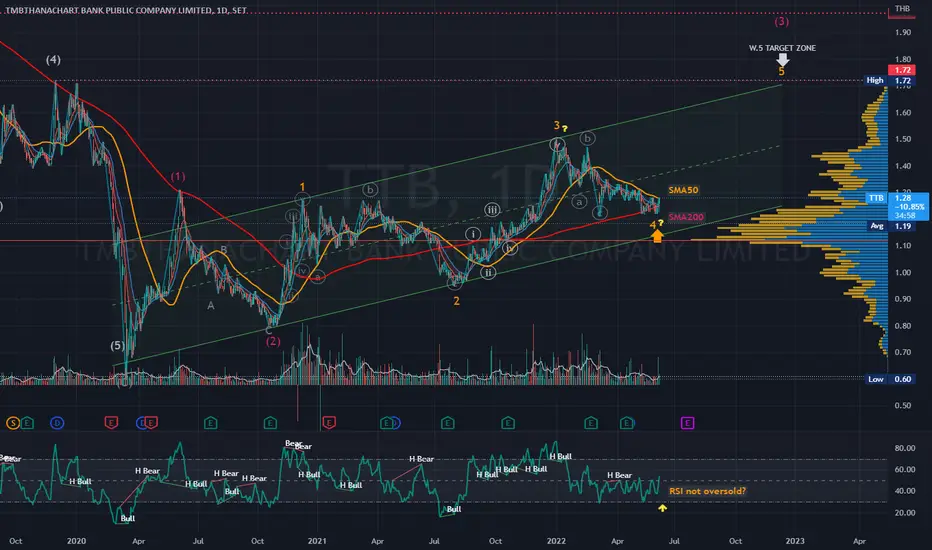
TTB | Wave Analysis - Possible Target DowntrendPrice action and chart pattern trading
> A possible target downtrend is within the range at SMA200 zone
> Wave 4 Zigzag family ABC currently retraced 0.5 Fibonacci of wave 3 which slightly overlapped with wave 1 is still valid.
> Long Entry @ SMA50 breakout zone as dynamic wave resistance
> Stoploss @ the lowest position of wave C- 5-6% downside
> 1st target at the high Wave 3 position + 15 -20%: RRR: 2.5:1
> Wave 5 uptrend target estimated at the channel upper resistance zone, targeting at 1.618 extension of Wave 1 - 1.60 - 1.70 baht
Always trade with affordable risk and respect your stoploss.
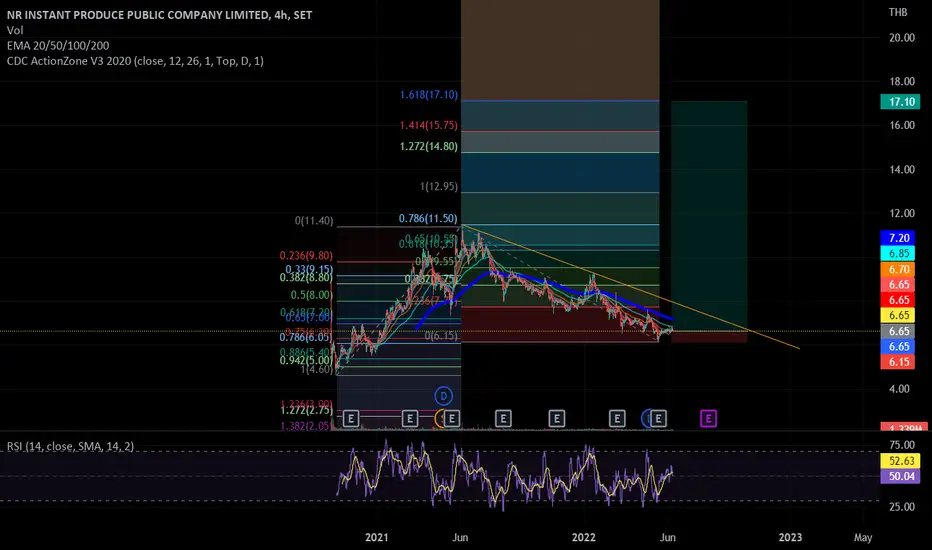
NRF Plant-Based Food Are Trend Ethnic Food
OEM Ready-to-eat
Functional Products
Plant-Based Food Are Trend
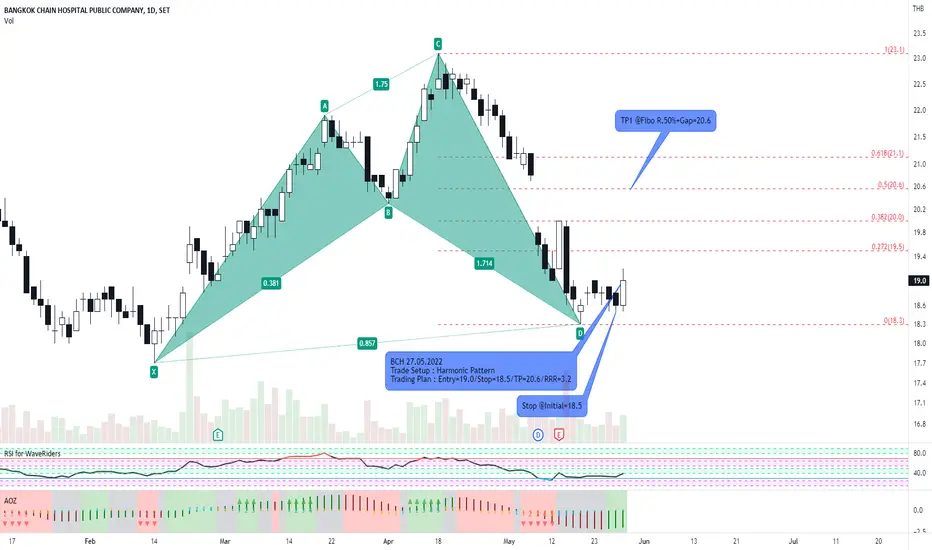
BCH with Harmonic PatternHarmonic is everywhere. No matter what the pattern is but competitive order is more important. Enjoy your trading.
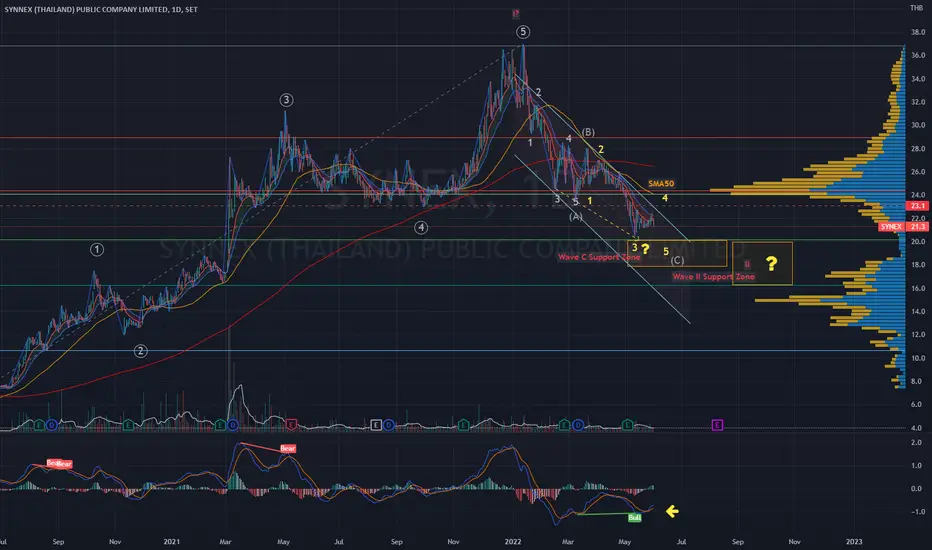
SYNEX | Wave Analysis - Bullish Divergence Ending Diagonal?Price action and chart pattern trading
> A potential downtrend wave C leading to an ending diagonal with the first MACD bullish divergence
> Long Entry - wait for Elliott Channel breakout to confirm the end of the downtrend
> Target Wave 4 rebounded at SMA50 Zone
> The target wave 5 downtrend at support Wave C and Wave II zone are closed in range.
Indicator:
MACD - first bullish divergence
Always trade with affordable risk and respect your stoploss
PTTGC | Wave Analysis | Downtrend Target Wave II ProjectionPrice action and chart pattern trading
> ABC correction wave 2 is around the corner within the zone 0.5 retracement of wave I.
> The current wave C extended 1.213 of wave A
> Upcoming Elliott Channel breakout to confirm end of downtrend correction
> Long Entry @ Channel breakout near SMA50 zone
> Short-term target at SMA200 / Volume Profile Point of Control
> Medium term trade target at 0.786 - 1.0 Wave I position
> Stoploss at the lowest point of Wave C zone
> RRR: 2:1 for short term and 3:1 for medium term trade
Indicator:
RSI above 50 with bullish divergence signal
Always trade with affordable risk and respect your stoploss.

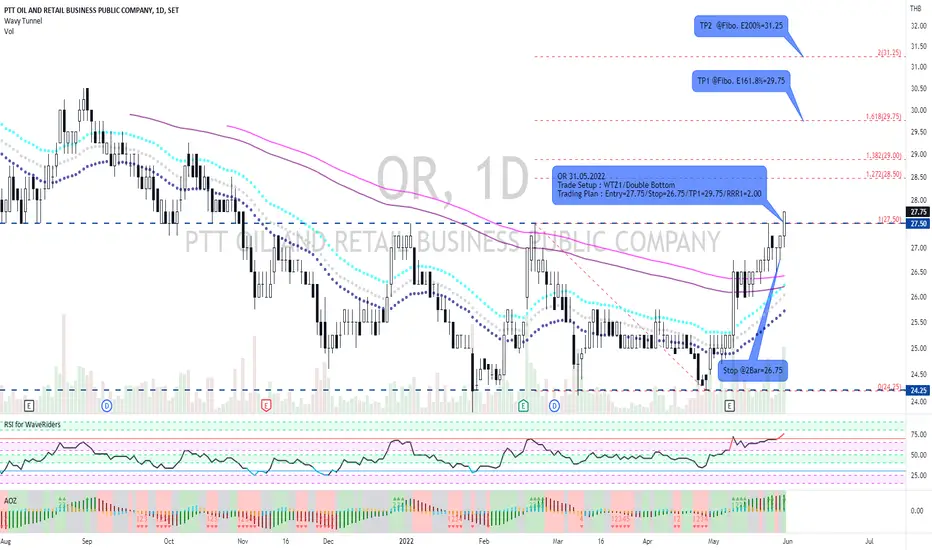
OR and WTZ1+Dbl. Bottom Trade SetupMost investor's favorite IPO just broke out the trading range today perfectly. I apply WTZ1 together with double bottom price pattern as the trade setup with described the trading plan. Just take a look and prepare your own plan. Good luck
GPSC and TD Sell Setup not Break TDST L.GPSC is still moving in downtrend although it rebounded during previous weeks. However, it's interesting when TD sell setup is counted and unable to break TDST Level. That's supposed the stock is still moving in the same trend. The previous low is expected as the target price while another side of wave line is applied for stop loss. Enjoy your trading.

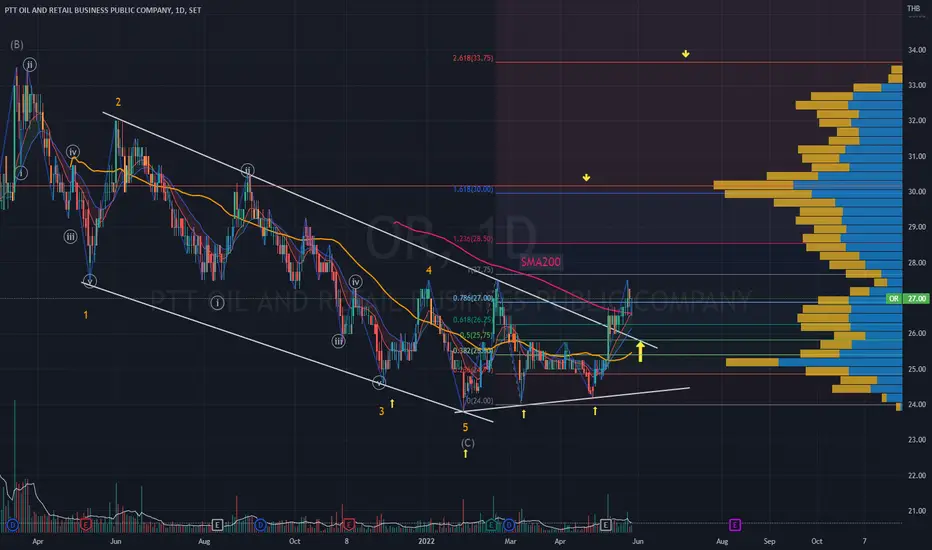
OR | Wave Analysis Mapping- Channel Breakout - Pullback TradePrice action and chart pattern trading
> Elliottwave downtrend channel confirmed breakout crossover SMA200 heaven/hell line - RSI TFD already overbought - Pullback trade for medium-term is recommended
> Target @ volume profile POC 1.618 extension zone and 2.618 zone for 2nd target
> Stoploss @ Wave 5 zone Inverted Head or right Shoulders
> RRR: 2:1 downside less than 10%
Always trade with affordable risk and respect your stoploss
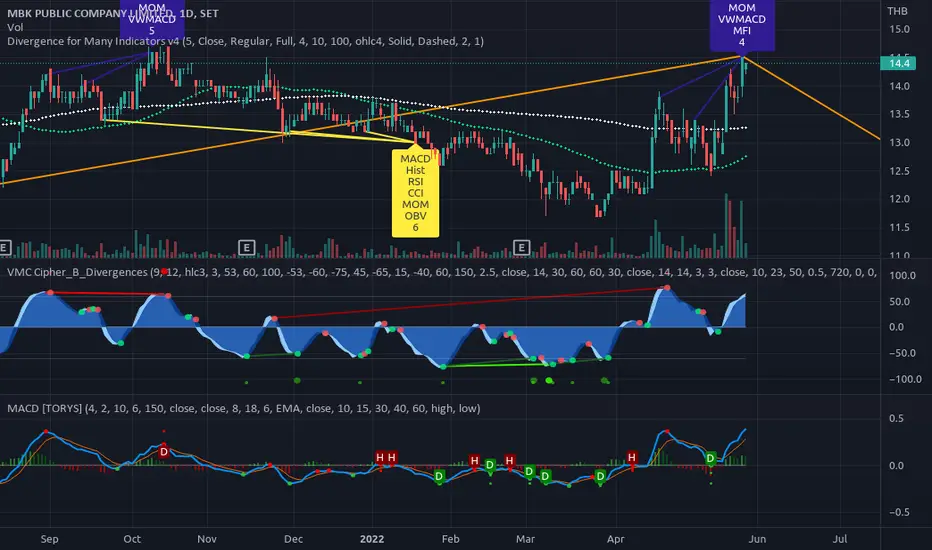
MBK Intermediate Negative Down TP@12.8Intermediate Negative Down TP@12.8
Investors should be cautious about any and all stock recommendations and should consider the source of any advice on stock selection.
The information and publications are not intended to be and do not constitute financial advice, investment advice, trading advice.
BDMS | Bearish Divergence - Ending Diagonal Limited UpsidePrice action and chart pattern trading
> A Rising Elliott channel pattern with bearish divergence indicating limited upside for ending diagonal
> Minor wave 5 estimated at 1.618 retracement of wave 4 | 28.00 - 29.00 baht zone
> Take profit at the upper resistance zone
Always trade with affordable risk and respect your stoploss

INSET | Downtrend Elliott Bullish Flag - Ending DiagonalPrice action and chart pattern trading setup - short term trade
> Downtrend Bullish Elliott Flag - Ending Diagonal Pattern
> Entry @ Pullback EMA10 - 20 zone
> Target @ upper flag resistance zone / SMA50
> Stoploss - the lowest position of wave 3
> RRR: 1.5:1 short term trade
Indicator:
> Smart money volume support
> Banker chip entry signal
> BBD bullish divergence signal golden cross baseline
> KDJ stochastic strong uptrend momentum
Always trade with affordable risk and respect your stoploss

AS- Bearish DivergenceAn example of Bearish Divergence pattern. Higher high on price and lower low on MACD.

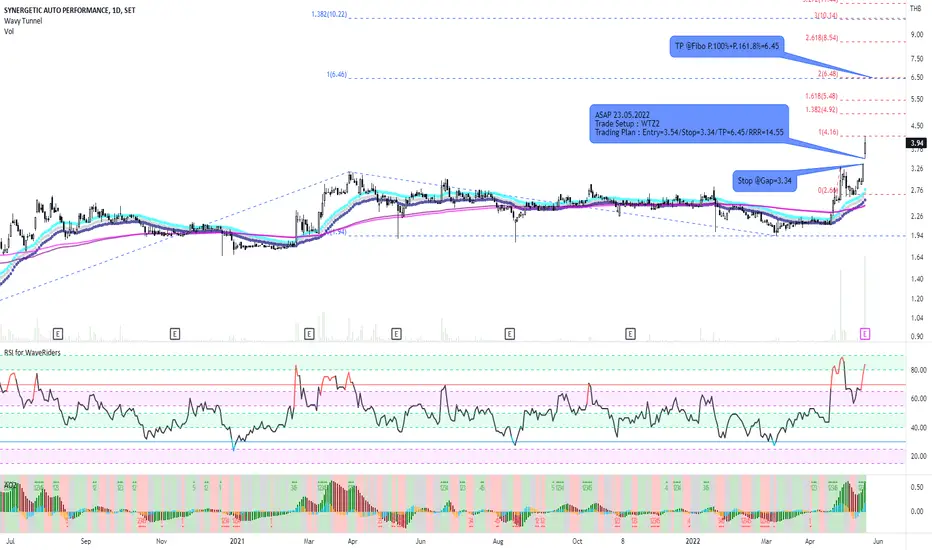
ASAP and WTZ2 trade setupFor ASAP, I'm lucky to entry position with negotiable price. So, risk reward ratio of this trade is so competitive and easy to hold the position.
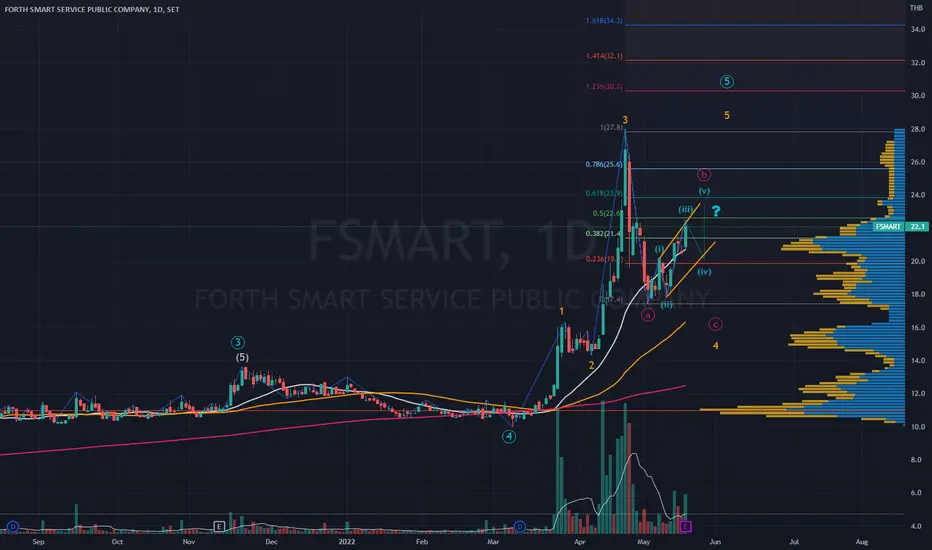
FSMART | Wave Projection - Uptrend TargetPrice action and chart pattern trading
> Current uptrend channel of diagonal sub-wave 3 progressing to the Intermediate Wave B just above SMA20
> Estimated Intermediate wave B at 0.618 - 0.782 retracement zone of previous wave A - price range 24 - 25 baht