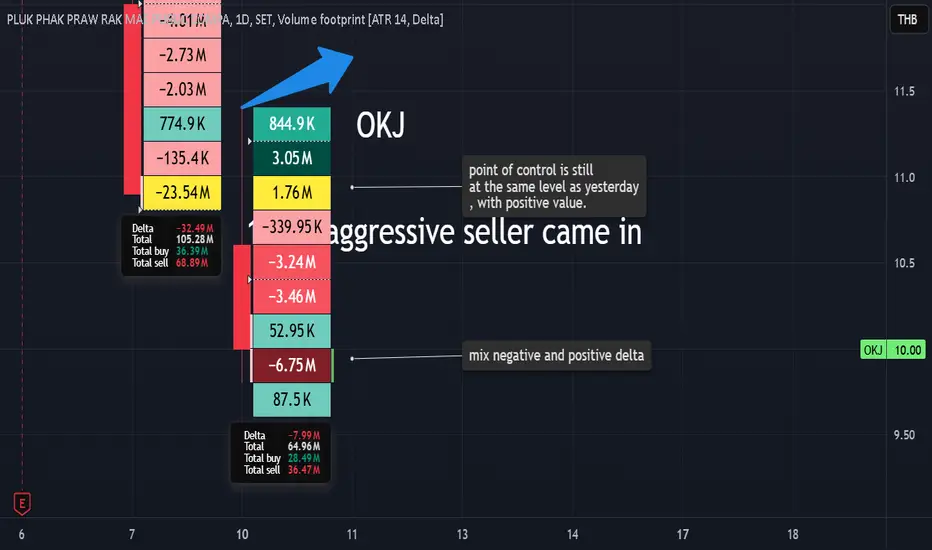
Second Day of Strong Selling in OKJ, but Signs of Optimism !!!
Today is the second day of strong selling in OKJ, but there are several promising signs:
- The Point of Control (POC) remains at the same level as yesterday and shows a positive delta (more buying than selling).
- Despite the red candle, the lower spreads contain a mix of positive and negative deltas, indicating buyers come in.
- The price should have stayed around 10.7, but at 16:30, a big, and aggressive seller entered, dragging the price down to 10.0. but many buyers were waiting to absorb the selling pressure along the way.
I remain optimistic about OKJ. !!!
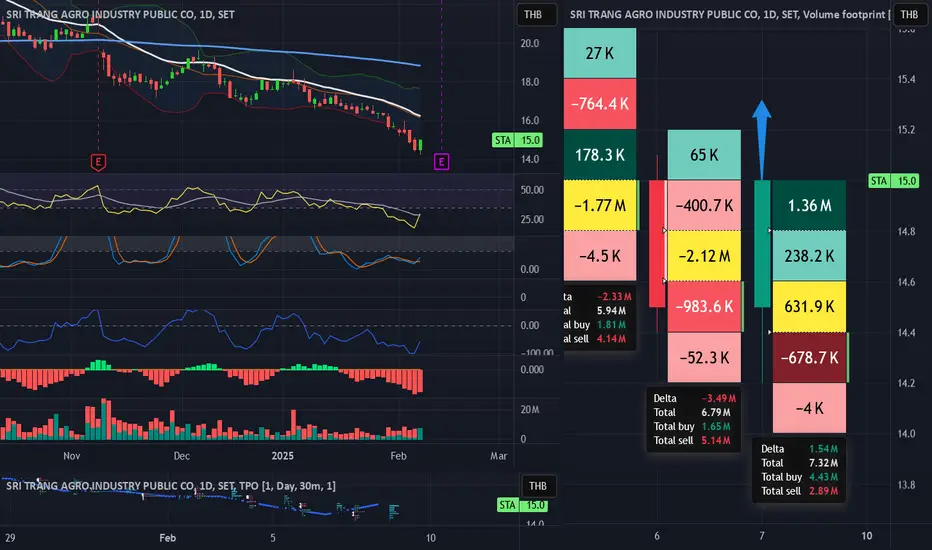
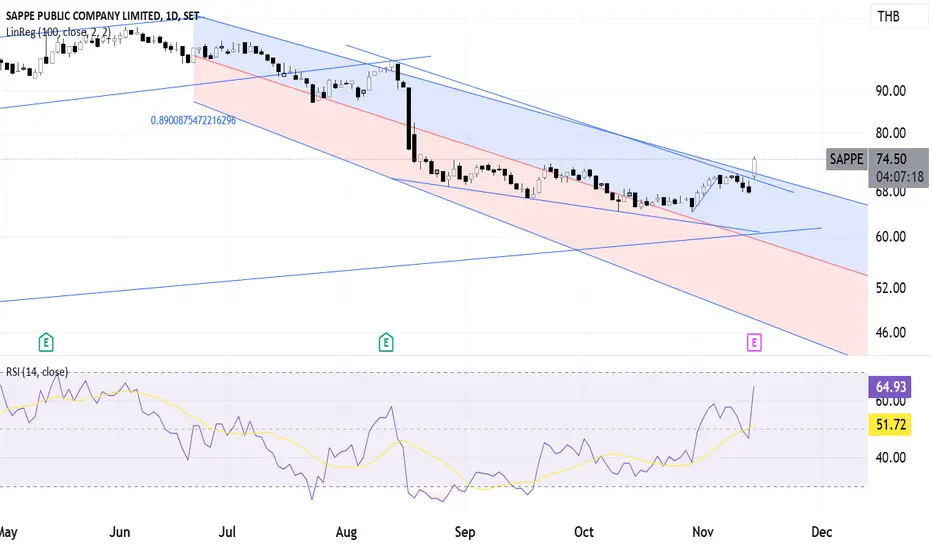
STA has a change to going up again, after a long way down.Support: 14.6
Stop loss: 14.4
if on Monday 10th Feb , opening price is equal or greater than 14.4, it will be a great chance that STA will going up, at least to test the EMA25.
Momentum and volume profile on Fri, 7 are very promising, with buyer comes to the place.
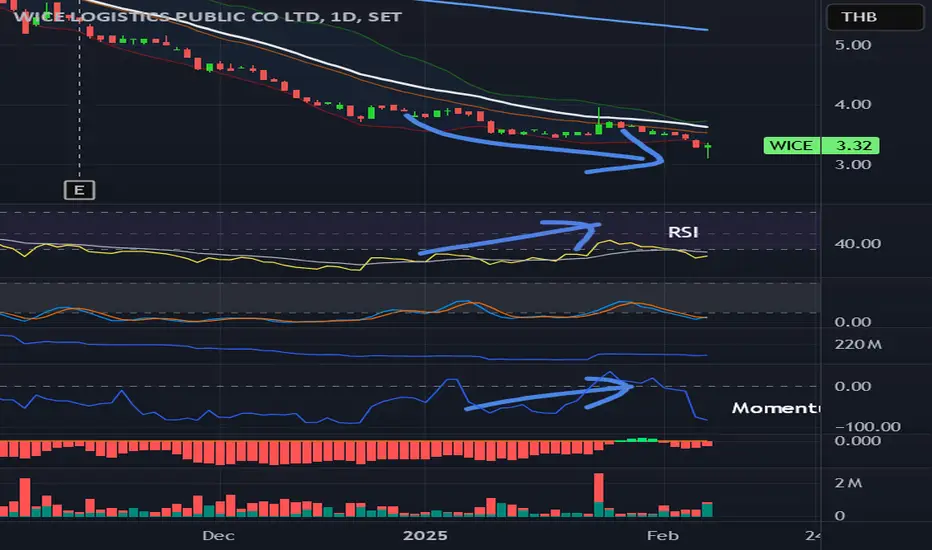
WICE is going up to test EMA25 for a new round.Support 3.28 , stop loss 3.20
from this day graph, rsi and momentum have shown divergent trend since new year, with the latest long lower wig with almost all are negative delta values with ask imbalance on the side.
IMO, 3 positive deltas make it not that bull, but overall chance will be going up anyway.
TLI wait for upward break out.TLI wait for upward break out. Fundamental Ok.
Now pennant wait for upward break out strong buy.

Corrective Wave and Chart Pattern Analysis - RSI TFW DivergenceCorrective Wave Structure a ABC Analysis pattern in TFW timeframe
Observations:
A bullish divergence is evident in the momentum near the support zone indicating weakening bearish momentum, the end of wave C, and a potential reversal to the upside.
Analysis:
- Wave A: completed descending channel retraced 61.8% of previous uptrend with 5 wave diagonal pattern - wave A.1 the shortest and wave A.3 is the longest.
- Wave B: retraced 61.8% of Wave A with an extended flat 3 wave abc pattern - wave B.c extended 261.8% of B.a
- Wave C: A descending triangle /ending diagonal pattern is visible within Wave C current extending 61.8% of Wave A.
Support:
- The Green zone (liquidity support) around 4.50 THB is significant, acted as a strong support level multiple times in the past.
- A breakdown below this zone could lead to further downside (red arrow scenario) while holding above it might trigger a reversal (green arrow scenario).
Breakout:
- Resistance levels marked by Wave B’s high 6.4+ THB and intermediate levels around 4.9+ THB are critical breakout moving average 20 week dynamic resistance zone.
- An upward breakout past these levels would confirm the end of the corrective phase and the start of a new bullish impulse wave.
Potential Scenarios:
Bullish Case (Green Arrows):
TP1: Price holds the liquidity support zone and breaks above 5.50 THB (near-term resistance).
TP2: A successful retest of 6.50 THB Wave B zone could lead to a new bullish wave formation.
RRR: 3:1
Bearish Case (Red Arrow):
A break below the liquidity support zone 4.50 THB would confirm continued bearish pressure.
Price could target lower levels, possibly extending toward 3.50 THB or beyond.
Action:
+ Look for bullish confirmation with a breakout above descending triangle (ending diagonal) resistance 4.80 THB zone
+ Watch for volume surge volume profile indicator to validate the reversal trigger.
+ Monitor price action near the liquidity support zone 4.50 THB.
+ Accumulate only if the support holds and momentum confirms a bullish reversal.
Always trade with affordable risk, respect your stop.

SCB BUY Buy SCB
Price Stand Over Supply Zone Month.
Buy Price 118 THB
If price Close Under 118 THB Cut loss.

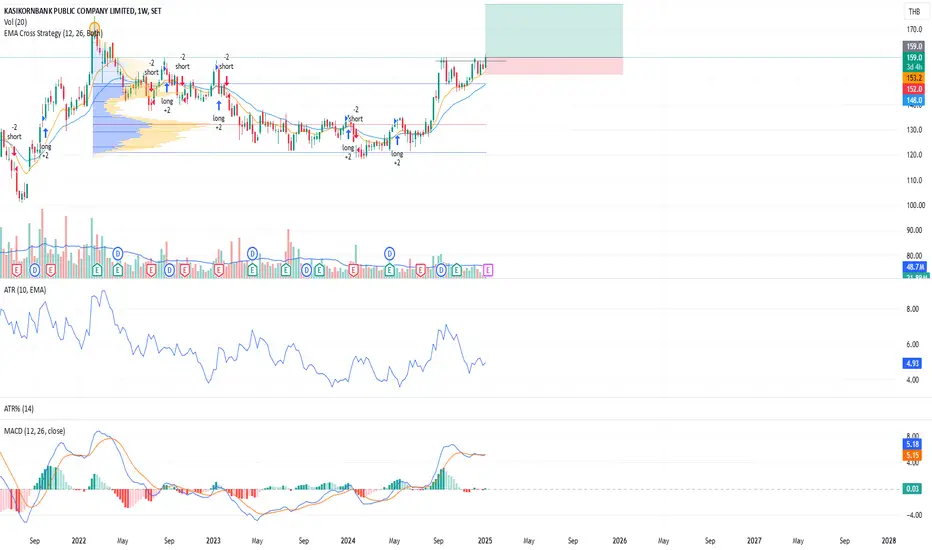
Price is About to Breakout the Major High with EMA Signal SupporBoth EMA12 and EMA26 in the weekly and monthly timeframes are showing bullish signals. Prices have been consolidating for 1078 days, indicating a potential breakout. Since September last year, volumes have decreased, suggesting a buildup of pressure. Currently, the price is breaking through a Low Volume Node (LVN) area to the left, which could lead to a significant move upwards.
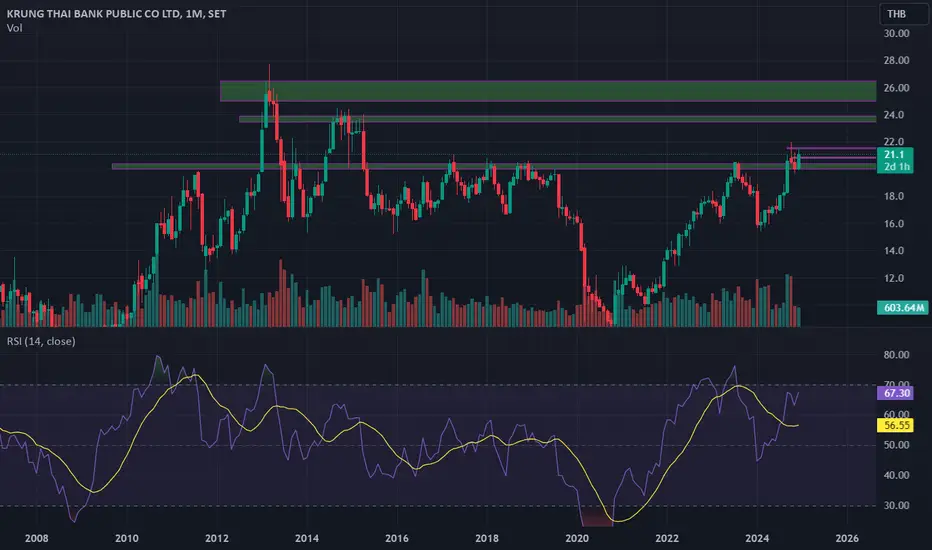
Buy KTBBuy KTB
Price Stand Over Months Resistance
Buy 21.60 if price stand with A day candlestick confirm (Day)
Or 20.90 - 20.80 (Sub Demand Zone)
Or Buy Next Demand Zone Buy 20.40 - 20
Price Below 19.80 Sell
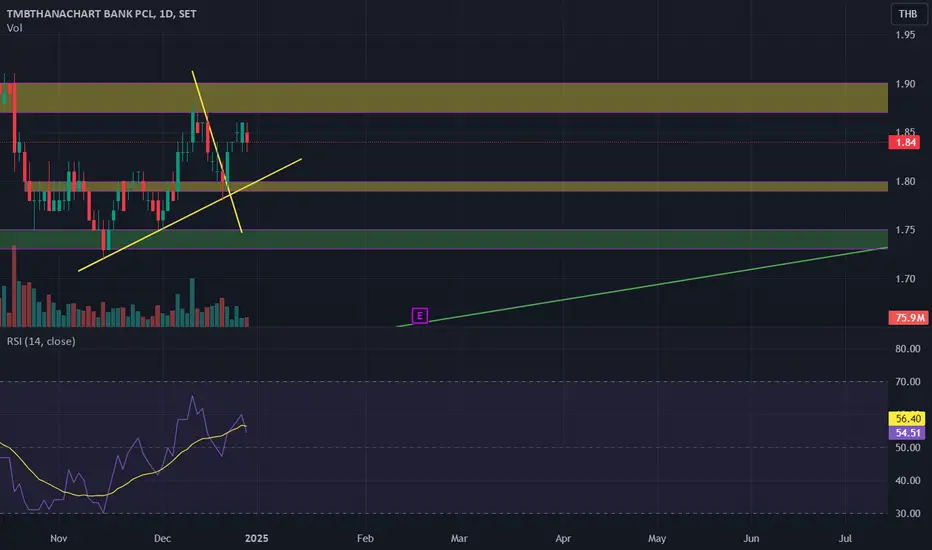
TTB THANACHART
TTB THANACHART
Price Close 1.48
Buy 1.88 Next Resistance is 1.90
Or Buy Zone Is 1.80 Next Demand is 1.75
If Price Low Then 1.75 Sell
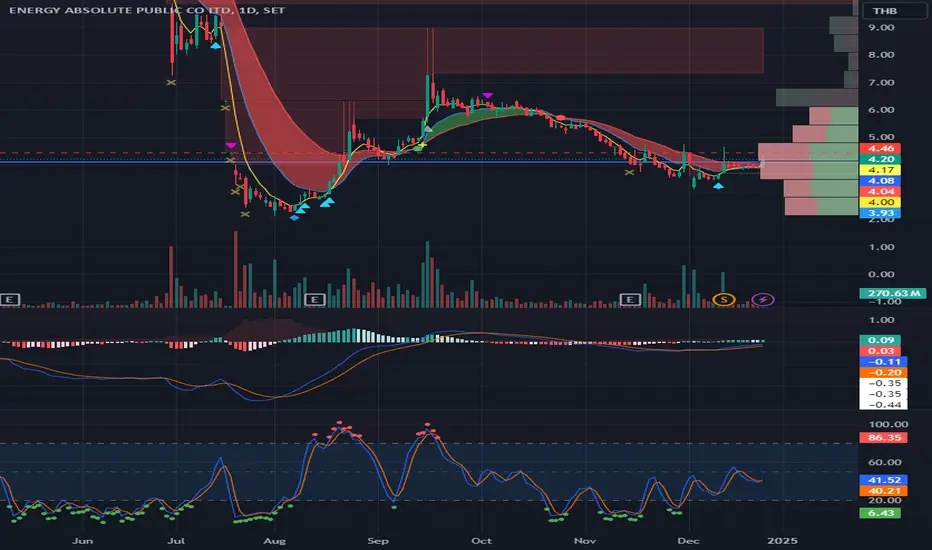
Analysis on EA: Time to betHi all
From the chart, it is making a higher low.
and now it broke the small consolidation.
I think it is a right time to keep your eye on this stock again
note: not investment advice, make you own final decision.
best regards,
trader pP
BCP Long Trade Setup – Potential Bounce from Swing Lows
📉 Stock: Bangchak Corporation PCL (BCP)
💰 Current Price: 29.50 THB
📊 Trade Idea:
Price is currently trading near swing lows around the 29 THB zone, shown in the blue highlighted demand zone. Historically, this level has acted as a strong support, with prices bouncing to the upside after touching this zone.
If the pattern holds, I anticipate a bounce from this level, providing a potential upside opportunity with profit targets at:
1. 📈 32 THB
2. 📈 33 THB
3. 📈 34 THB
4. 📈 39 THB
This setup offers a favorable risk-to-reward ratio with clear levels to capture profits as the price rises.
⚠️ Stop-Loss: Consider setting a stop-loss below the swing low to manage risk in case the support fails.
🚨 Disclaimer: This is not financial advice. Please do your own research and consult a financial professional before making any trading decisions.
Let’s see if this support holds! What are your thoughts on this setup? 💬
#BCP #Bangchak #TradingView #ThaiStocks #SwingTrade #SupportAndResistance #TradeIdeas

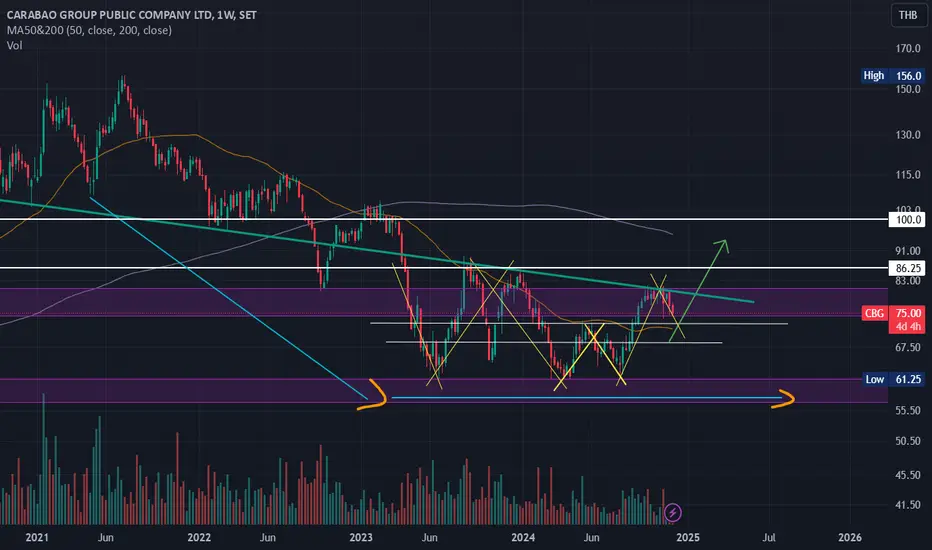
Carabao Group ( $CBG )Carabao Group's valuation and earnings have narrowed compressing its multiple. This is mainly because its stock price went through a euphoric phase which coincided with a global market blow off top in 2020-2021.
The stock price overshot and has been compressing while the company tries to grow into its high multiple. What we have seen is a trend reversal from its high of +- 158 baht
The downtrend and its counter rallies were sold off as profit takers took gains and while many others panic sold who bought at the top, this was done to cut losses, by selling into counter rallies. ( which we can see in its downtrend). We have these peaks and then sharp sell offs.
This has caused downward pressure in the share price and has led to constant sell offs at key resistance areas, meaning people who have been waiting to get out now decide to sell.
This speaks to the dangers of buying a good company, but at overpriced levels. ( at some point valuations matter)
However,
What we are seeing now is a slowing in the momentum of sellers, indicating exhaustion and a potential trend reversal to the upside. The triple bottom at a significant support adds to this.
Carabao now looks to be building a base above 60 baht, and although there is still some selling pressure at 80baht, and we could still see a retest back down to 69 baht, it would be healthy and most likely a good entry point. We could see the stock trading between 80baht-100 baht again by Q1 of 2025.
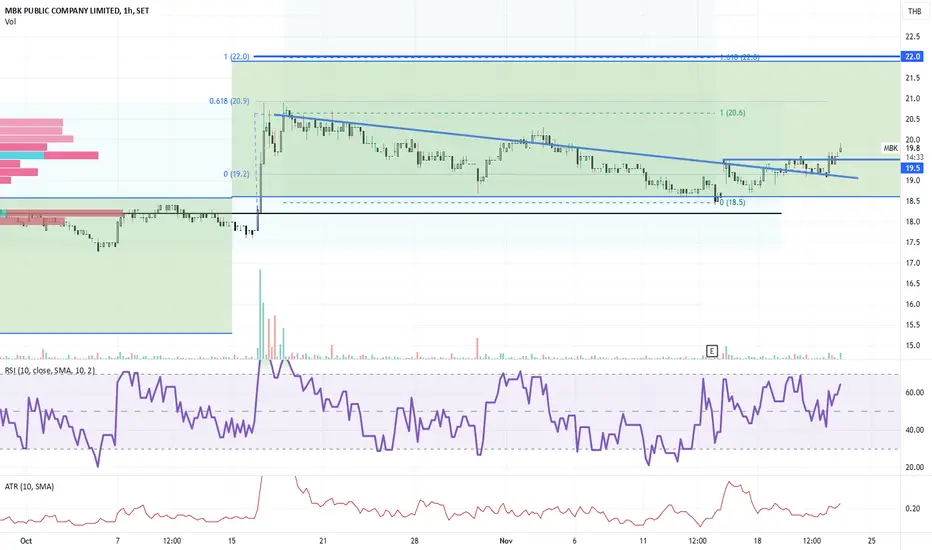
MBK - Triangle BreakoutMBK - Triangle Breakout
Buy signal on Breakout and Buy on dip
TP 22.0 as 100% Extension which is equal to the height of previous box
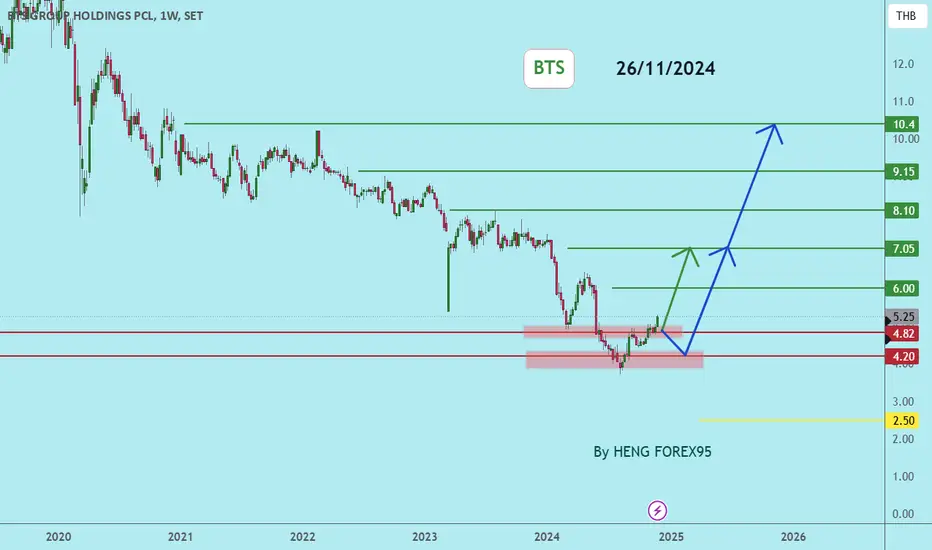
BTSBTS price is in a downtrend. Now the price is near the important support zone 4.82-3.80. If the price can stand above 3.80 baht, it is expected that there is a chance that the price will rebound. Consider buying in the red zone.
Investment involves risks. Please study the information carefully.
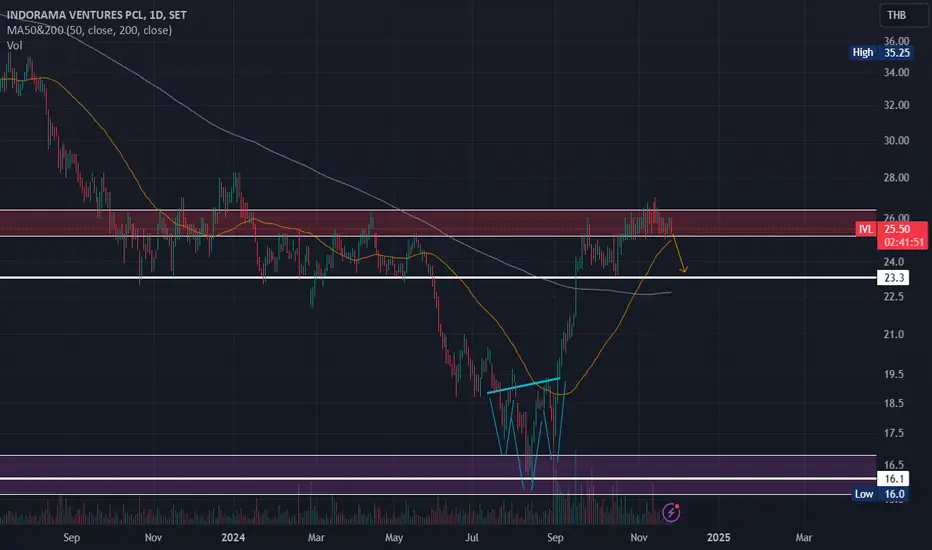
Indorama Ventures PCL ( IVL ) cooling off after big gainsMonstrous rally off of an inverted head and shoulders support. Banking a +- 70 % gain over a 3-4 month period.
Stock seems to be cooling off now, which might indicate some profit taking in order to protect those gains.
No position, with a neutral view. I'll be Watching for downside pressure and might get interested at 23 baht again for a trade.

Analysis on MGI: Take Profit??Hi all,
I would be great to TP and wait to buy later if the buying pressure come in
If wanna bet, must stand above 50 first,
Not recommend for buy or sell, just sharing the view
Please make your own decision,
Best Regard

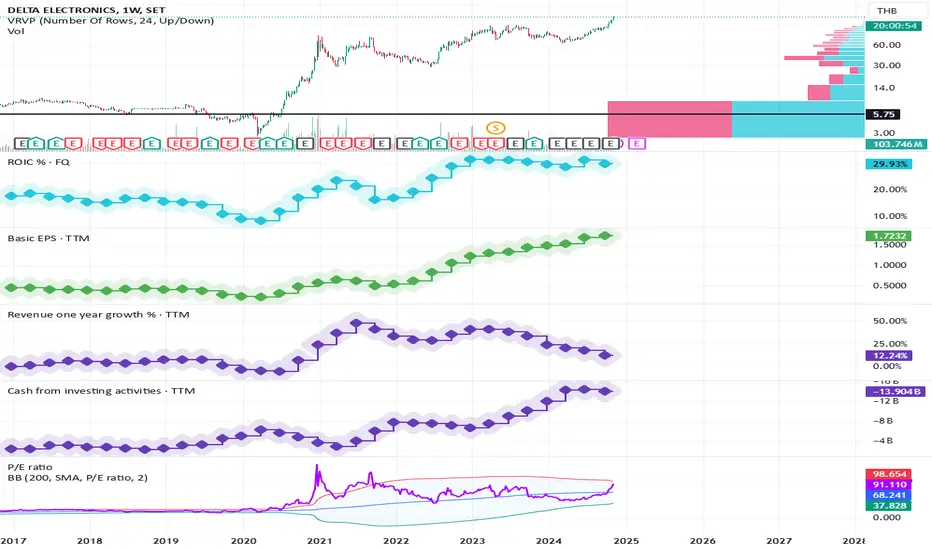
Growth + Float = Delta money gameSET:DELTA is the best performing large-cap stock since Covid time - the stock is the thiry-bagger from end of 2019 to today (7 Nov 24) - generating massive return to its shareholders and executives.
>> Not a new kid on the block :
Pre-covid, Delta had decent financial performance. The company consistently achieved revenue and earnings growth and was profitable through cycles. It's also a reliable dividend payer - deliver 3%+ yield to its shareholders.
Single-digit growth and contistent dividend payout were Delta's characterictics back in the old days. As such, DELTA P/E had been in the mid-teens.
>> I want it all
In 2018, Delta announced the voluntary tender offer deltathailand.com at the price of 71 Baht/share (Bt 10 par). The company said the tender offer aimed to strengthen Delta's manufacturing capabilities and sales support in Southeast Asia.
Tender process concluded in mid 2019, reducing the free float from 37% to 22% .
Analysis on INSET: Wave 3 PotentialDear all
Overall, this chart look ready for the big shot.
I hope it come down to 2.3 - 2.5 once more.
But it is really the beginning of the wave 3.
Really interesting
Best Regards,
TraderPP

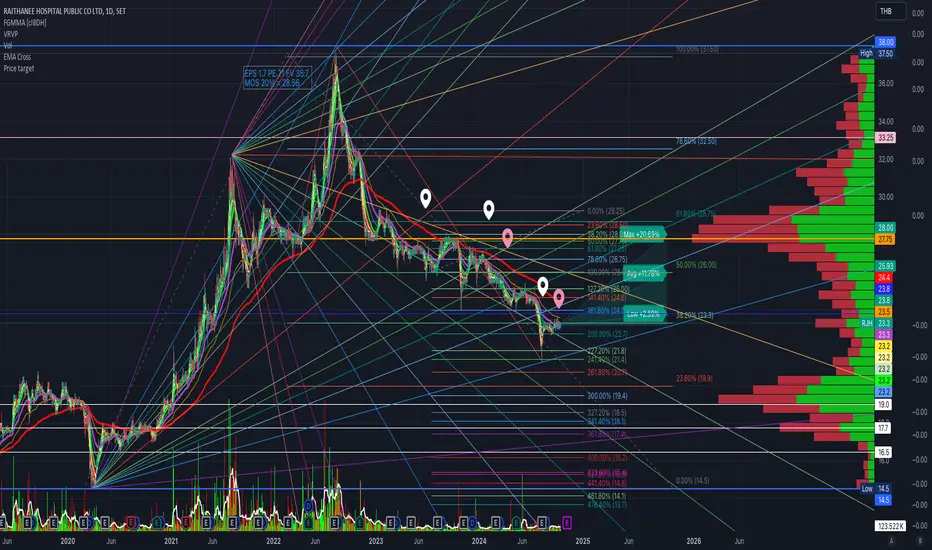
RJH: 15 Oct 20247 Oct 2024
CP 23.2
Tailwind
-Fct 3Q24 highest in last 2 yrs. Nomally comes from Cash and SSO
Headwind
-4Q24 is off-peak season -> revenue drop QoQ but increasing YoY
-Fct SG&A increasing from preparing to open new branch (RNK) in Oct'24 -> beware of Depreciation in Y25
-Adjust Relative Weight (RW) from 12K to 7K. Debating still on to push not to over 15K
-Affect from investment in RAM. SH's cost 28.2 current price is 23
KS TP 23.80 Fct EPS 1.58 PE 15
MOS 20% @ 19.04
MOS 25% @ 17.85
MOS 30% @ 16.66
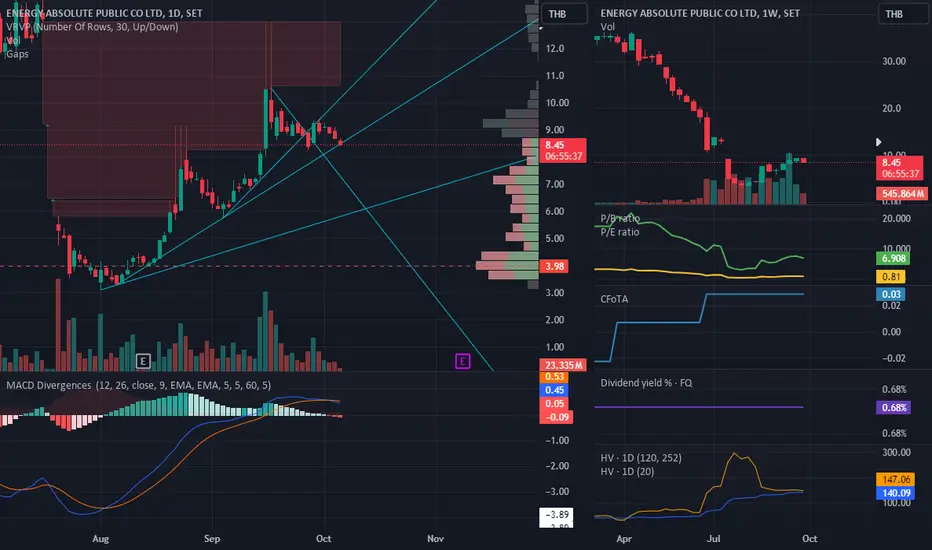
Analysis on EA: time to exit firstHi all
it broke down uptrend line
it increase from bottom almost 3x.
now is the time