VIBHA | Symmetrical Triangle Breakout Entry SetupPrice Action and chart pattern trading setup
> symmetrical triangle breakout with smart money and banker chip volume support
> Entry at confirmed breakout or pullback retest candlestick above the triangle support
Indicator: bullish RSI above 50 strong uptrend and MACD crossed above baseline
RR: 2:1 Target at 0.786 - 1 Stoploss below the triangle
Always trade with affordable risk and respect your stoploss

STGT : SET INDEXEverything is on the chart
so far in downtrend and just reach the current support
no sign of reversal yet
.
.
Trade safe n fun
.

BANPU : SET INDEXBANPU is coal stock
At the moment coal is rising, If break out the supply zone then it's good buying opportunity.
(btw, this is monthly chart... It will be quite a very long timeline at least 3-4 years until it reach the peak of cycle)
.
Trade safe n fun
don't forget to place the stop loss at ur acceptable risk

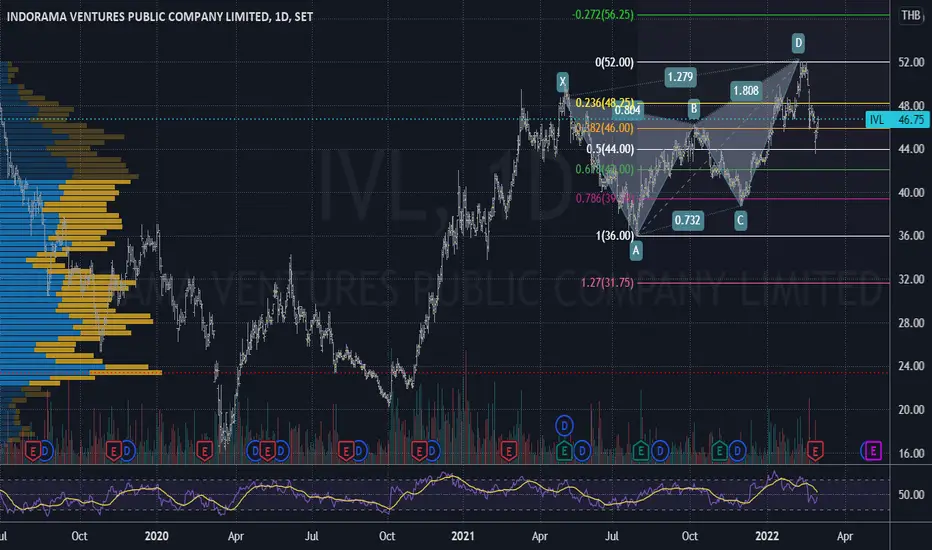
IVLSET:IVL
- Retrace 50% and rebound significantly
- Target - at least previous all time high
- Stop out - previous low (at 50% retracement)
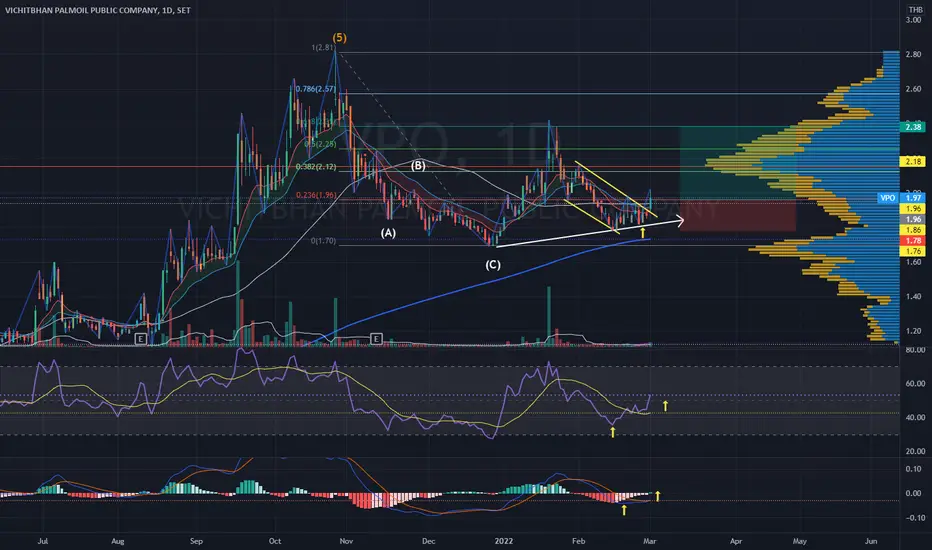
VPO | Falling Wedge Reversal Pattern Breakout Entry SetupPrice action and chart pattern trading setup
> Falling wedge reversal pattern
> Entry @ Breakout setup - bullish candlestick golden cross SMA50
> Target 0.618-0.786 target zone retracement
> RSI bullish signal crossed up MA above 50
> MACD golden cross just below baseline
> Target RR 2:1 for medium term trade
Always respect your stop loss!

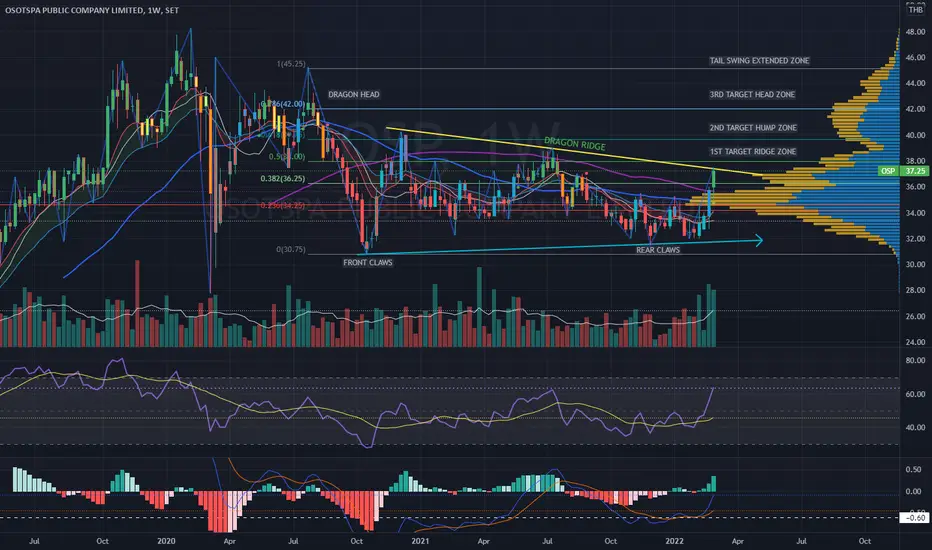
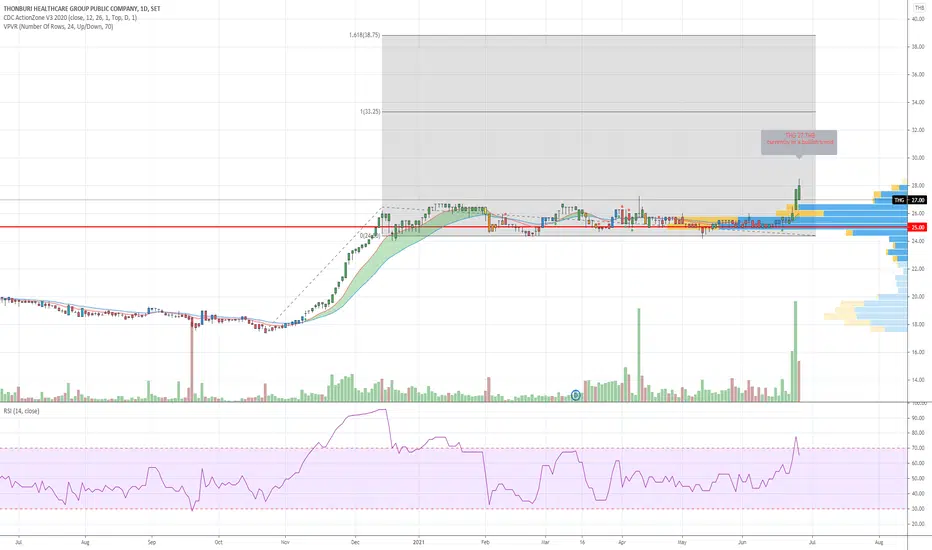
OSP | Bullish Dragon Pattern | Target Estimated TFWPrice action and chart pattern medium to long-term trading -
> Bullish dragon triangle pattern tail swing - 1st target achieved at Dragon Ridge 0.5 - 0.618
> Next Target Dragon Hump estimated at Fibonacci 0.618 - 0.786
> uptrend reversal pattern - SMA200 and SMA400 crossed up in timeframe Day
> Buy on dip recommendation at support level SMA400 and SMA200 35 - 36.
Indicator TFW:
> MACD golden crossed signal and approaching baseline 0.
> RSI strong bullish above MA
Always trade with affordable risk ratio 3:1 for long term setup and respect your stop loss.
Good Luck
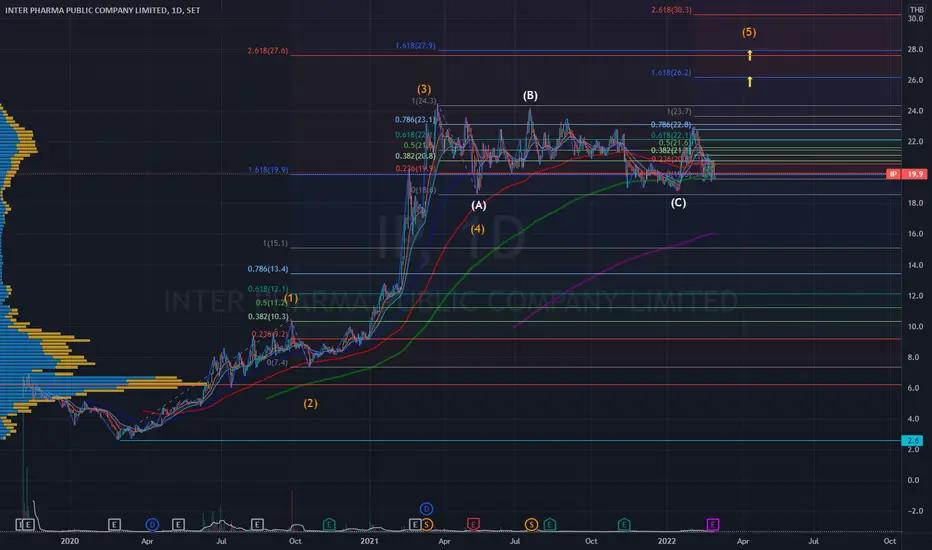
IP | Estimated 5th Elliott Wave Target Zone ProjectionPrice action and chart pattern trading
> Target projection of upcoming wave 5 estimated from Fibonacci 1.618 retracement of Wave 4 - A and equal to 2.618 of Wave 1.
> Minimum target 1.618 extension of minor wave 1.
Always trade with affordable risk ratio 3:1 for medium or long term
Respect your stop loss.
Good Luck
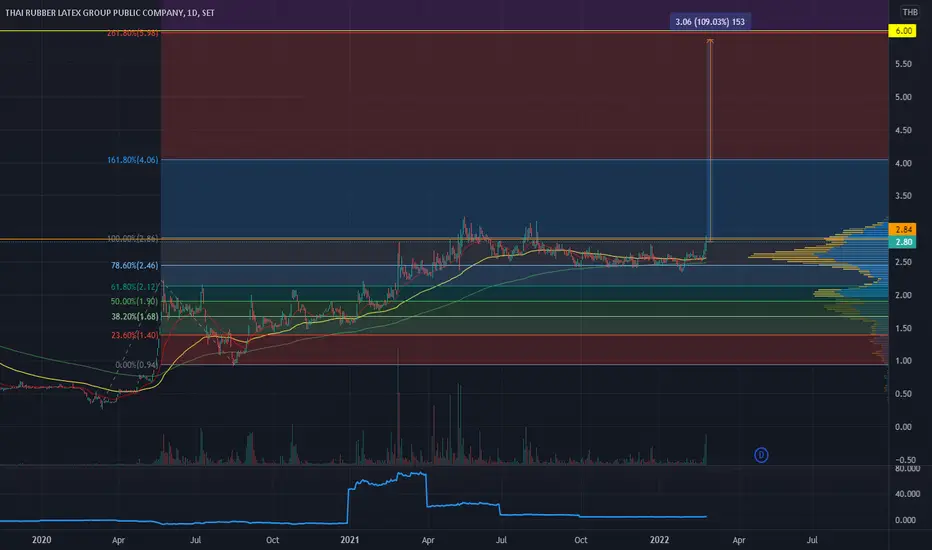
TRUBB| Falling Wedge Breakout |Impulse Elliott Wave 5 ProjectionPrice action and chart pattern trading
> Bullish parallel breakout and pullback
> Entry position at pullback support level just above SMA200 or volume profile point of control line - 2.70, 2.60
> Mid / Long term Target Elliott Wave 5 estimated 2 scenarios based on 1.0 of wave 1 optimistic and 1.618 of wave 4 as minimum case
> Short term target at top of wave 3
Indicator:
> Strong smart money and banker chip volume
Risk ratio 3:1 for mid/long term and 1.5:1 for short term
Always trading with affordable risk and respect your stoploss

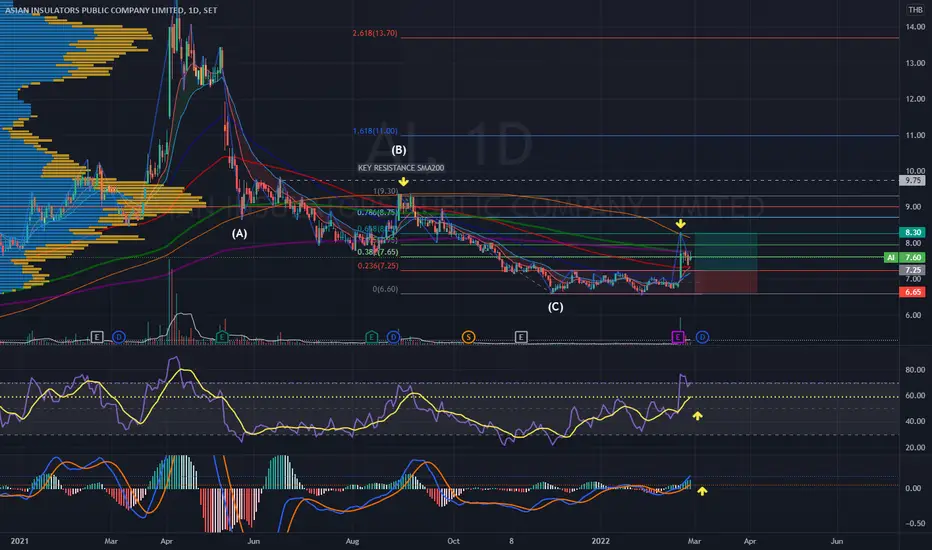
AI | Parallel Channel Breakout | Pullback Entry PositionPrice action and chart pattern trading - Possible the end of Elliott Wave collection phase
> Parallel Channel breakout
> Pullback entry position is recommended
> Target SMA200 as key resistance or Volume profile point of control
> RR: 2:1
Indicator: strong RSI and MACD bullish divergence
Always trading with affordable risk and respect your stop
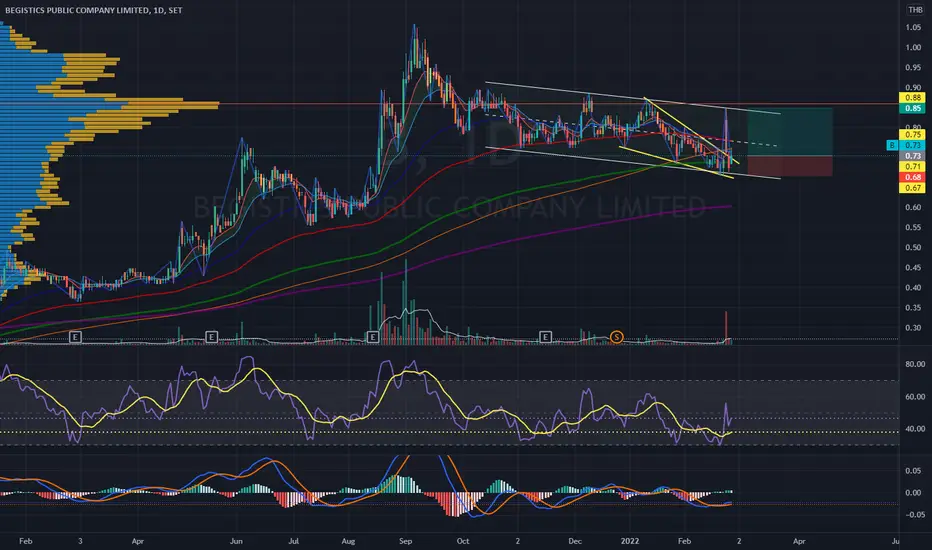
B | Possible Bullish Wedge Reversal | Pullback EntryPrice action and chart pattern trading
> Downtrend flag parallel channel with bullish wedge reversal pattern
> Entry at pullback position
> Target at upper parallel channel
Indicator:
> RSI and MACD Bullish divergence
Always trading with affordable risk and respect your stop
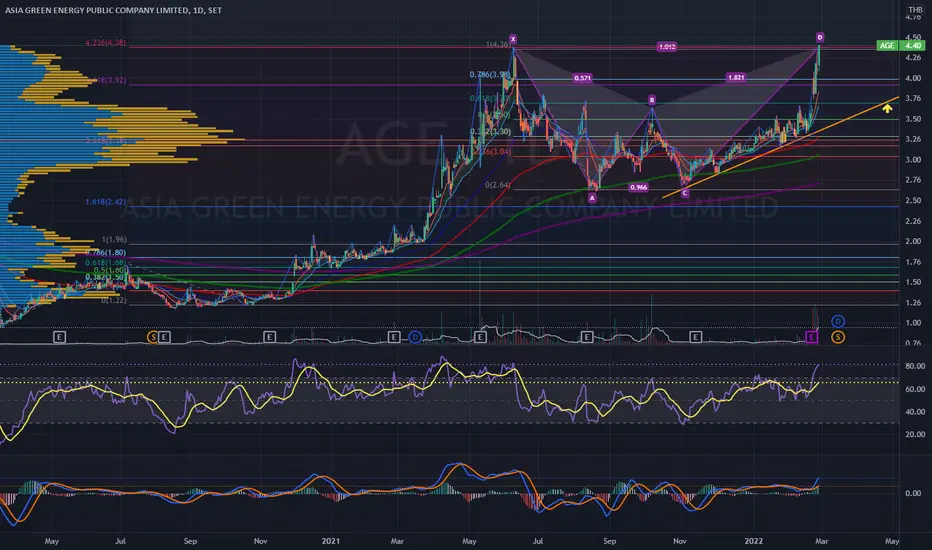
AGE | Bear Butterfly Harmonic | Limited upside Take Profit 50%Price action and chart pattern trading
> Bearish butterfly harmonic pattern limited upside
> Take profit 50% long term uptrend
> Target downtrend at B position of butterfly / EMA10 / Fibonacci 0.618
Always trading with affordable risk and respect your stop loss
LANNA | Inverted Head & Shoulders | Entry SetupPrice Action & Chart Pattern Trading
> Inverted Head & Shoulders forming | Entry @ Demand support line zone (right shoulder) crossing up EMA200 and SMA200
Indicators:
> Smart Money and Banker Chip volume support
> BBD crossing up baseline
> Fundflow turning positive in-flow bullish signal
> KDJ bullish changing to uptrend ribbon
Trading with affordable risk ratio 3:1
Always respect your stoploss
Good Luck

SOLAR | Downtrend Descending Triangle | Bullish Divergence |WaitPrice Action & Chart Pattern Trading - No Entry Point - just wait and see
Downtrend descending triangle with bullish divergence signal
Indicator:
> Smart Money and Banker Chip volume support at a significant level
> Fund Flow bullish divergence
> BBD downtrend dead crossed baseline
> KDJ stochastic downtrend with bullish divergent signal
Recommend NO trading until breakout EMA400 with trend reversal pattern.

TKN | possible breakout but upside limited bearish divergencePrice Action and chart pattern trading - possible breakout but upside limited
> Testing the upper limit of uptrend parallel channel and key resistance of volume profile
Indicator
> Bearish divergence signal: Fundflow, BBD, and KDJ Stochastic
> Strong volume support with smart money and banker chip of this wave

BEC | Uptrend Parallel Channel | Target 5th Wave ProjectionPrice action and chart pattern trading
> Parallel Channel uptrend pattern from Wave 4 to 5 now almost hit the top of the channel.
> Wave 5 target estimated at 1.618 Fibonacci retracement of wave 4
Indicator:
> Target RSI 82 - 88 now at 74
> MACD 0.6 - 1.0
> ATR 0.7 - currently at 0.6

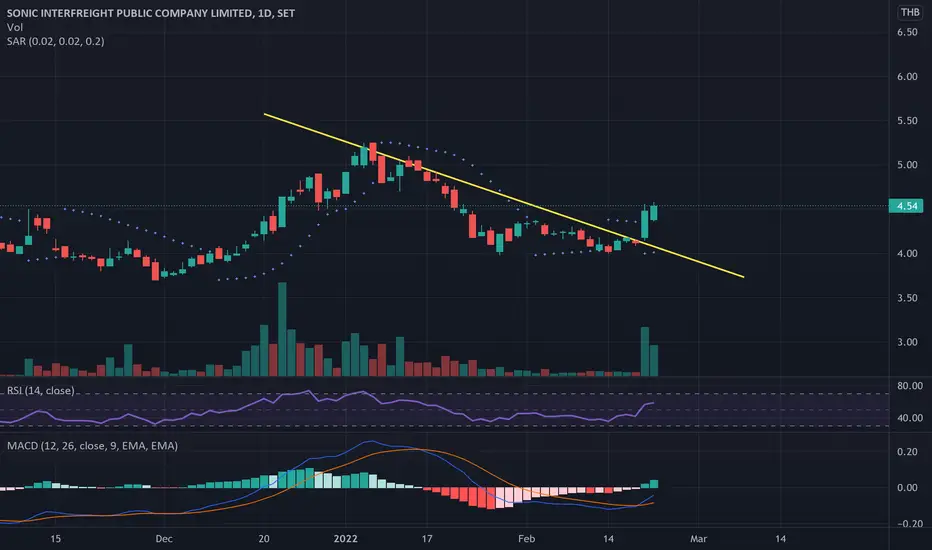
JR | Falling Wedge Breakout | Entry Setup TF4HPrice Action and Chart Pattern Trading
> Possible bullish wedge reversal breakout in timeframe 4H
> Entry @ Breakout trendline and stop zone accumulation
> Target @ Volume Profile POC level Fibonacci zone 0.786 - 1.0
> Risk ratio 2.5: 1
Indicator:
> Smart Money and banker chip significant volume support
> Fund Flow bullish divergence
> KDJ uptrend reversal pattern
> BBD golden crossing baseline
Always respect your stop-loss

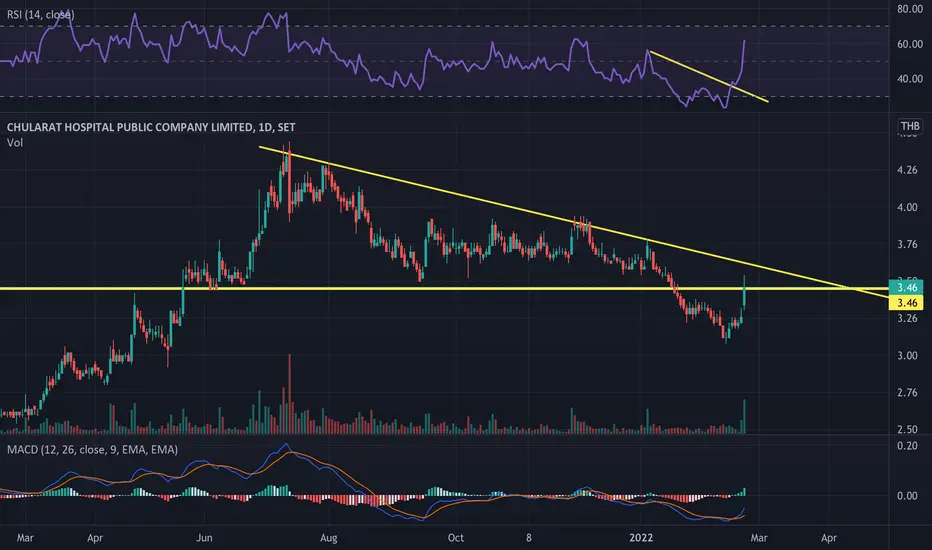
CHG on 22 FEB 22Follow covide trend in Thailand and break support
have Vol in TF D , should follow buy and cut loss not high
VL | Cup & Handles | Target Estimated | Elliott Wave UpdatedPrice Action & Chart Pattern Trading Setup
> Entry @ Breakout ascending triangle
> Cup & Handles pattern with target estimated for medium-term trading
> Updated Elliott Wave pattern for daily timeframe
> Trade with affordable risk ratio 3:1 for medium-term
> Always respect your stop-loss

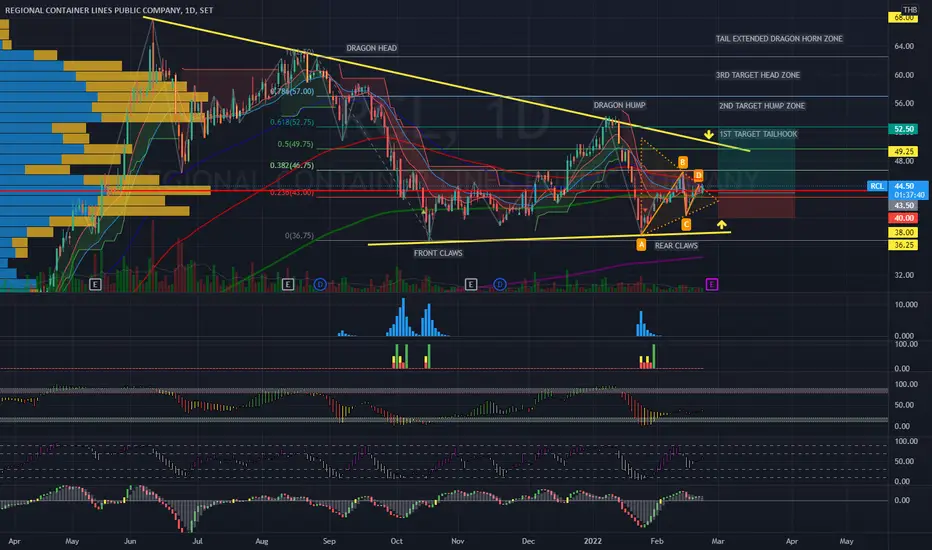
RCL | Bull Dragon Pattern | upcoming Triangle Breakout SetupPrice Action and Chart Pattern Trading Setup
> Bullish Dragon Pattern with upcoming triangle breakout ENTRY setup above EMA200 and Volume Profile Point of control 44.50
> 1st Target upcoming TAIL HOOK fibo 0.5-0.618
> 2nd target at DRAGON HUMP 0.618-0.786
> 3rd target DRAGON HEAD 0.786-1.0
> Tail extended target DRAGON HORN ZONE 1.0-1.618
Indicator:
> Smart Money and Banker Chip important level support at Triangle A position
> Fund flow trend reversal into positive distribution phase
> KDJ Stochastic strong uptrend
> Banker BBD positive trend above baseline 0
Fundamental Factor:
> positive BDI index +5% vs last week above 2000.
> CCFI Container Index still at high level
en.macromicro.me
Risk ratio: 2.5:1 for short term target tailhook position or dragon hump trade and 3:1
Always trade with affordable risk and respect your stop loss
Good Luck