SOLAR | Rising Triangle | Entry Breakout Setup Price Action & Chart Pattern Trading
> Rising Triangle | Buy @ Breakout above EMA400
> Target zone @ Volume Profile high D-shape Point of Control - Fibonacci Retracement 0.786
> Stop Zone @ the lowest triangle
Indicator Support:
> Smart Money and Banker Chip Volume
> BBD signal - positive above baseline
> Fund flow reversal pattern still below entry position
> KDJ uptrend ribbon
Trade with affordable risk ratio 3:1
Always respect your stoploss

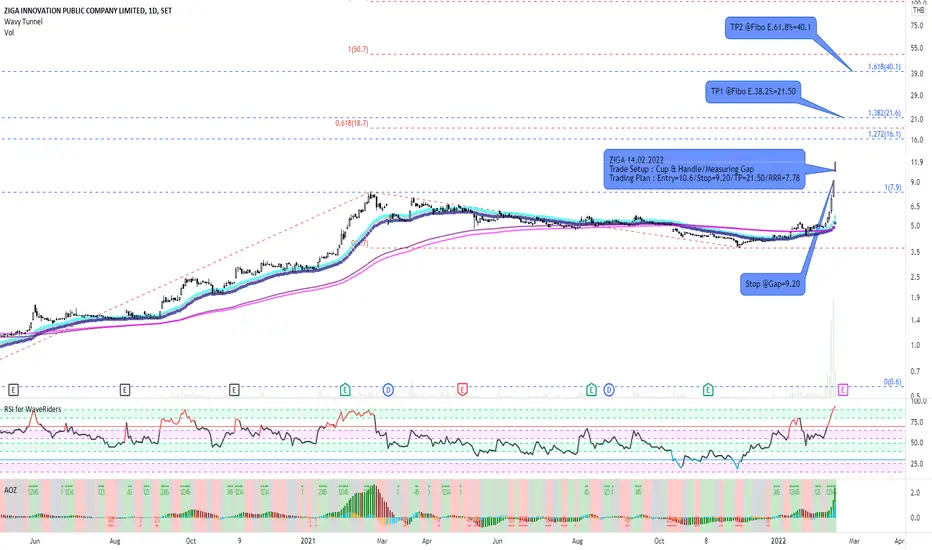
ZIGA and Cup & Handle PatternI like the Cup & Handle. When finding this pattern, I always look for another entry signal because it's strong uptrend and hard to wait for dipping. Luckily, I find a measuring gap called the gap of opportunity. When market opening, I was not hesitated to calculate position size quickly and made entry order. What will be the result, just wait and see. :o)
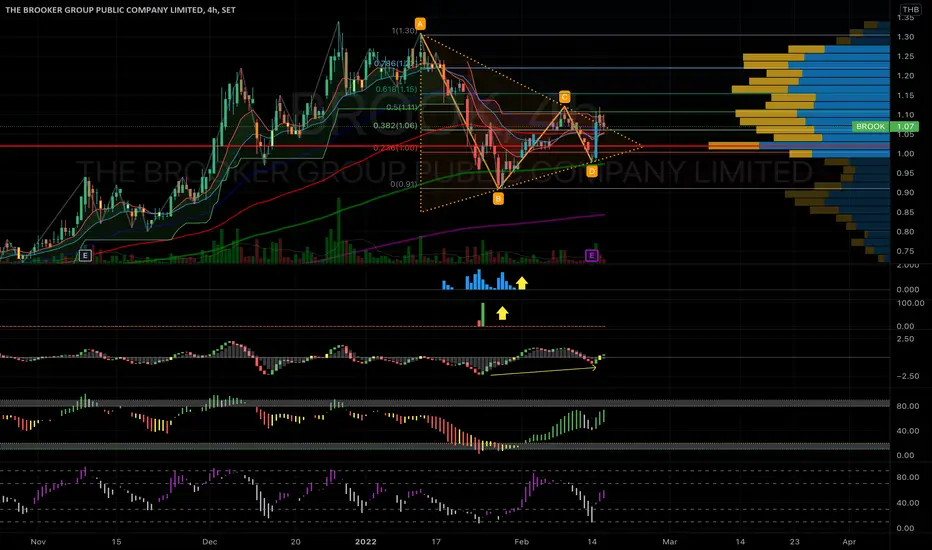
BROOK | Pennant Breakout | Entry @ Pullback SetupPrice Action and Chart Pattern Trading Setup
> Pennant Breakout and above Volume Profile POC line
> Entry @ Pullback setup - Target 0.786 - 1.0 of previous high - the key resistance of volume profile
Indicator:
> Smart Money and banker chip volume support at previous low / B position lowest pennant
> BBD bullish signal crossover base line
> Banker Fundflow strong uptrend and not overbought
> KDJ stochastic uptrend reversal
Risk Ratio: 2:1 stoploss at C position previous low pennant
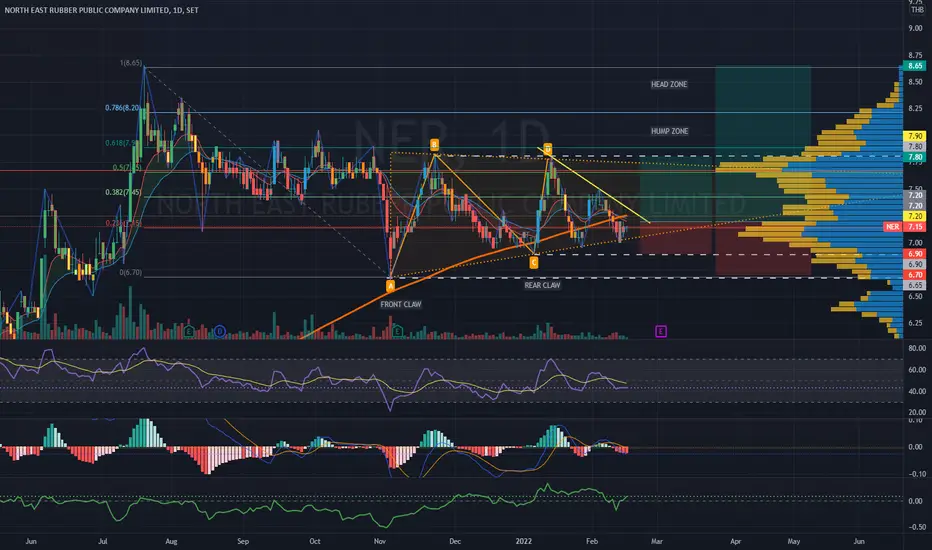
NER | Rising Triangle Dragon Pattern | Entry @ Breakout SetupPrice Action and chart pattern short-medium term trading
> Rising Triangle Dragon Pattern
> Entry @ breakout trend line SMA 200
Indicator:
> Bullish RSI crossing MA line above 50
> Rising MACD just below baseline
> CMF reversal crossed baseline 0.
Short term RR 2:1 Medium-term RR 3:1
Always respect your stoploss
SET:KEX. Catching a bottom bounce. Not recommended ;)Catching Bottom Bounce on SET:KEX. Price is extended to the downside, should mean-revert to EMA/VWAP from IPO. Tight SL in case stock moves further down

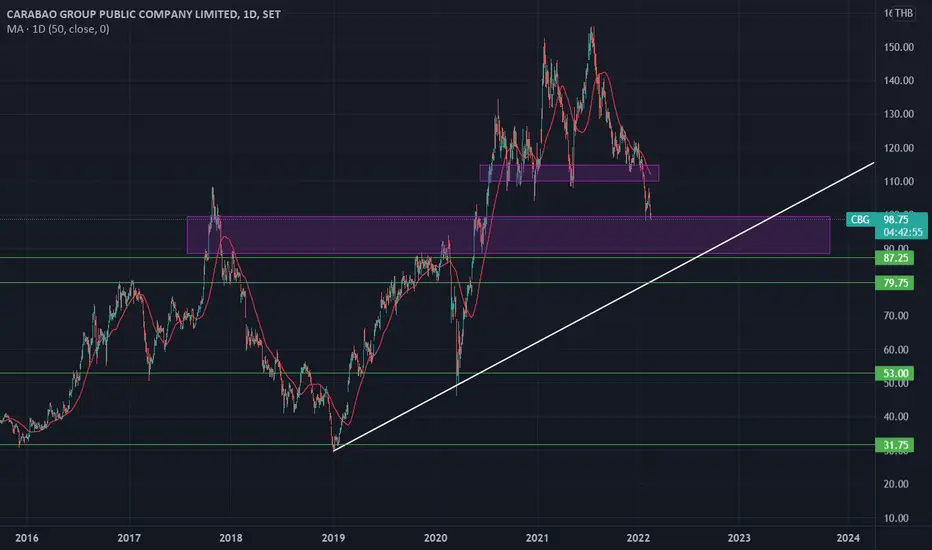
Carabao Group PCLShare has been falling because it was over-hyped and over-valued.
I am expecting more of a pullback and a retest critical support zones between (90-87 baht) (87 -80 baht). We should see a bounce at these levels, bouncing off an existing trend line . However, if that doesn't hold then we could see another meaningful correction to lower levels to bring the multiples back down to earth.
The earnings report should lead the way for direction.
If their earnings report isn't to the markets liking, then we can expect that 87 baht area to fail and gradually make its way back down to the 40 baht region.
If the Earnings report is decent and shows growing revenues and increasing margins, well, then we could see that white trend line holding and could be the catalyst for a continued uptrend.
With a P/E multiple of 32 - the market is pricing in expected earnings for the future already and is expecting big things from this company, so I would tread lightly here. Any missed guidance or revenue contractions will send the share tumbling.
Nonetheless, I will be taking my first position between 80-90 baht baht and leaving it there for the long term, and will be looking to add again in the 40 -55 baht region.
PTTGC | Dragon Pattern | Double Bottom BreakoutPrice Action & Chart Pattern Trading - Short Term Setup
> Dragon Pattern - Rectangle with ENTRY @ doubled bottom breakout
Indicator:
> Smart Money and Banker Chip Volume Support
> Banker BBD positive uptrend above baseline
> Fund flow bottom signal and reversal from the oversold area
> KDJ Stochastic changed to uptrend ribbon
RR : 2.5:1
Always respect your stoploss
Good Luck

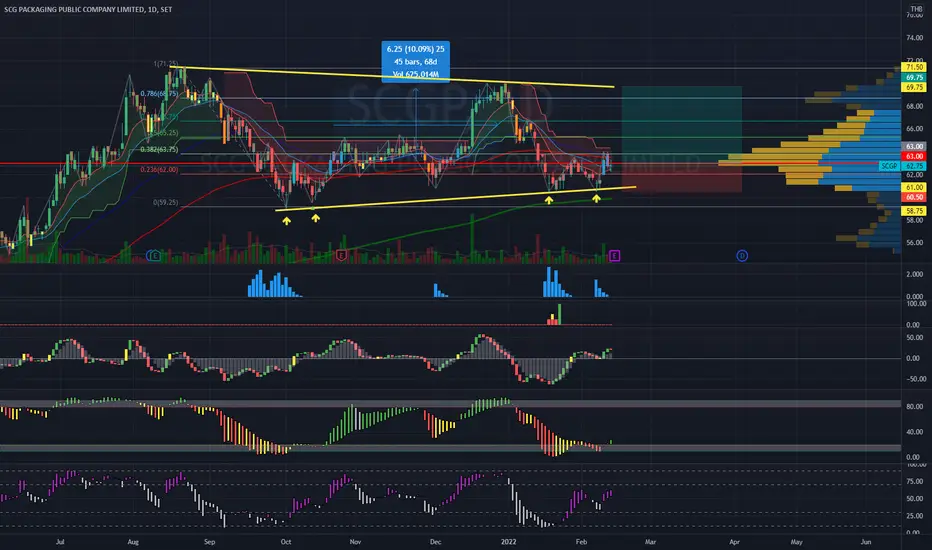
SCGP | Dragon Rectangle | Entry @ Doubled Bottom BreakoutPrice Action & Chart Pattern Trading Medium-Term Setup
> Dragon Rectangle - Doubled Claws / Bottom Breakout signal
Indicator:
> Smart Money and Banker Chip Volume support
> BBD Banker bullish signal above baseline
> Fundflow bottom with reversal pattern
> KDJ Stochastic on uptrend ribbon
RR: 2:1
Always respect your stoploss
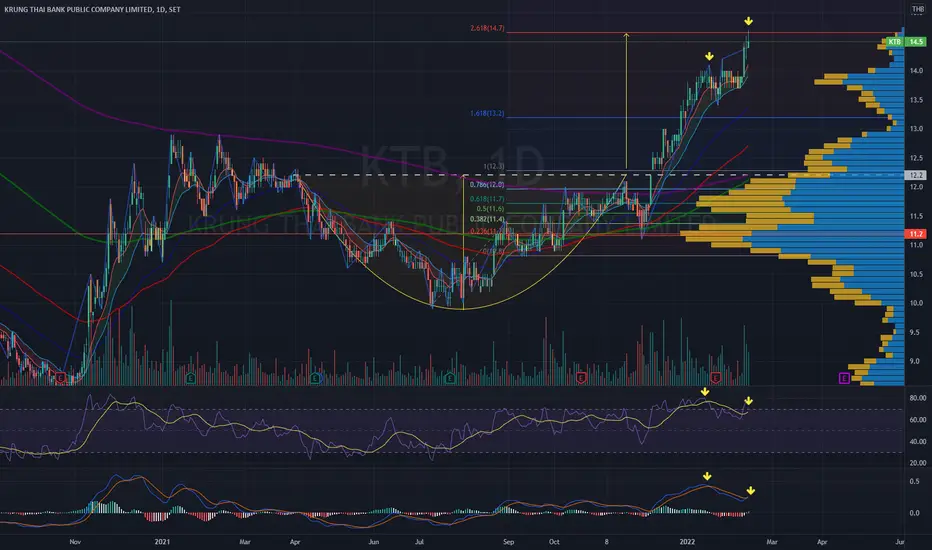
KTB | Saucer uptrend target | Bearish Divergence | Take Profit?Price Action & Chart Pattern Trading
> Saucer uptrend target zone 2.618 Fibonacci extensions
> Slight RSI and MACD bearish divergence
> Time to start taking some profits
> Shooting star candlestick - bearish pattern
Good Luck
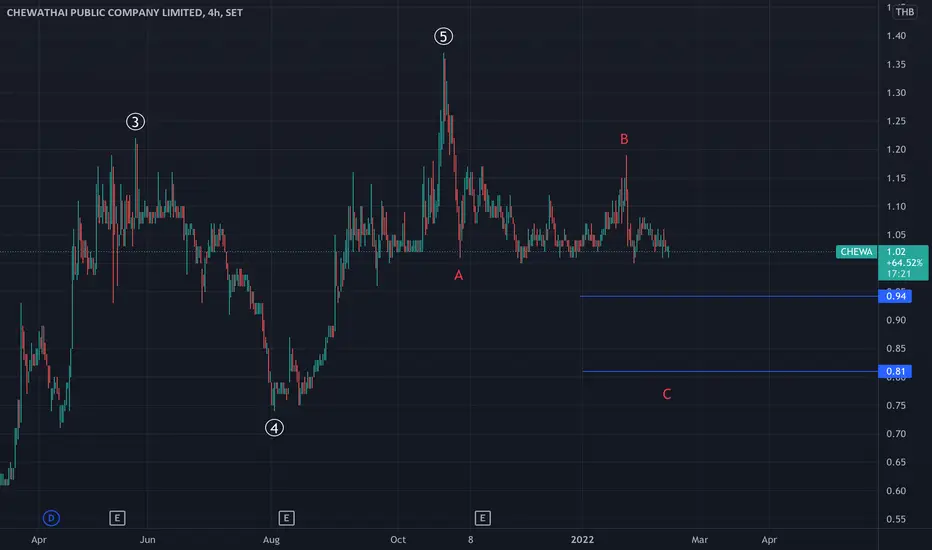
CHEWA (Thai) - Elliot Wave Analysis- Im expecting price to continue downward to complete the red wave-C.
- Strong support point are on the chart (blue line)
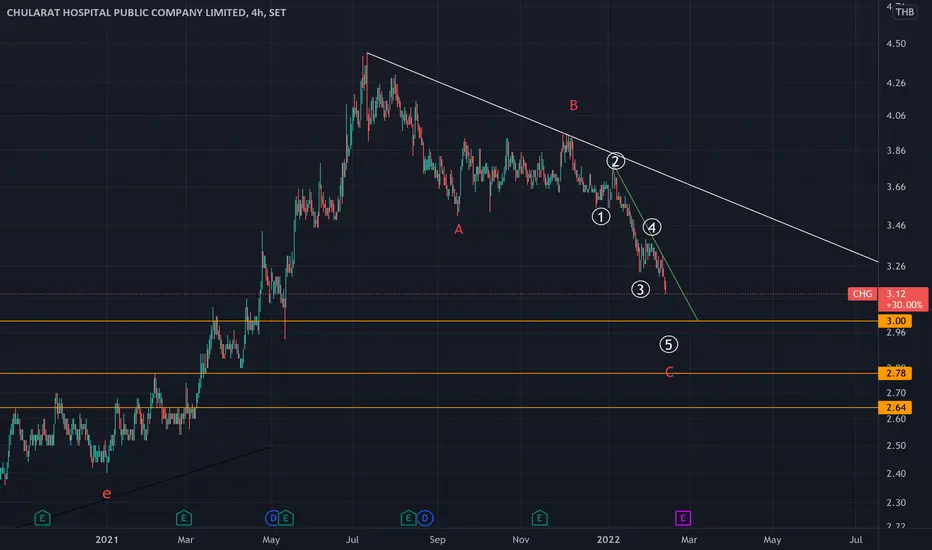
CHG - Elliot Wave Analysis- Price is most likely an ABC correction, with the red wave C being an impulse and consisting of 5 segments - 12345.
- Support levels are shown on the chart.
- To confirm the end of this correction - 1. price breaks the green trendline 2. price breaks the white trendline.
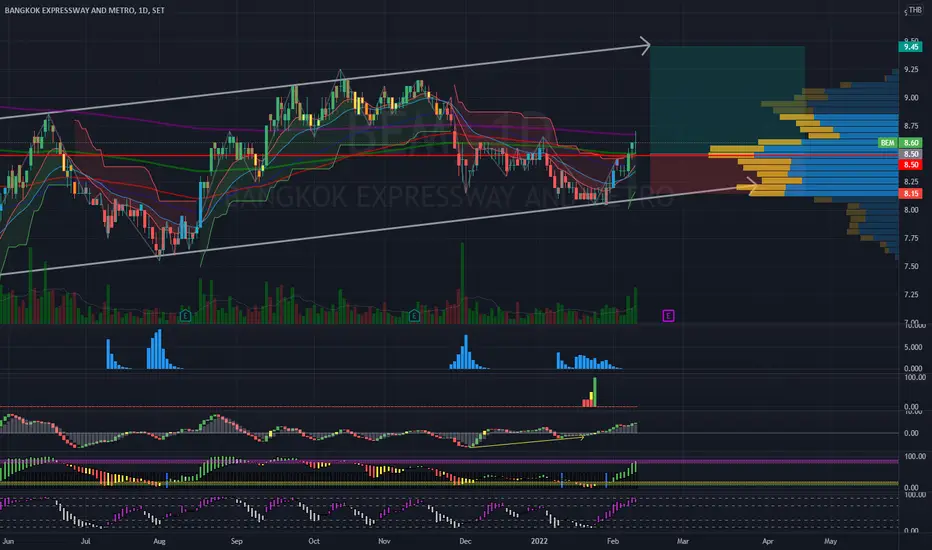
BEM | Parallel Channel | Short term trade setupPrice Action & Chart Pattern Short-term Trading
> Parallel Channel uptrend trade setup
> Entry @ bullish breakout EMA50 and EMA200
Indicator:
> Smart Money and Banker Chip Volume significant level support
> BBD bullish divergence crossed above baseline
> Fundflow strong uptrend
> KDJ strong uptrend ribbon
Trading with affordable risk ratio 2.5:1 for short term
Always respect your stoploss
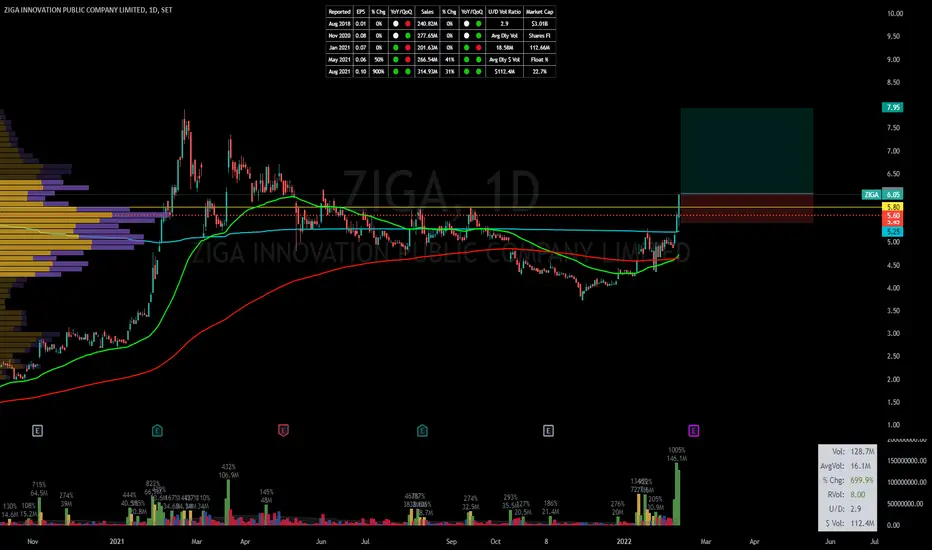
Long SET:ZIGA. Episodic Pivot. Breakout of range + News on BTCChart looks good. you can see the volume coming in. Highest volume bar since IPO week. Stock has broken out above previous resistance.
SL below VS shelf + previous resistance.
Long SET: WORK. SL Low of the Day. Huge Upside potentialLets see if this plays out. Market is in a bullish phase. WORK is above VA consolidation, with 50EMA & 200EMA sloping upwards. Have to be wary VWAP from previous milti-year high.
Stop is tight, Low of the day. If momentum bursts continue to the upside, high odds for a good run. Low risk high reward.

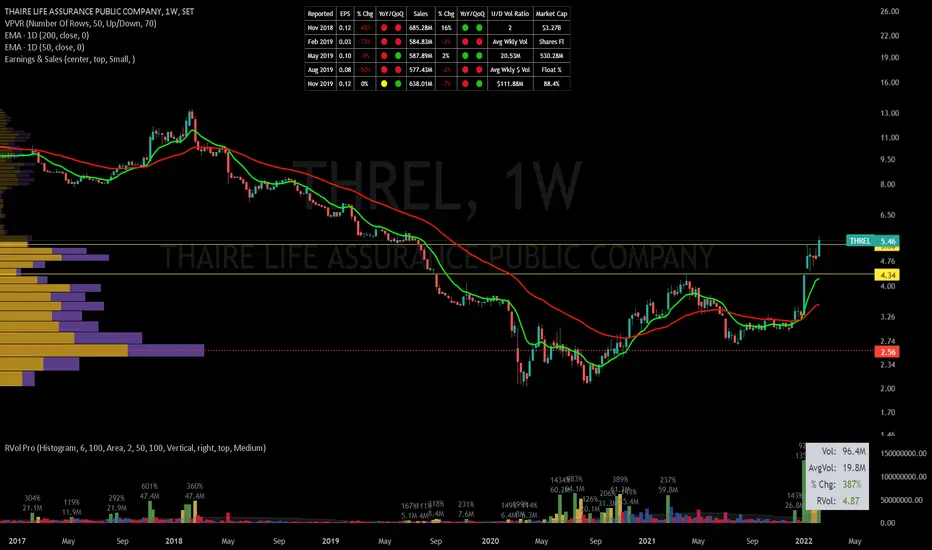
Long SET:THREL. Breakout on the weekly timeframe. SL lodBreakout for SET:THREL on the weekly timeframe for a long term swing. Stops below 4.72 (Low of the Breakout day).
Good VA action. Tight action over the previous few weeks from an earlier leg up, form a flag and breakout on the daily/weekly.
BDMS (TH) - Elliot Wave Theory- I expect price to retrace down for the red wave c.
- main support line are on the chart.

BCPG (TH) - ELLIOT WAVE ANALYSIS- Expecting price to reverse and go up for the white wave (c) of the red wave B.

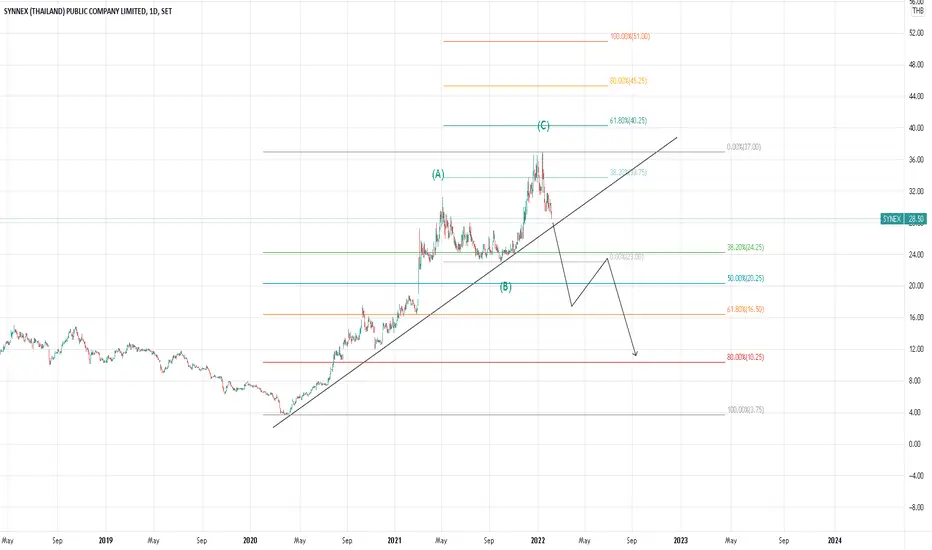
Synex beware truncated zigzagSynex, if it break down the trendline t will become truncated zigzag and go deep down to target 81%
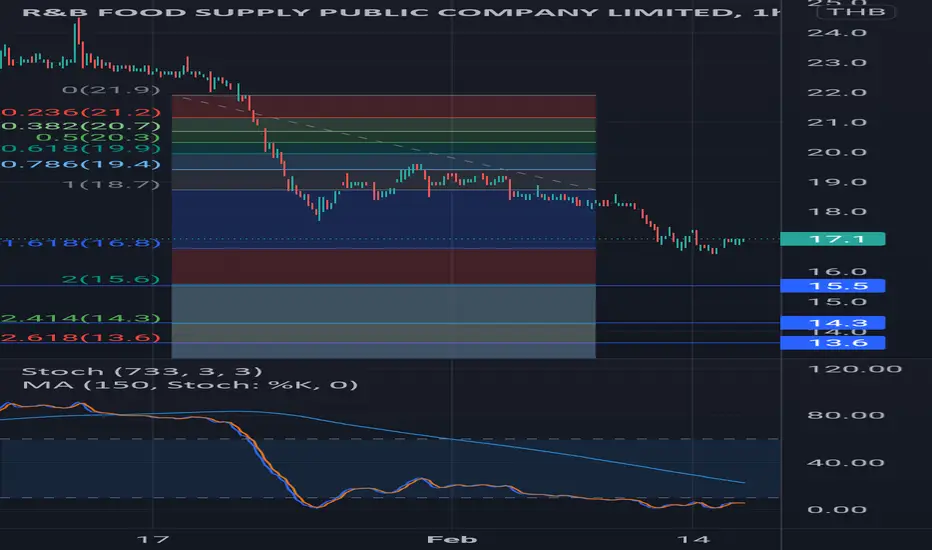
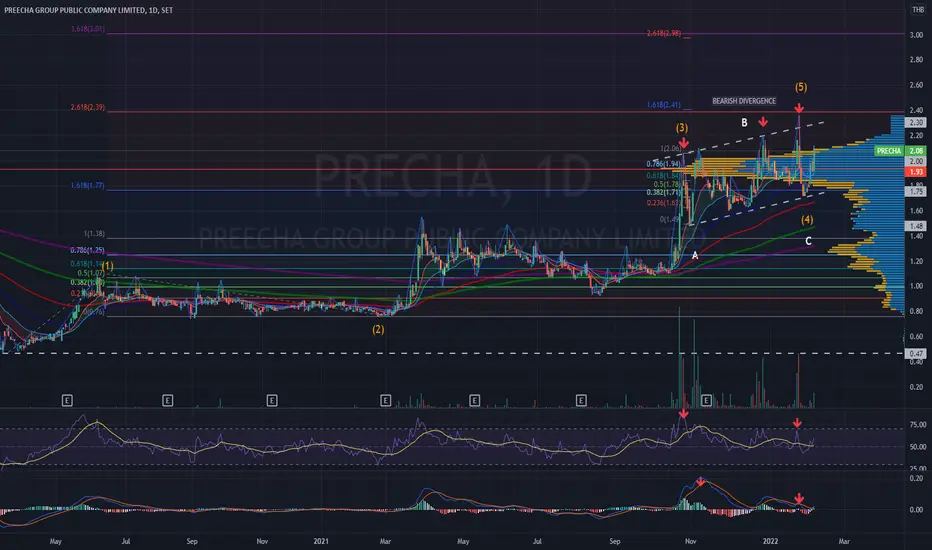
PREECHA | Elliott Wave |Bearish Divergence Wave 5| Take ProfitPrice Action & Chart Pattern Trading - Elliott Wave Projection
> Bearish Divergence signal - Wave 5 Zone - Take Profit Zone
> Limited upside for Elliott Wave 5, estimated at 1.618 of Wave 4 and 1.0 of Wave 1
> Rising Parallel channel as corrective Flat Wave 4 reversal pattern
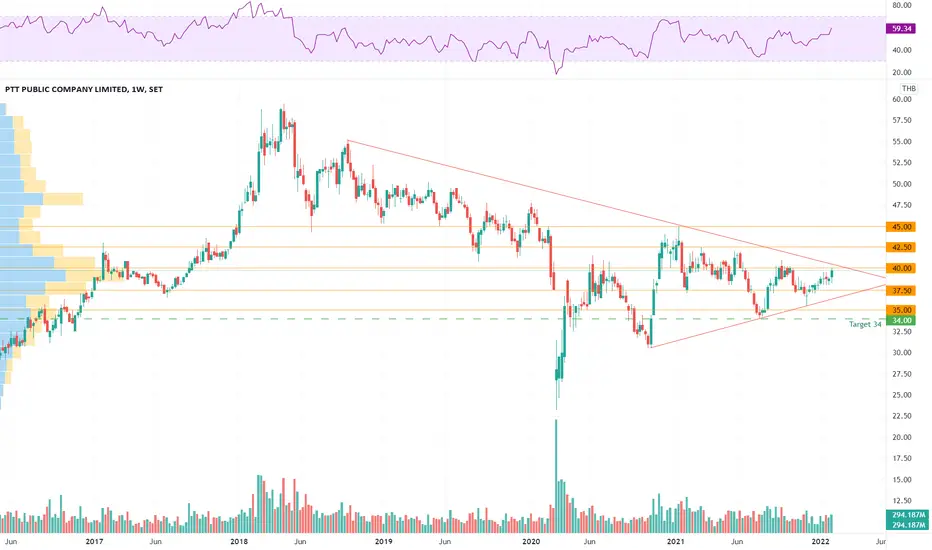
PTT is breaking symmetrical trianglePTT is very laggard when compare to crude oil. Price will break symmetrical triangle if it can stay above 40baht. After break, it will move to 50-52 area.
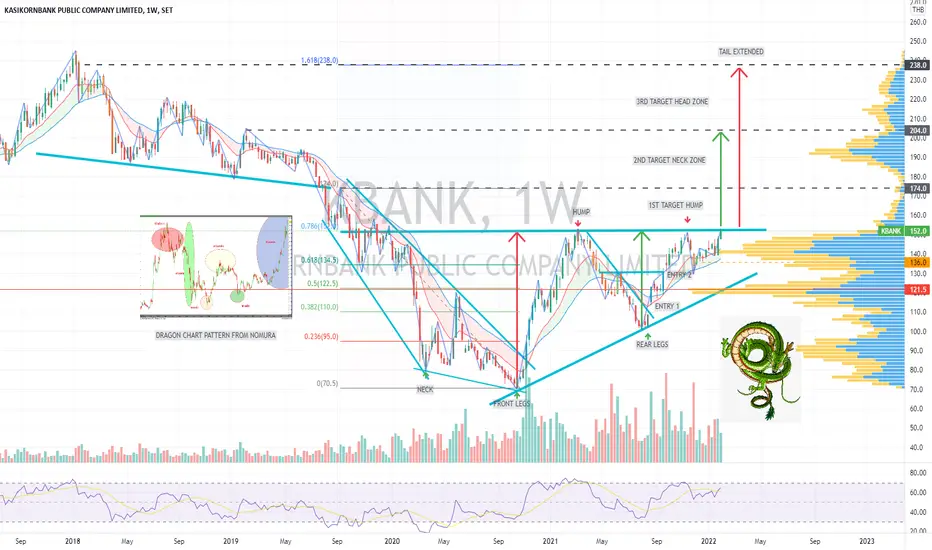
KBANK | Big picture | Dragon Pattern Tail Extension Target Price Action & Chart Pattern Trading
> Long term trading setup for Dragon Pattern Tail Extension Target estimated.
> Thanks to Dragon chart pattern from Nomura broker
Mr. Dragon. You can swing your tail up now!
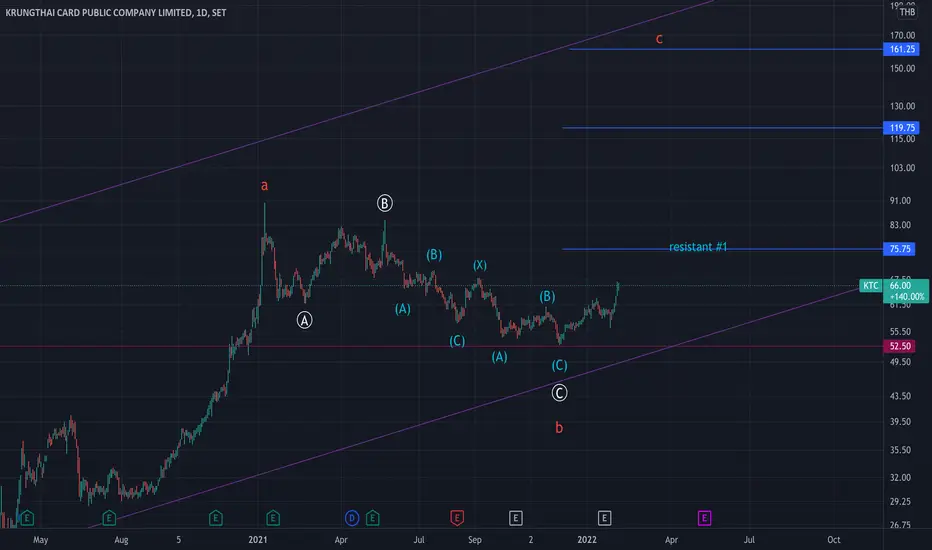
KTC - Elliot Wave Analysis- I counted a completed ABC correction as the red wave b.
- I do expect price to continue to the upside for the red wave c.
- First resistant is around 75.