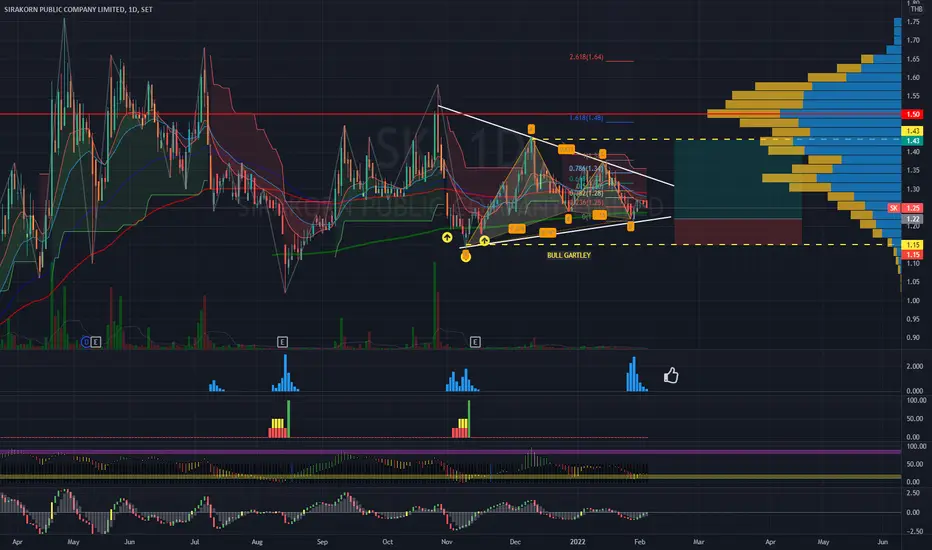
SK | Bullish Gartley Harmonic Pattern| Entry@Pullback SetupPrice Action & Chart Pattern Trading
> Bullish Gartley Harmonic Pattern | Entry @ pullback setup
Indicators:
> Smart Money and Banker Chip volume from previous wave support
> Banker Fundflow positive ribbon reversal
> Banker BBD uptrend crossing baseline
Trade with affordable risk ratio 3:1
Always respect your stoploss
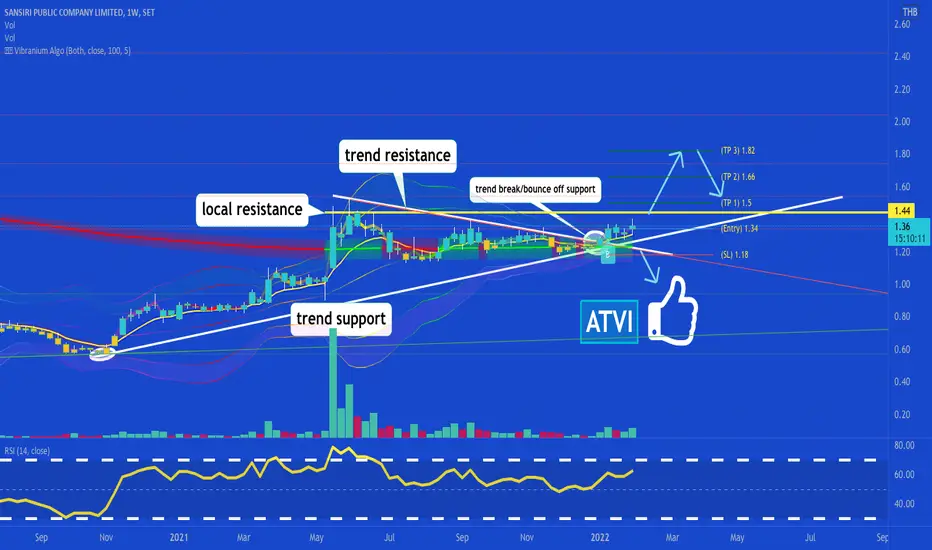
can breakout, wait for break past local resistance ✅siri bouncing off a local trend support and breaking trend resistance, over 1.44 local resistance we can target 1.5-1.66-1.82, a break below trend support could send it back to 1.
like and follow for more! 💘
ITD | Elliott Wave Projection | Triangle D Trading SetupPrice Action & Chart Pattern Trading
> Elliott Wave projection correction wave triangle D shape - completed after achieved target CUP&HANDLES impulse wave? I think so with smart money and banker chip volume support at E point corrective wave.
> Volume Profile high-E pattern looks like we have aggressive buyers/bankers to push the price
> Short-term trade within triangle with risk ratio 2/2.5: 1 - Stop-loss zone @ C wave position
> Medium-term trade within main volume profile range with RR 3:1 - SL @ A wave position
Always respect your stop-loss
Good Luck

JAS : SET INDEXJas support and resistance
Just that.. :) no financial advice LOL
Trade safe and fun <3

KCE : SET INDEX Let's see how this play out
.
Feel free to comment & share ur idea
Prediction is prediction it can be right or wrong
Trade safe n fun!

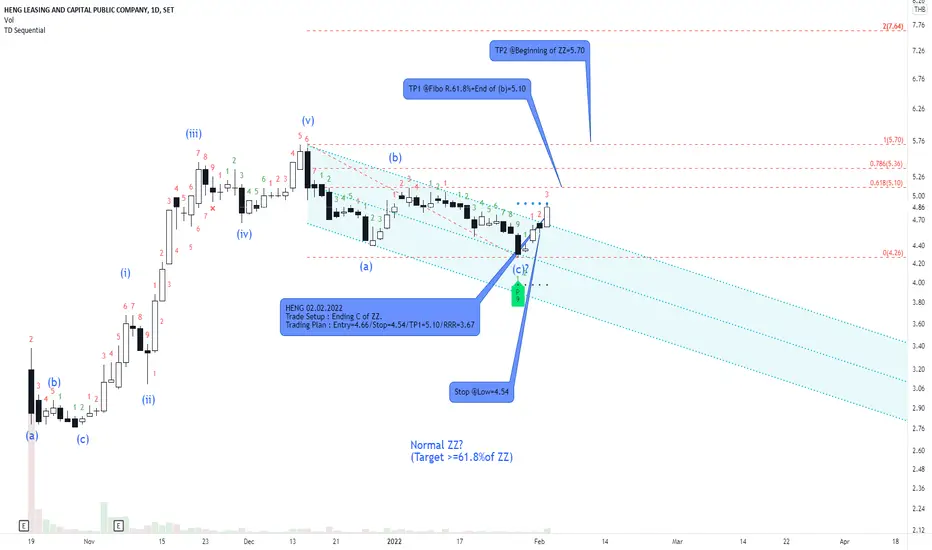
HENG and trading after ending of ZZ.Without any indicators, we may trade this stock with EW. strategy. I counted the end of ZZ pattern and prepared trading plan before market open. After price break the channel and also end of w.iv (subwave of w.(c)), I am sure it's the end of ZZ. and the beginning of another wave. No matter what's the next wave, at least it will retrace at least 61.8% of fibo. R. of the whole ZZ. (except w.(x) which is out of control). However, I managed risks properly before making the order. So, it's possible to gain higher profits than taking the risk well.
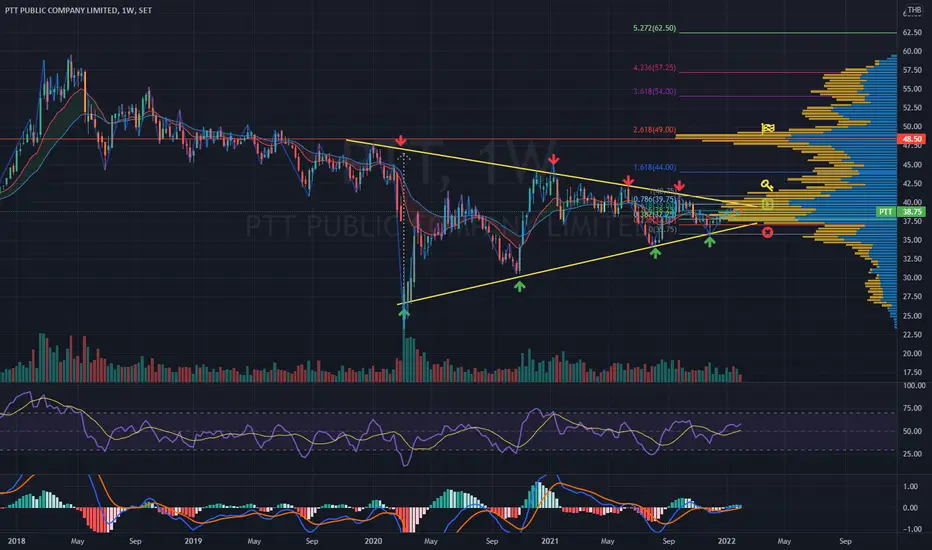
PTT | Big picture | Symmetrical Triangle TFWPrice Action & Chart Pattern Trading
I don't know why I kept this stock for a few years and didn't take profit. This symmetrical triangle has been going on for 2 years++ and coming to a considerably narrow down for breaking point. Hopefully, it will make some sense at the end.
Trade with affordable risk ratio
Always respect your stop
HANA : SET INDEXTarget .
Let's see how this play out
.
Feel free to comment & share ur idea
Prediction is prediction it can be right or wrong
Trade safe n fun!

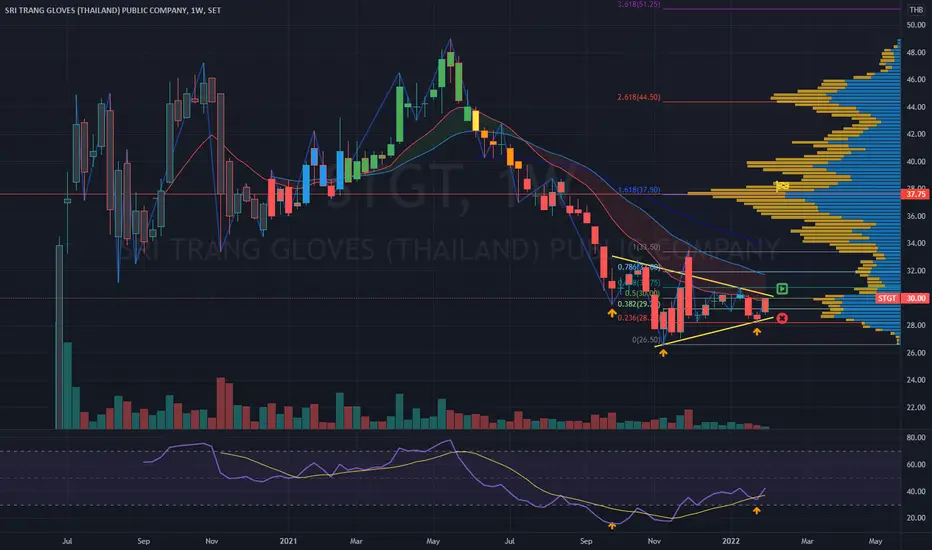
STGT | Symmetrical Triangle | Entry @ Breakout Setup TFWPrice Action & Chart Pattern Divergent Trading - weekly timeframe
> Symmetrical Triangle pattern - Entry at Breakout high resistance of triangle
> Divergent Trading Signal
> Target zone at volume profile point of control
> Trading with affordable RRR | 4:1 for long term investment
> Always respect your stoploss
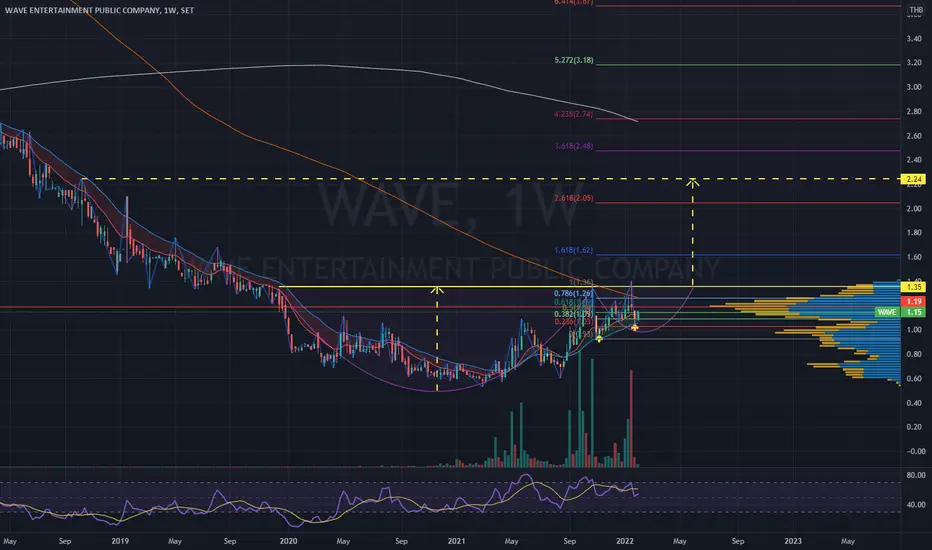
WAVE | Jacuzzi Bathtub | Big picture long-term uptrend targetPrice Action & Chart Pattern Trading
> Estimated long term cup&handles pattern target in weekly timeframe as big picture.
ITD : SET INDEXLet's see how this play out
.
Feel free to comment & share ur idea
Prediction is prediction it can be right or wrong
Trade safe n fun!

MACO | Bullish ABCD Harmonic | Entry Breakout Setup Price Action & Chart Pattern Trading
> Bullish ABCD Harmonic pattern
> Entry @ breakout
> Volume profile - lower D shape POC key support
Indicator:
> Banker Smart Money Volume
> BBD positive cross above baseline in 4H timeframe
> Banker Fundflow positive reversal pattern
> KDJ strong uptrend ribbon
Trading with affordable risk ratio 3:1
Always respect your stoploss


SONIC | Inverted Head & Shoulders | Entry Setup | TF4HPrice Action & Chart Pattern Trading
> Confirmed Inverted Head & Shoulders in 4 hour timeframe
> Entry Zone@Breakout Setup
> Target Zone @ Volume Profile Point of Control
> Stoploss Zone @ Neck Line to right shoulder
Indicator signal support:
> Smart Money and Banker Fund Volume
> BBD bullish signal golden cross baseline 0
> Fundflow reversal signal confined
> KDJ uptrend reversal purple ribbon
Trade with affordable risk ratio 3:1
Always respect your stoploss
Good Luck

TIDLOR : SET INDEXEverything is on the chart.
no financial advice
Trade safe and fun
Feel free to comment/share ur ideas

RS | Bullish Wedge Breakout | Entry @ PullbackRS | Thailand SET Index | Media | Commerce Sector | Price Action Trading
Chart Pattern: Falling Wedge Bullish Reversal
Price Action: Entry @ Breakout Pullback
Indicator:
Volume profile strong support Stop-loss position and possible for uptrend price jump
RSI: slight bearish divergent indicating short term price pullback - buy opportunity
MACD: bullish golden cross signal line above baseline 0
Trade with affordable risk ratio 3:1
Always respect your stoploss
Good Luck
DP

KEX : CHEAPER THAN ITS IPO NO TRADING ADVICE
This one is real pain (for me)
will take long time to recover n gain trust + a lot of competitors

OR : SET INDEXI'm bored of crypto market lately...
Feel free to comment n share ur ideas
-
Trade safe and fun


NYT | DOUBLE BOTTOM BREAKOUT | ENTRY SETUP TF4HPrice Action & Chart Pattern Trading - timeframe 4H
> Double bottom - strong momentum breakout candlestick
> Entry @ PULLBACK zone position
Indicators:
> Banker smart money volume
> BBD bullish crossing baseline
> Fundflow ribbon positive change
> KDJ uptrend reversal
Trade with affordable risk ratio 3:1
Always respect your stoploss
Good Luck

CPALL : SET INDEXEVERYTHING IS ON THE CHART
(THIS STOCK IS MOST DIFFICULT TO PLAY, IMHO)
I ONLY STUDY NOT TRADING IT.
PLEASE DYOR :)
.
Feel free to comment / feedback n share ur idea

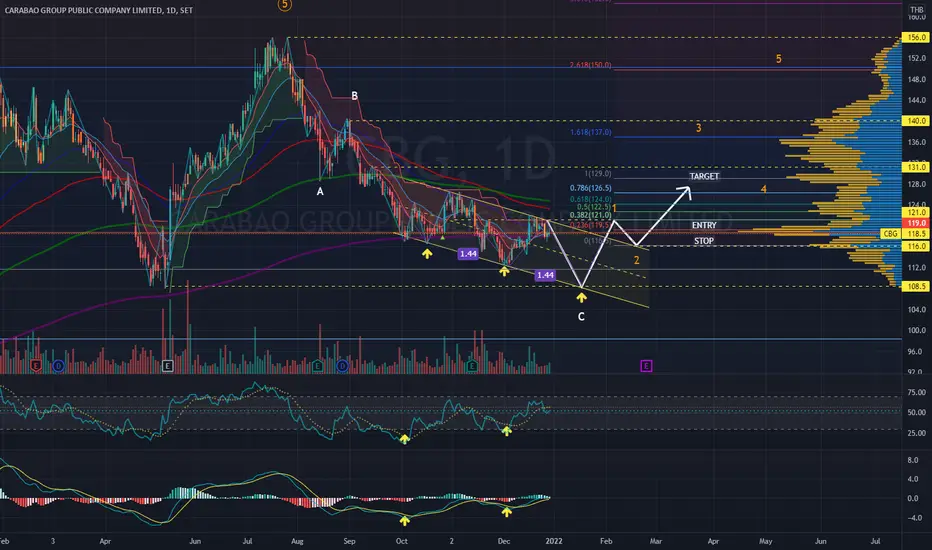
CBG | Possible upcoming powerful 3-Drive Reversal PatternCBG | Thailand SET Index | F&B Sector | Chart Pattern Trading
Price Action | Entry Position - Buy @ Breakout after pullback above Volume Profile Point of Control (POC) or EMA200
Chart Pattern | Possible upcoming powerful 3-Drive Harmonic Reversal Pattern
Indicators:
>RSI - Bullish Divergent
>MACD - Bullish Divergent
Speculative buy for bullish divergent along the way is also possible.
Always respect your stop-loss
Good Luck
SCC : SET INDEX (MONTHLY VIEW)Everything is on the chart
feel free to feedback / comment
Trade safe and sanook
