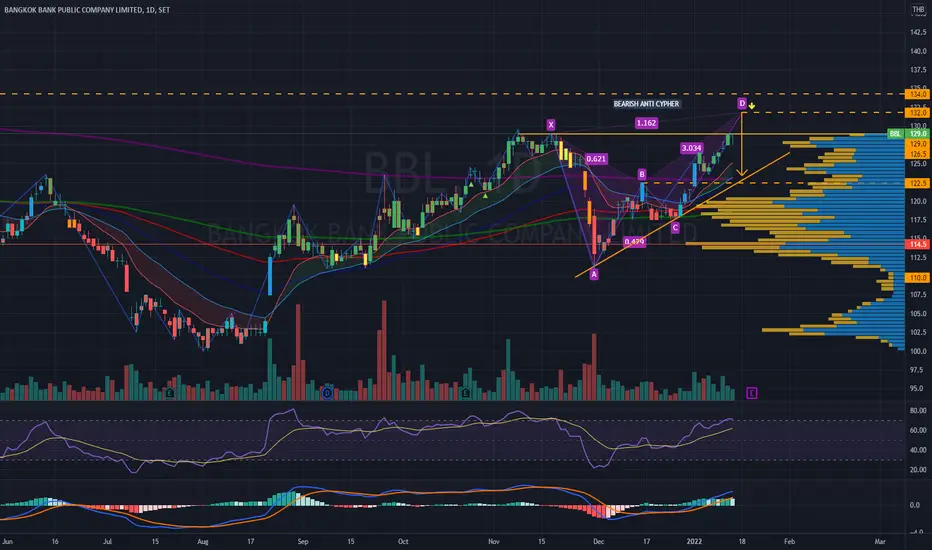
BBL | Bull trap Breakout - Bearish Anti Cypher Harmonic | BBL | Price Action & Chart Pattern Trading
> Ascending Triangle Breakout position with hidden bearish Anti Cypher Harmonic Pattern
> Enter breakout with tighter stoploss is recommended
> Target for downside also indicated.
Good Luck
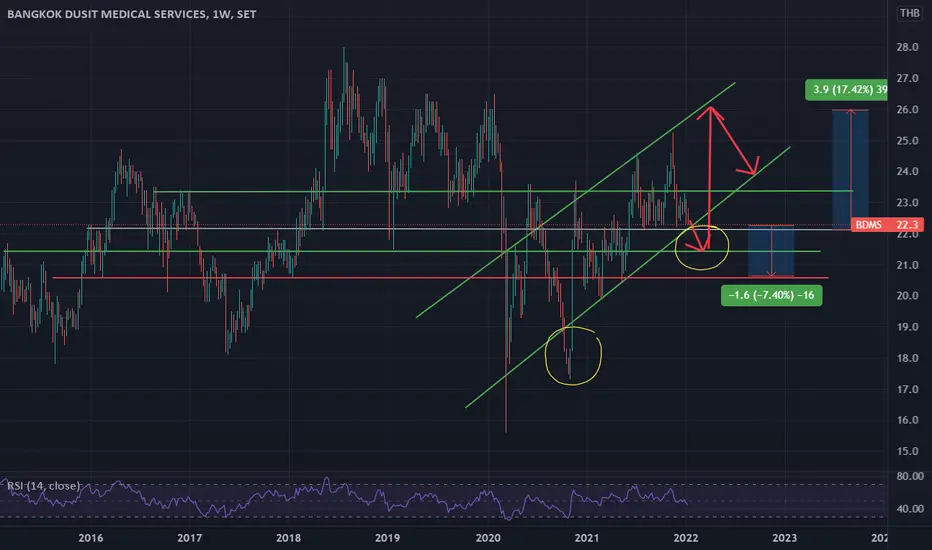
Bangkok Dusit Medical Services PCLInteresting set up - let's see if it continues to hold inside this upwards channel.
Entry- 22.2baht
Take profit- 26baht
Stop loss - 20.5 baht
ASIMAR | Bullish Flag Breakout | Medium Term Reversal TradingASIMAR| Thailand SET Index | Transportation Sector | Price Action & Chart Pattern Trading
> Bullish Flag Breakout > Entry @ Pullback
> RSI bullish divergent crossing 50 above MA line
> MACD bullish divergent golden cross above baseline.
Trade with affordable risk ratio 5:1 based on volume profile visible range key resistance
Always respect your stoploss
Good Luck

BEC | Animal Parade Harmonic Pattern| Livermore Cylinder| TargetBEC | Thailand SET Index | Media Sector | Chart Pattern Trading
The banker next move could be going for a powerful big butterfly effect to drive the price this uptrend wave What do you think?
Trade with affordable risk
Trust in your system indicator
Always respect STOP-LOSS
Good Luck
DP

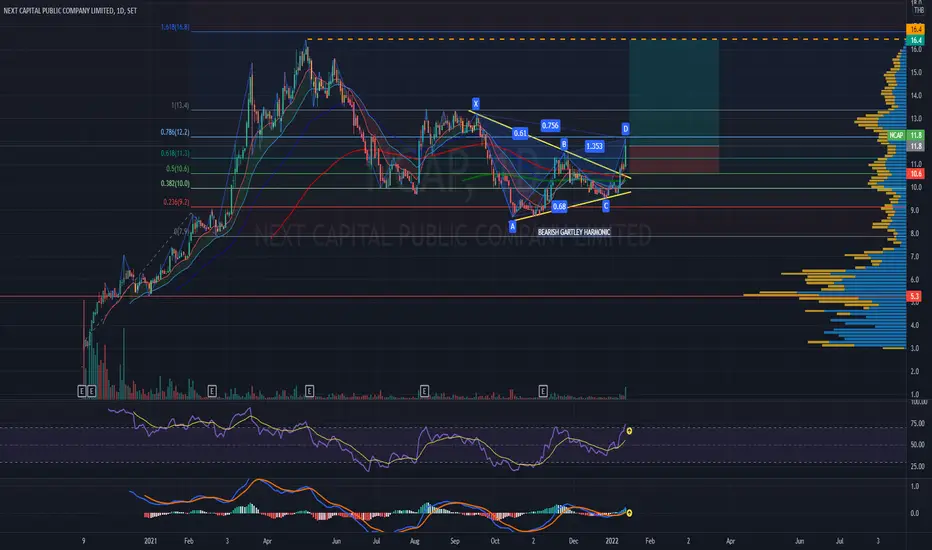
NCAP | Triangle Breakout|Bearish Gartley Harmonic|Entry@PullbackNCAP | Thailand SET Index | Price Action & Chart Pattern Trading
> Triangle Breakout with bearish Gartley Harmonic Pattern
> Entry @ Pullback with tight stoploss
Trade with affordable risk ratio 3:1
Always respect your stoploss
Good Luck
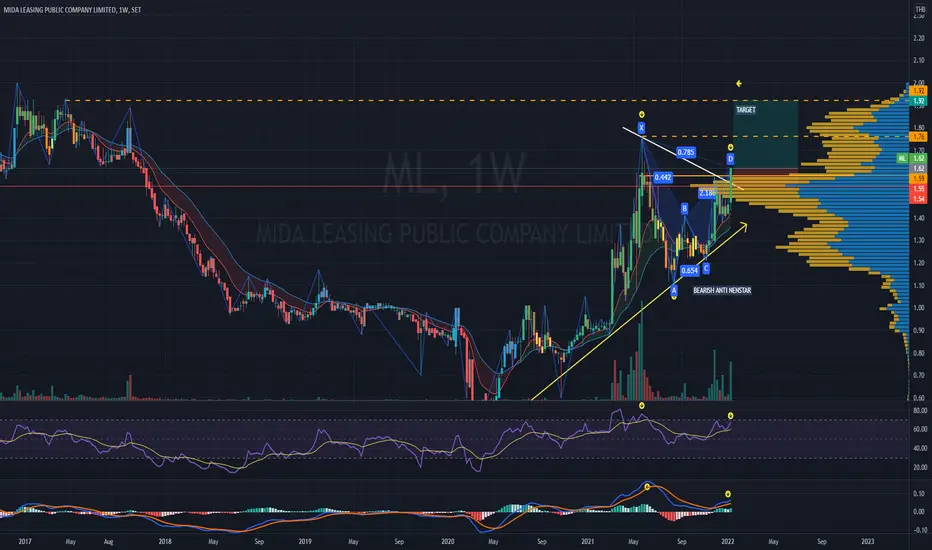
ML|Bull Trap Triangle Breakout - Bearish Anti Nen Star Harmonic Price Action & Chart Pattern Trading
> Good upside risk ratio 4:1 but beware of a bull trap
> ENTRY POSITION with tight stop-loss is recommended
> RSI & MACD Bearish Divergence
Always respect your stop-loss
Good Luck
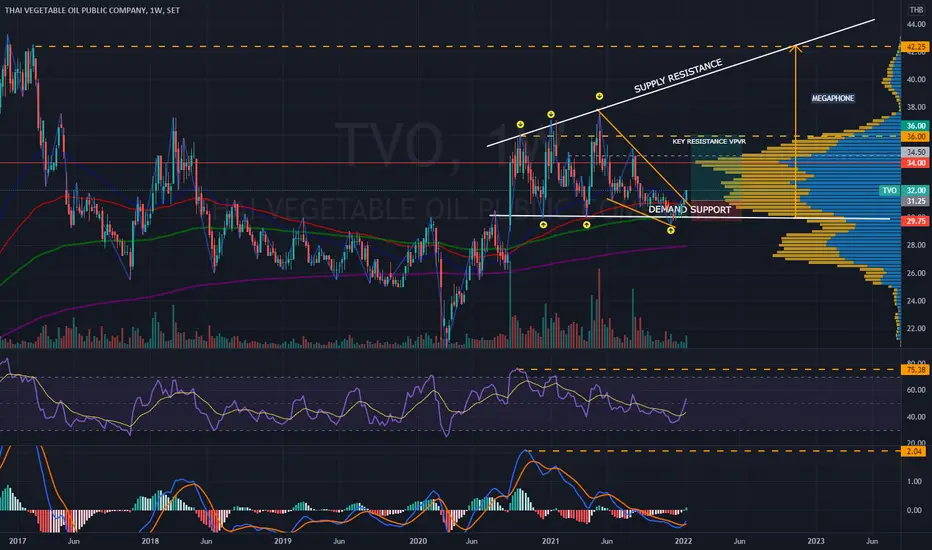
TVO | Long-term Supply & Demand Trade Setup | Weekly AnalysisTVO | Thailand SET Index | Chart Pattern Trading
> Top 10 dividend stock estimated 6+% annually
> Megaphone - Falling Wedge Reversal pattern BREAKOUT @ DEMAND SUPPORT
> Medium Term Target Zone at key Volume Profile Resistance
> RSI bullish signal cross over MA above 50
> MACD bullish golden cross signal line
Trade with affordable risk ratio 3:1
Always respect your stop-loss
Good Luck
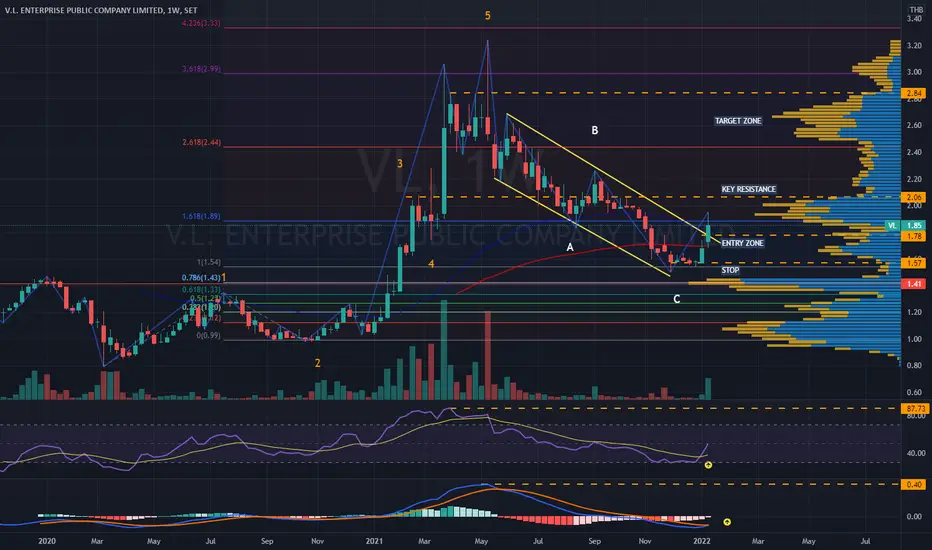
VL | Bullish Parallel Breakout | Entry & Target Zone | Weekly TFVL | Thailand Set Index | Transportation Sector | Price Action & Chart Pattern Trading
Weekly Timeframe Elliott Wave Analysis | Long-term ENTRY & TARGET POSITION
> RSI bullish signal above MA line Target = 87
> MACD Target = 0.40 bullish signal golden cross just below baseline
Long-term trade setup with affordable risk 5:1
Still always respect your stop-loss
Good Luck
Long TGPRO Target 0.72 on business ventureTGPRO buy on technical (MACD crossover weekly) Book Value is only at 0.44. With rumors of the company going into the cannabis business, investors will be interested to support the long term business. CMPR% as of today is over 1700%. Buy. First Target 0.72.

ZIGA SET Island ReversalI bought 4.9 with SL tp at previous top.
An island reversal is a price pattern on bar charts or candlestick charts that, on a daily chart, features a grouping of days separated on either side by gaps in the price action. This price pattern suggests that prices may reverse whatever trend they are currently exhibiting, whether from upward to downward or from downward to upward.

SCC moving upwards. LONG. TP: 475.00 if it breaks through 405. Long SCC, strong support, accelerated upside with MA 50 crossing MA 200. Resistance at 405, after that it's takeoff.

ESSO | Bullish ABCD Harmonic | Double Bottom BreakoutESSO | Thailand SET Index | Energy Sector | Oil Refinery | Price Action & Chart Pattern Trading
> Bullish ABCD Harmonic | Double Bottom Breakout with breakaway candlestick
>Entry @ BREAKOUT position
> RSI strong bullish signal ribbon above 50
> MACD golden cross above baseline
> Fundamental factor - high season for oil and refinery price
Trade with affordable risk ratio 3:1
Always respect your stop-loss
Good Luck

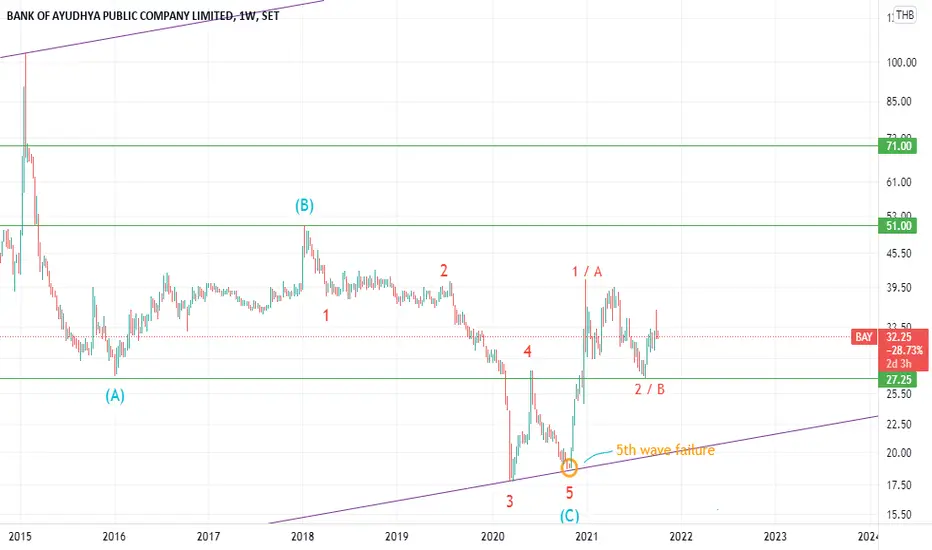
BAY (TH) - ELLIOT WAVE ANALYSIS- We can easily spotted a Zigzag correction on the chart - Intermediate (A)(B)(C)
- Intermediate (C) seems to be a 5th wave failure pattern, where price should retrace back to at least 100% of the whole wave (@51)
- TP no.2 is set at @71 - 61% retracement of the Intermediate Zigzag pattern.
- There is a possibility that we can see a new high in this bull run, but at this moment things remain uncertain.
TIDLOR | Triangle Breakout | Entry-Pullback Shooting Star candleTIDLOR |Thailand SET Index | Financial Sector | Price Action Trading
Chart Pattern: Pennant Triangle Breakout
>Price Action: Entry Zone @ Pullback - shooting star candle
>Stop-loss Zone just 3-5% below the VOLUME PROFILE - POINT OF CONTROL LINE
>EMA10 and EMA20 crossing up EMA50 main dynamic resistance.
Indicator:
> RSI & MA bullish signal
> MACD golden cross uptrend just below baseline 0
Always respect your stop-loss
Good Luck &
Happy New Year

STA | Super Powerful 3-DRIVE Harmonic Pattern-1st break 36 weekSTA | Thailand SET Index | Agricultural Sector | Price Action & Chart Pattern Trading - The 1st Breakout
> Super Powerful 3 Drive Harmonic Pattern in Week Timeframe total 36 weeks / 250 days. I totally admire the attitude of patience for the time and embracing what comes next with this kind of powerful pattern
> Entry @ Breakout Zone to confirm the reversal pattern
> RSI, MACD bullish crossing signal line
Below link for version Banker Smart Money, fund flow, and BBD Indicators
Trade with affordable risk ratio 3:1
Always respect your stop-loss
Good Luck

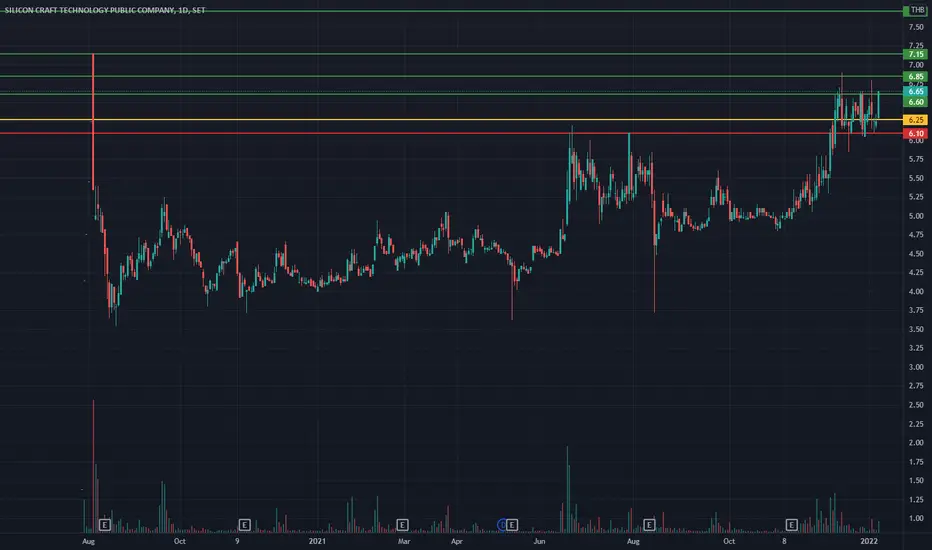
SICT Daily - Most active Volume At Open Market
- Uptrend
- Price Action
- Low Risk
- High Return if ATH
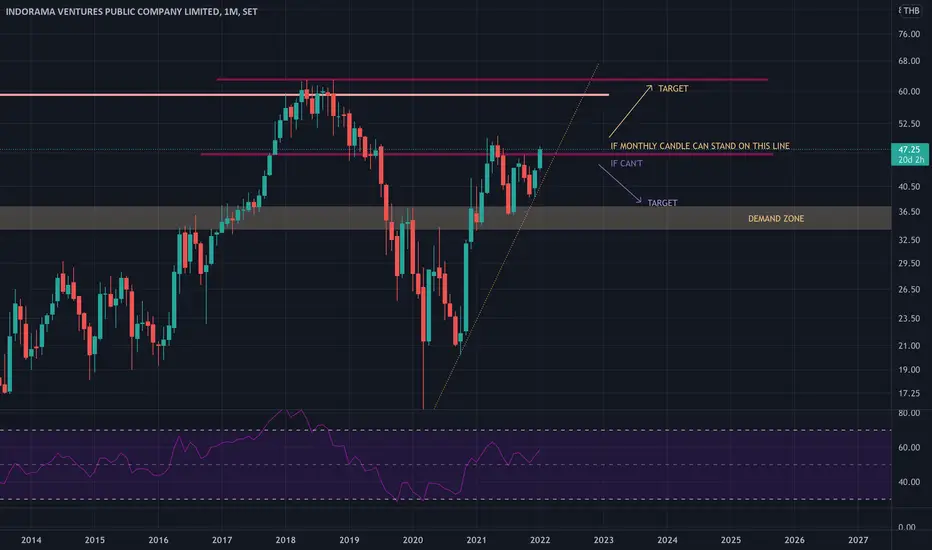
IVL : (SET INDEX)Everything is on the chart
Feel free to comment / feedback
Trade safe, always place the stop loss
TY
Mil
SDC | Powerful 3-Drive Harmonic | ENTRY@BREAKOUT SDC |Thailand SET Index | Price Action & Chart Pattern Trading
> Confirmed a powerful 3-drive Harmonic Pattern | Strong Breakout Anticipated | Wait for confirmed candlestick | Beware of Dump & Pump
Trade with affordable risk ratio 3:1
Always respect your stop-loss
Good Luck

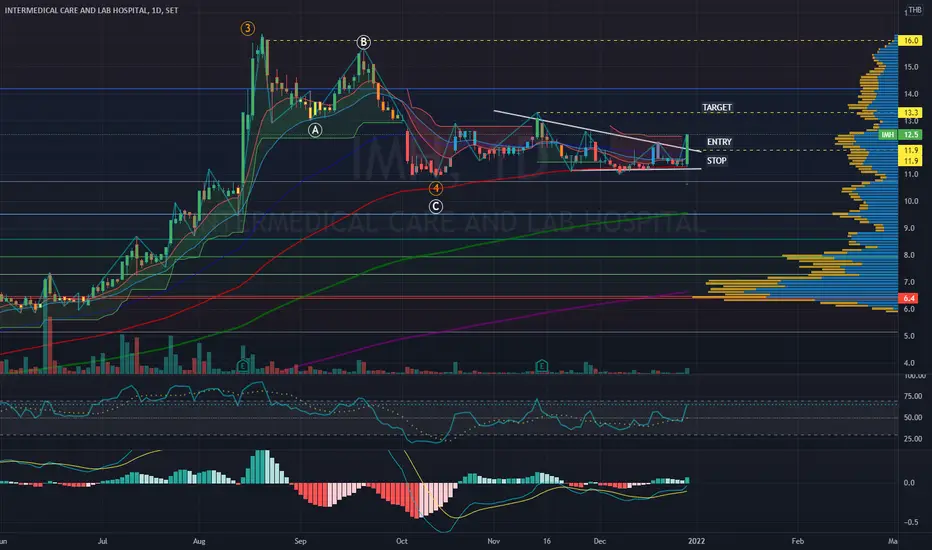
IMH | Triangle Breakout - Target Entry Position IMH | Thailand MAI Index | Service Sector | Price Action Trading
Price Action | Strong momentum bullish BREAKOUT
Chart Pattern | Descending Triangle
Possible uptrend from wave 4 to 5
Indicators:
> RSI - Bullish but not overbought
> MACD - Golden cross ribbon - crossing up 0
Always respect your stop-loss
Good Luck
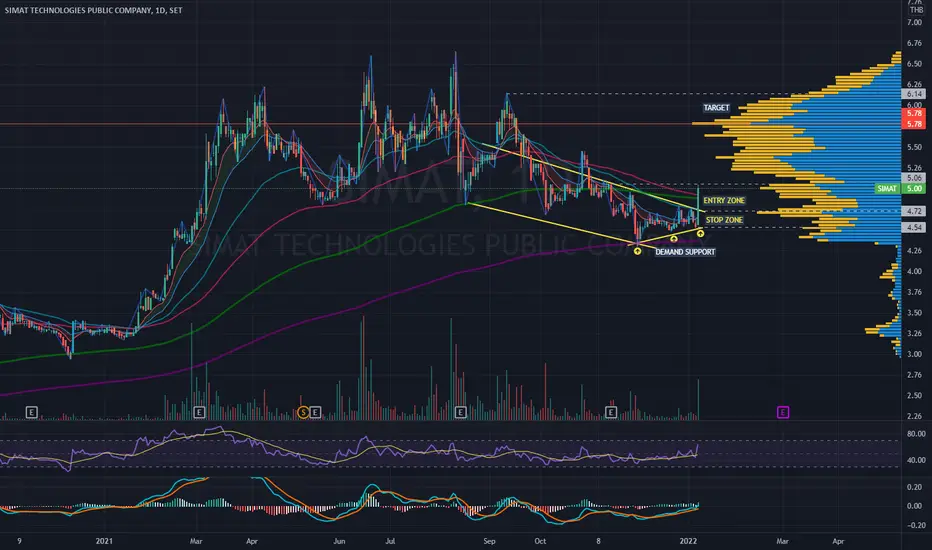
SIMAT | Bullish Wedge Breakout | Entry @ Pullback PositionSIMAT | Thailand SET Index | Price Action & Chart Pattern Trading
> Falling Wedge Reversal Pattern - Breakout with strong momentum candlestick
> Entry @ Pullback position - strong resistance volume on top of breakout candlestick
> RSI bullish cross up MA line above 50
> MACD bullish signal crossing up baseline 0
Trade with affordable risk ratio 3:1
Always respect your stop-loss
Good Luck
SKY | Ascending Triangle Breakout Position | Entry @ Pullback SKY | Thailand SET Index | ICT Sector | Price Action & Chart Pattern Trading
> Upcoming ASCENDING TRIANGLE BREAKOUT - Entry@Pullback position | strong momentum breakout anticipated
> RSI bullish signal above 50
> MACD bullish golden cross above baseline
Estimated TARGET POSITION above +20%
Strong DEMAND SUPPORT line for STOP ZONE
Trade with affordable risk ratio 3:1
Always respect your stop-loss
Good Luck

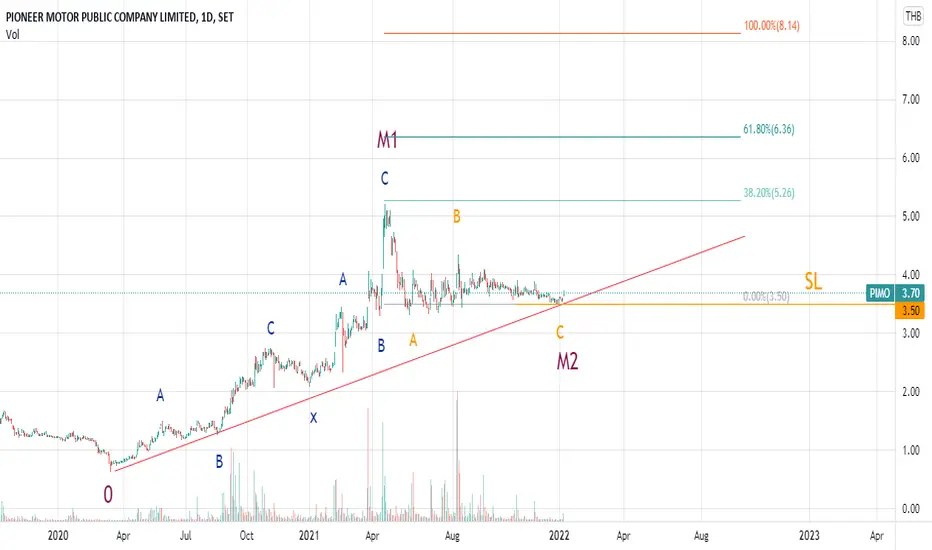
PIMO maybe pumping in few weekIf the price is not be lower than now, it'll be c-failure and coming with strong pumping but if I wrong stop loss at 3.5 about 6%