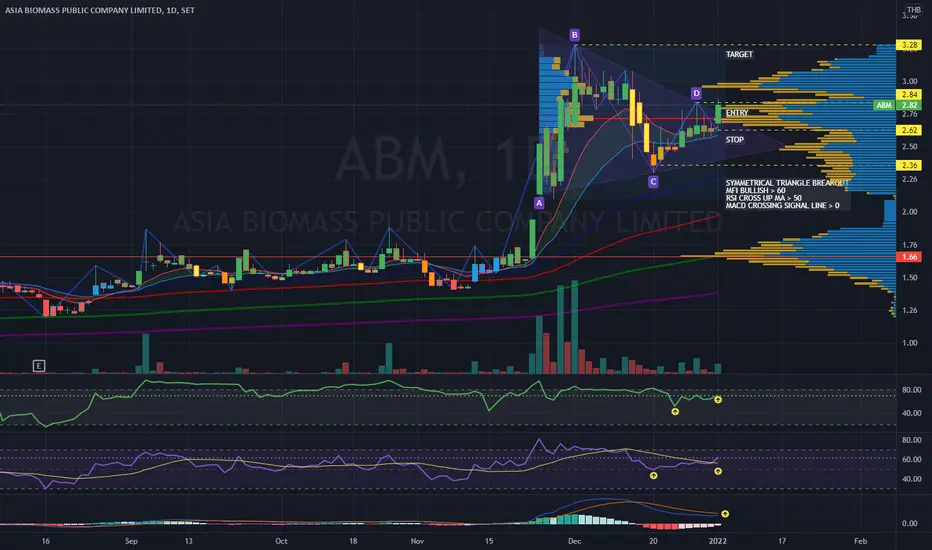
ABM | Triangle Breakout | Target ENTRY PositionABM | Thailand SET Index | Energy Sector | Chart Pattern Trading
> Chart Pattern: Symmetrical Triangle Breakout
> Price Action: ENTRY position @ Breakout with strong momentum crossing up above VOLUME PROFILE POINT OF CONTROL
> Indicator: MFI Bull momentum above 60, RSI > 50 golden cross MA line, MACD crossing up signal line above baseline 0.
Trade with AFFORDABLE risk ratio 3:1
Trust in SYSTEM indicator
Always respect STOP-LOSS
Good Luck
DP
TU | Descending Breakout | Tweezer Top Entry @ Pullback / RetestTU | Thailand SET Index | Food Sector | Chart Pattern & Price Action Trading
Descending Triangle Breakout with Bearish Tweezer Top Candlestick pattern - Wait for Entry @ Pullback at retest position
Double Bottom & Top
RSI strong bullish signal
MACD about to cross the baseline 0
Trade with affordable risk ratio 3:1
Always respect your stop-loss
Good Luck
DP

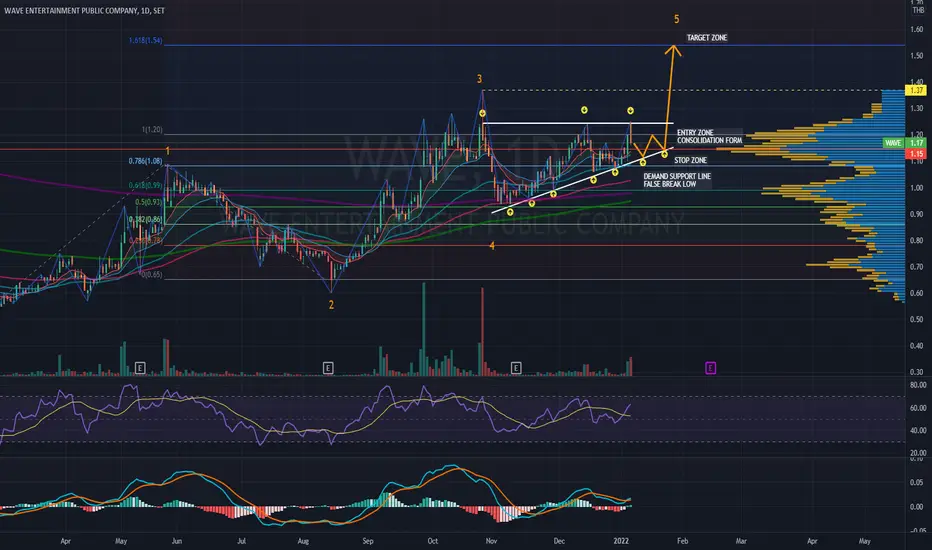
WAVE | Ascending Triangle Breakout | Elliott 3rd Wave ResistanceWAVE | Thailand SET Index | Media Sector | Chart Pattern Trading
Let's challenge ourselves to catch it before breakout once forming a tight consolidation candlestick pattern below the key resistance of Elliott Wave 3.
Chart Pattern: Ascending Triangle
Price Action: Speculative buy before the breakout
Indicator:
RSI and MACD bullish golden cross above baseline.
Trade with affordable risk ratio 3:1
Always respect your stop-loss
Good Luck
DP
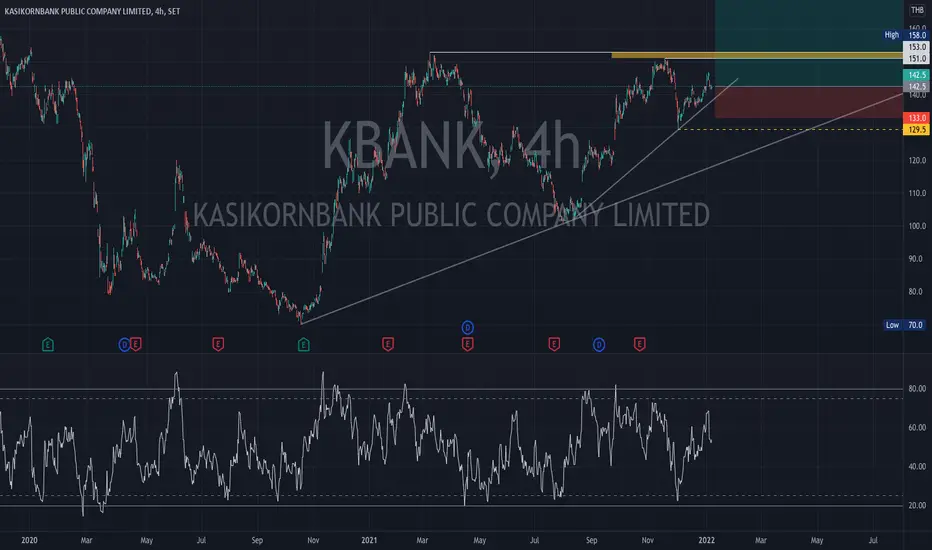
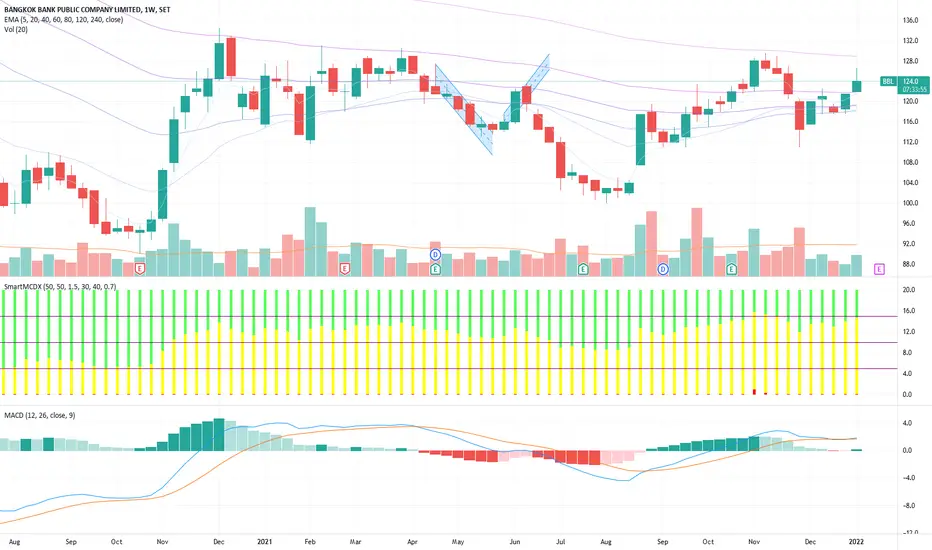
Update KBANK: Jan 8, 2022My first condition is bullish bias but the secutity price have to move and break resistance zone between 151 - 153 THB and stand on that zone with strong buyer force or large buying volume, then this security can hike up to target price around 180 THB. In another way, the price cannot break the resistance zone and stand on that zone then security price will drop to at least 123 THB.
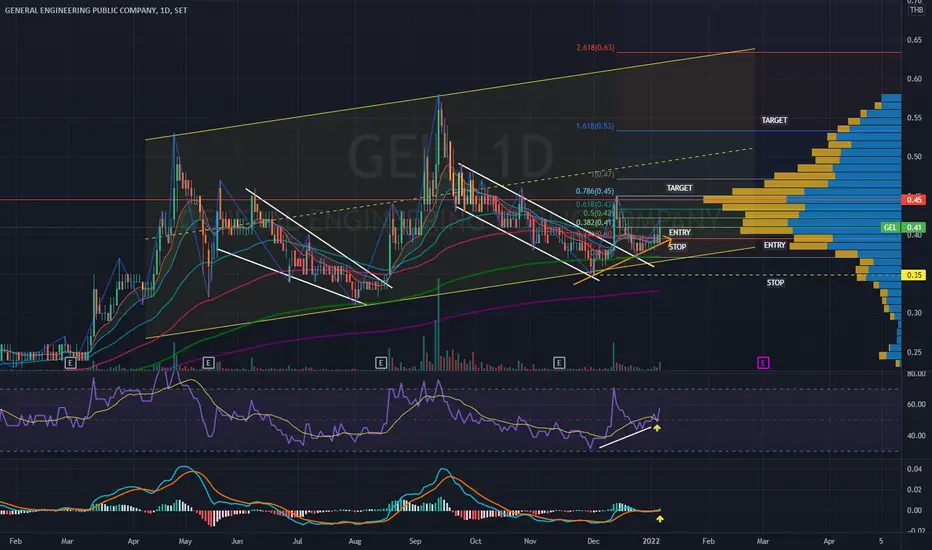
GEL | Parallel Channel Breakout | Target Entry@Pullback GEL | Thailand SET Index |Construction Material Sector | Price Action Trading
Chart Pattern: Falling Parallel Channel Bullish Reversal
Price Action: Bullish Breakout Entry at PULLBACK position
Target estimated for short-term / long-term shot
Indicator:
> Support line just above EMA200
> RSI bullish signal above MA line
> MACD golden cross above baseline 0
Trade with affordable risk ratio 3:1 at least
Always respect your stop-loss
Good Luck
DP
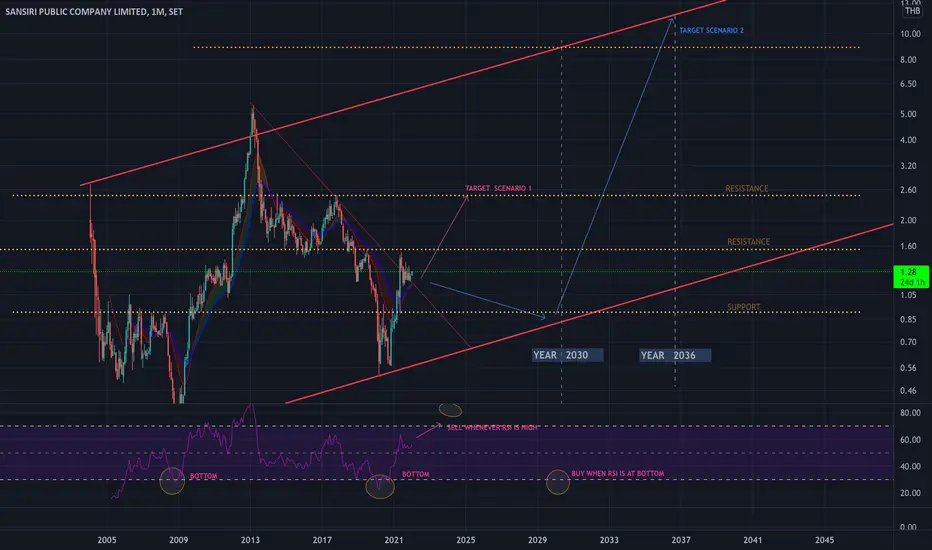
SIRI : Everything is on the chart,
Actually I really like the CEO.. He's skillful, great executive vision and very well-management
If I didn't do this technical analysis then I'd think it could grow a lot faster
but this is the normal speed of real estate sector i guess.. .
For the time line its only estimation. I could be faster
Fundamental is great, the company is investing in crypto/digital asset
more info DYOR
Thai SET impact from covid19 delta and omicron bad omensBBL ; price plummetted after fear started , when situation got to the worst, price already go up for days, as many can speculate the end of delta wave
at a point, price open gap up, which favor strategy of short and DCA buy back over weeks
gap up 23 aug , dropdown wks=... not quite gap down, more gradual price downtrend, downswing = 9, upswing= 11
kbank ; gap up 23 aug , dropdown wks=4, downswing = 9, upswing= 13
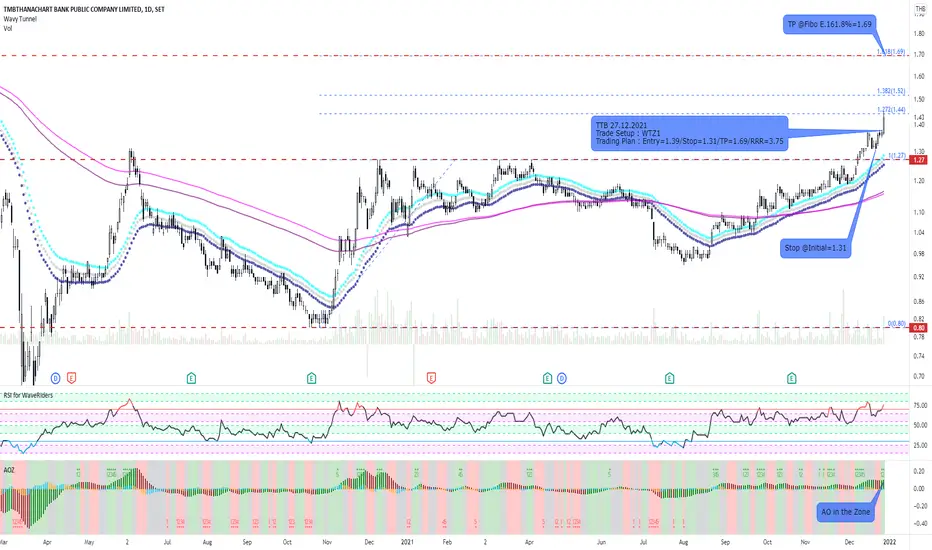
TMB bank (TTB) ; gap up 23 aug , dropdown wks=4, downswing = 17, upswing= 20+ up to now(jan22)
siam cement company (SCC) ; same time gap up but last only 2-3 wks then down for 14 wks, now on uptrend for 4 wks but will see extent of omicron impact
siam cement's paper&packaging company (SCGP) since ipo in 2020 it soared up and up, its theme of online shopping play important role in covid-era. So contradicting price fall
when others went up in late august & start 6 wks downtrend. jan 2022 might start another down trend, as we already had 13 uptrend candles (TD sequential 13)
but will SCGP be seen as covid-defensive stock might limit its downside
From my humble, non-expert, nooby personal opinion, Thai's bluechip stocks could be in danger of omicron impact.
Fundamentally ; afternoon of 5th Jan 2022, SET start falling, without apparent drop but retrospectively ,we guessed insider who seen omicron rising selling a chunk. 6th is public awareness of both us interest rate amped up & earning yield gap in downtrend, Thailand’s institutional side sells twice as much as foreign investor with 3x local investor buying the SET at 1660.
growth of income/profit from SET100/SET50 depends on both domestic economy & tourism alike which both of which would be crippled by this covid19's wave
Technically ' Thai's SET50 index plummetted 8 of last 8 times it hit resistance/support of 979- 999.
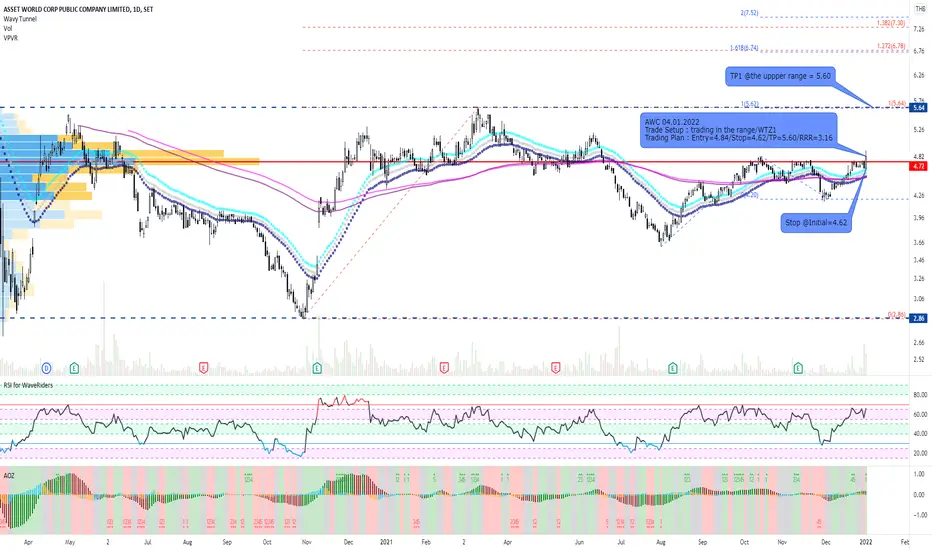
AWC and WTZ1 SetupBefore expecting WTZ1 trade Setup, we could take this opportunity to speculate AWC testing the upper range due to closing above POC of VP with gained volume. I made the 1st plan for trading preparation. If it can break out the upper range, we will make another plan for this stock. Good Luck
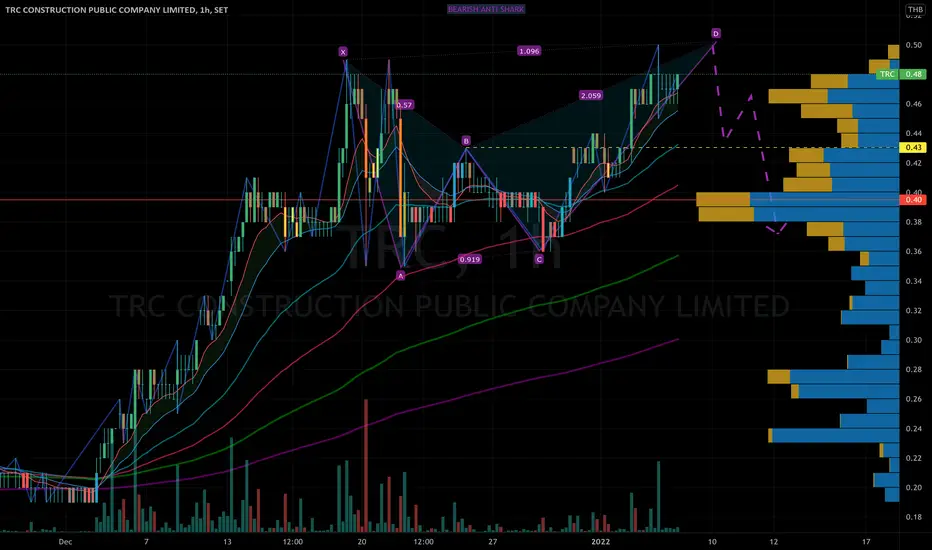
TRC | Bull Trap Beware | Anti Shark Bearish Harmonic | DowntrendTRC | Thailand SET Index | Construction Sector | Chart Pattern Trading
Chart Pattern: Anti Shark Harmonic Bearish Pattern - Bull Trap
Price Action: Short Entry @ low breakout recommendation - Target Downtrend at the Shark tail
Good Luck
DP
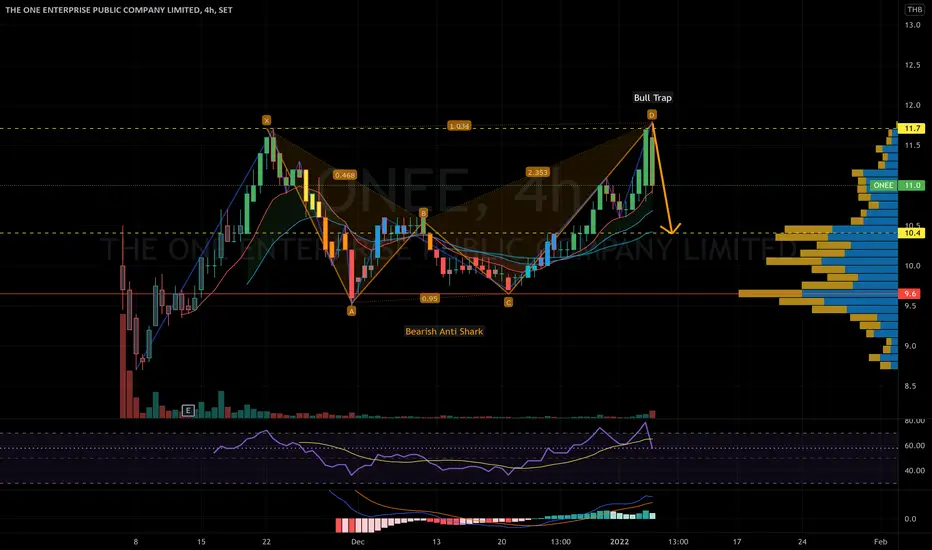
ONEE | Bearish Anti Shark Harmonic | Bull Trap | Entry@Pullback?ONEE | Thailand SET Index | Media Sector | Price Action & Chart Pattern Trading
Chart Pattern: Anti Shark Bearish Harmonic
Price Action: Short Entry @ Breakout avoid Bull Trap and could be entry @ pullback position for speculative buy
Indicator:
> RSI down dead cross MA line still on high bullish side above 50.
> MACD remains upside above baseline 0
Stop-loss @ Shark’s tail position - target at shark’s head until further new pattern changes
Trade with affordable risk ratio 3:1
Always respect your stoploss
Good Luck
DP
MDX | Bearish ABCD Harmonic Pattern | Completed 5th Elliott WaveMDX | Thailand SET Index | Energy Sector | Price Action & Chart Pattern Trading
Chart Pattern: Bearish ABCD Harmonic Pattern
Price Action: Short Entry @ Low Breakout Channel
Completed Elliott 5th Wave correction ABC phase. What do you think? let me know

WIN | Strong Momentum Rising Window Candle- Triangle Breakout WIN | Thailand MAI Index | Price Action & Chart Pattern Trading
Chart Pattern: Symmetrical Triangle Strong Momentum Breakout - possible new high Elliott 5th Wave Extension
Price Action: Entry @ New High Breakout supported with strong momentum with Rising Window Bullish Candlestick
Indicator:
> RSI: Bullish signal cross up MA line
> MACD: Golden cross way above baseline 0 - indicating strong bullish

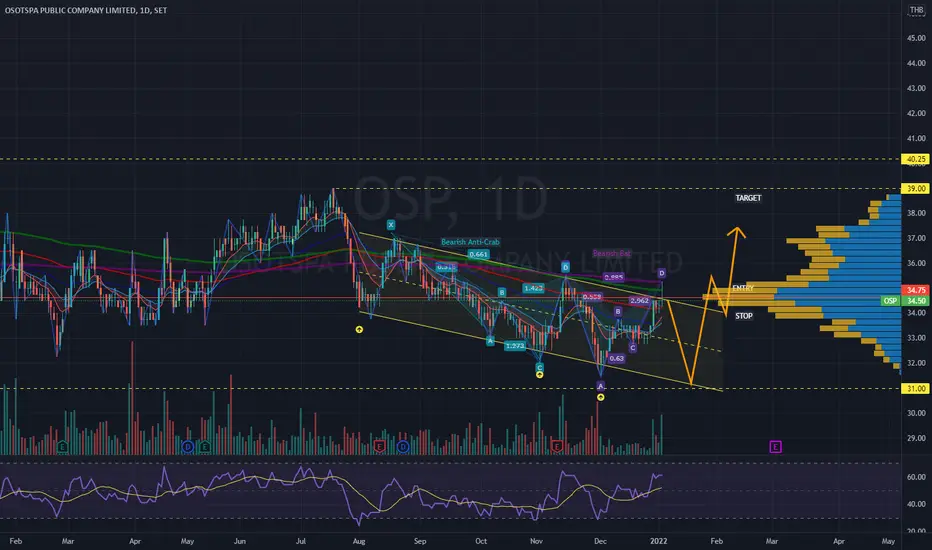
OSP | Bull Trap | Falling Channel Harmonic Pattern | Tight StopOSP | Thailand SET Index | Food Sector | Chart Pattern Trading
Chart Pattern: Falling Channel Bearish Harmonic Pattern
Price Action: Watch out for BULLISH TRAP and FLASE REVERSAL BREAKOUT or Make ENTRY with tighter STOP-LOSS
Indicator:
> RSI & MACD Bullish Trap
Trade with affordable risk
Trust in your system indicator
Always respect STOP-LOSS
Good Luck
DP
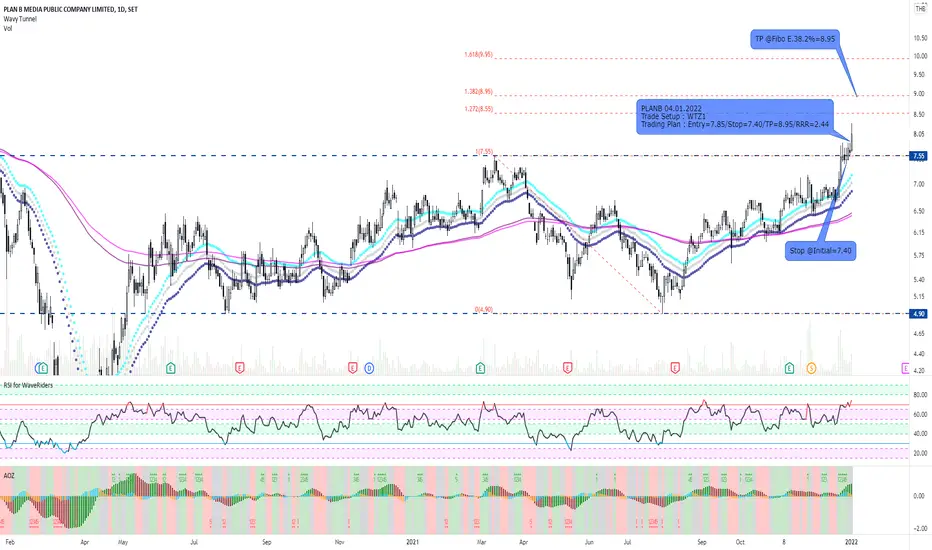
PLANB and WTZ1 SetupPLANB just broke out the range after retraced the upper range and hit the new high. We expected the next fibo E. level could be the next target as the same level of the previous high.
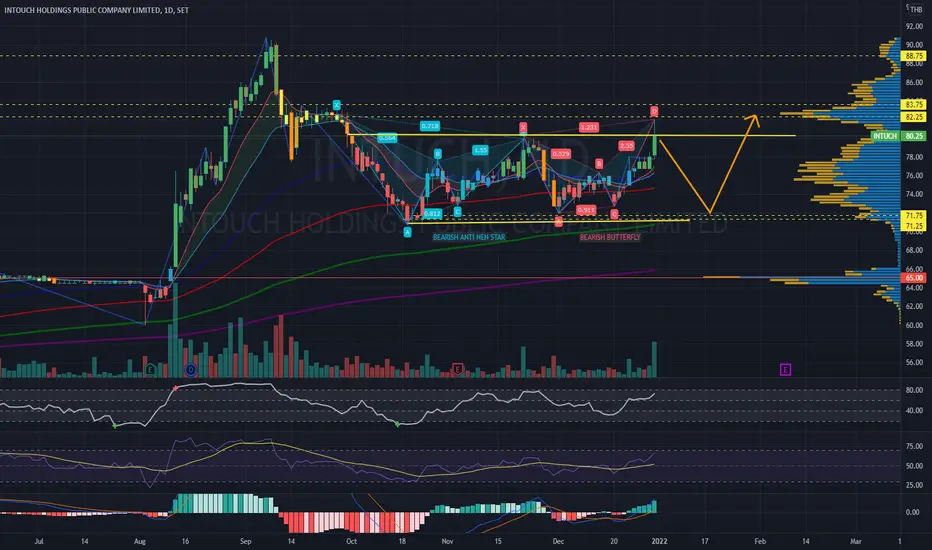
INTUCH | Bull Trap | Bearish Butterfly Harmonic PatternINTUCH | Thailand SET Index | ICT Sector | Chart Pattern Trading
> Chart Pattern: Bearish NEN STAR and BUTTERFLY in PARALLEL CHANNEL - Bull trap
> Price Action: Beware of BULLISH TRAP | Entry Position@Breakout with tighter stop-loss
> Indicator: BULLISH TRAP
Trade with AFFORDABLE RISK
Trust in your SYSTEM
Always respect STOPLOSS
Good Luck
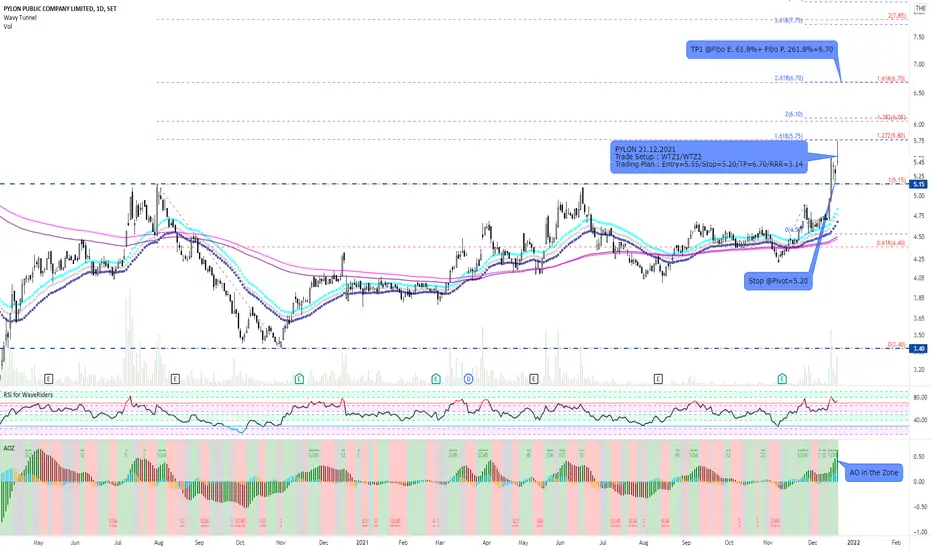
PYLON and WTZ1/WTZ2 SetupPYLON and multi trade setup (WTZ1 after breaking out trading range and WTZ2 when forming on impulse wave). Consider and manage your risks before take the order. Good luck
IP | Falling Wedge Reversal| MFI Divergence | Elliott 4th Wave?IP | Thailand SET Market | Price Action Trading | Elliott Wave Tracing
Chart Pattern: entering Falling Wedge Reversal Pattern
Price Action: Downtrend area of consolidation
Entry Position: Buy on BREAKOUT of FALLING WEDGE
Indicator:
> MFI - Money Flow Divergence - Banker accumulation phase
> RSI - Sideway up below 50
> MACD - Golden cross below baseline 0
Trust SYSTEM & INDICATOR | Never panic trade
Trade affordable RISK | Ratio 3:1
Always respect STOP-LOSS
Good Luck

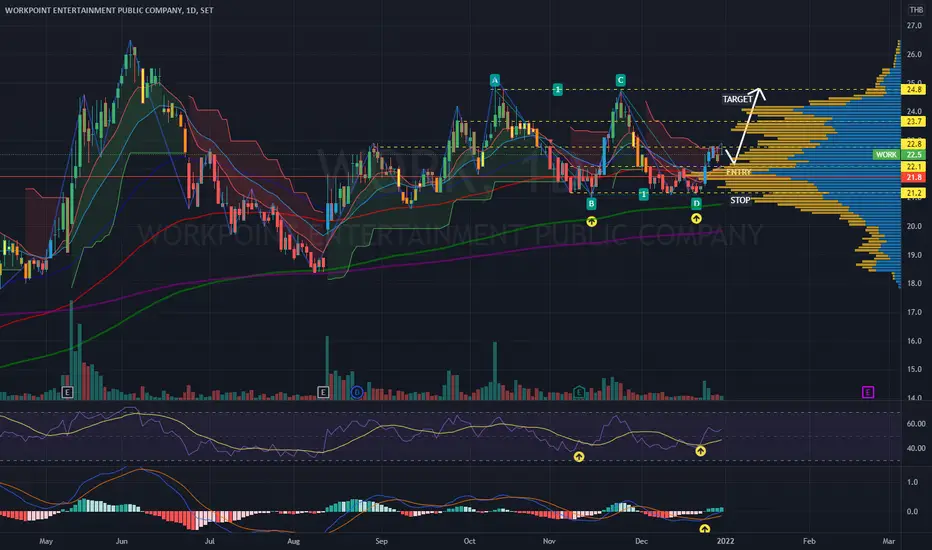
WORK | Harmonic ABCD | Entry @ Pullback |Gravestone DOJIWORK | Thailand SET Index | Media Sector | Price Action Trading
Chart Pattern: Harmonic ABCD Bullish Pattern
Price Action: Entry @ Pullback from bullish breakout with Gravestone DOJI candlestick
Stop-loss Position - 3 - 5% below Volume Profile POINT OF CONTROL
Risk Ratio: 3:1 minimum
Indicator:
> RSI bullish divergent crossover
> MACD golden crossing over baseline 0
Always respect your stop-loss
Good Luck
HNY 2022
ITEL | Bullish Flag Breakout | Entry PositionITEL | Thailand SET Index | ICT Sector | Price Action Trading
Chart Pattern: Falling Wedge Reversal
Price Action: Bullish Breakout with Breakaway Candle
Indicator:
> RSI & MACD golden cross above baseline
Placing your stop-loss 5-7% below the entry, there may be some pullback
Risk ratio: 3:1 minimum
Always respect your stop-loss
Good Luck

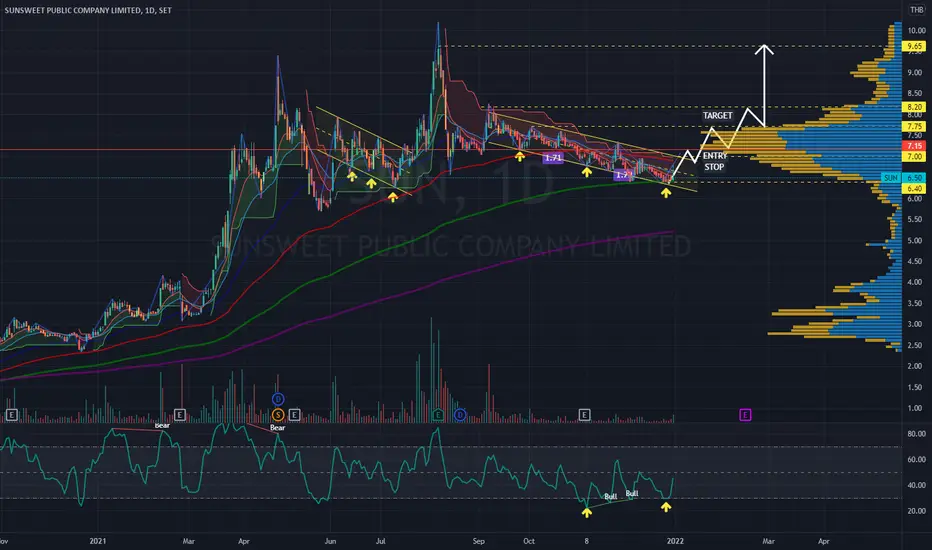
SUN | Possible Powerful 3-Drive Harmonic Pattern |Entry@BreakoutSUN | Thailand SET Index | Food Sector | Chart Pattern Trading
Chart Pattern: Possible a powerful THREE-DRIVE HARMONIC REVERSAL
Price Action: Entry@Breakout and Retest Area of Support
Indicator: RSI Bullish Divergence
Always respect your stop-loss
Good Luck
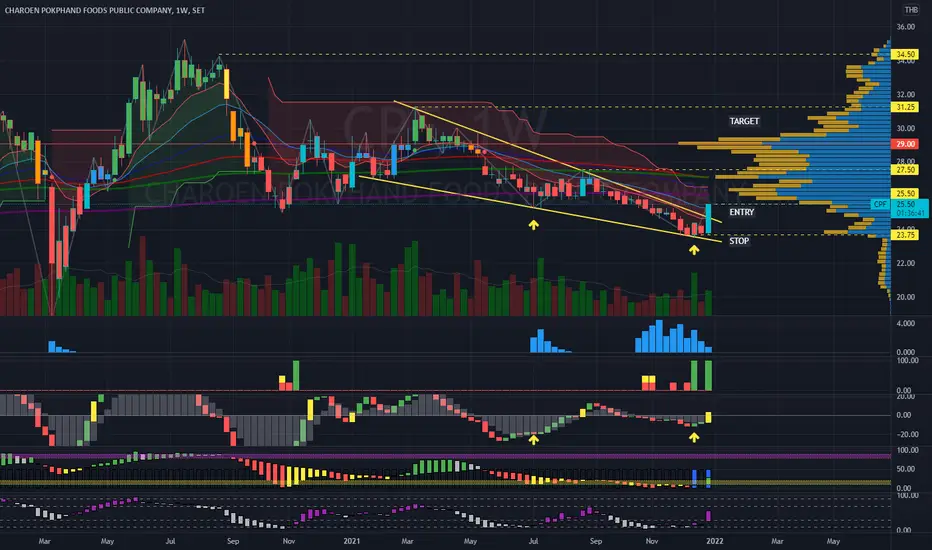
CPF | Week Timeframe | Bullish Wedge Breakout | Entry & Target CPF | Thailand SET Index | Food Sector | Price Action Trading
Price Action | Bullish Engulfing candlestick strong momentum
Chart Pattern | Falling Wedge Bullish Breakout
Indicator:
> Banker Smart Money & Chip Volume Support
> BBD Banker divergent signal
> Fund Flow uptrend bottom signal
> KDJ STO on the uptrend channel
Place your stop-loss zone 5-7% below ENTRY
Recommended Risk Ratio minimum 3:1
Always respect your stop-loss
Good Luck
IRPC | Bullish Wedge Breakout | Target for uptrendIRPC |Thailand SET Index | Energy Sector | Price Action Trading
Price Action | Bullish Breakout
Chart Pattern | Reversal Wedge
Indicator:
> MFI - Money Flow-in support
> RSI Bullish Signal
> MACD golden cross - crossing up 0
Fundamental Factor: Oil price bullish trend
Risk Ratio: 3:1 minimum
Always respect your stop-loss
Good Luck

TTB and WTZ1 Trade SetupFor TTB, we had first entry 2 month ago as a pre-buy signal. Some positions have been liquidated due to hitting the target price. However, this is another opportunity to trade on WTZ1 setup. Good luck.