ADVANC| Trend reversal | retesting Falling Wedge EMA50ADVANCE | Thailand SET Index | ICT Sector | Price Action Analysis | SL - Falling Wedge Support Line
> Recent breakout uptrend channel of trade into downtrend channel - Falling Wedge Pattern - Primary WAVE 4 - ABC correction phase
> Possible trend reversal - wait for positive Banker Fund Flow signal before entering
> Retesting the Falling Wedge Support line if failed, possible to drop to EMA100.
> Smart Money signal - wait for fund flow divergent to confirm
> Volume Accumulation Index turning to Distribution (green color)
Upside fundamental factors:
> Positive +YOY upcoming earnings
> Current laggard stock price

PTTGC | Target downtrend | Falling Wedge Reversal PatternPTTGC | Thailand SET Index | Petro Sector
> Estimated target downtrend with Falling Wedge Reversal Chart Pattern
> Multiple BOTTOM signal
> CCI | MACD | RSI divergent signal continued
> Buy signal - wait for confirmed breakout pattern before entering

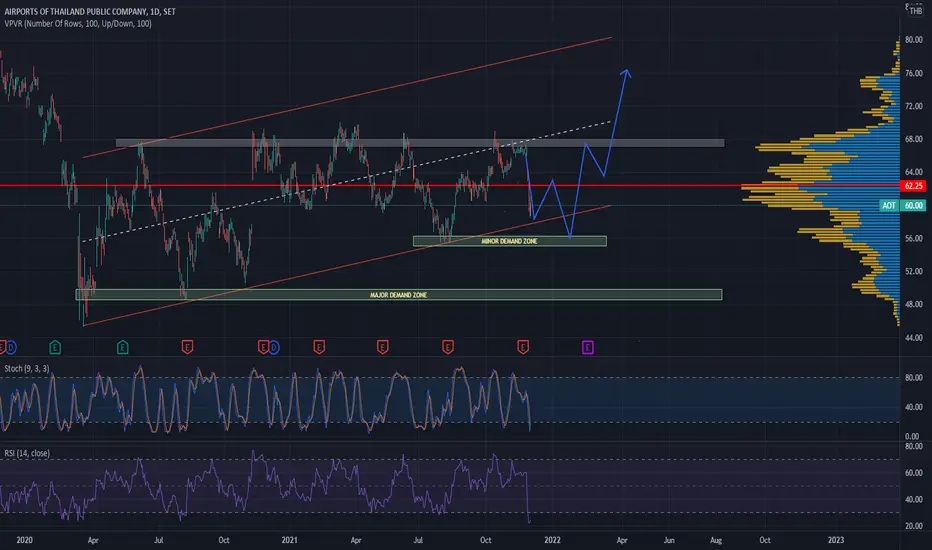
AOT ideaAOT in TFDAY, After COVID epidemic and lockdown in Thailand on MAR'20. AOT is a sideway market.
I'm waiting for buy at minor demand zone.
TP1 : 63.00
TP2 : 67.00
SL : 54.00
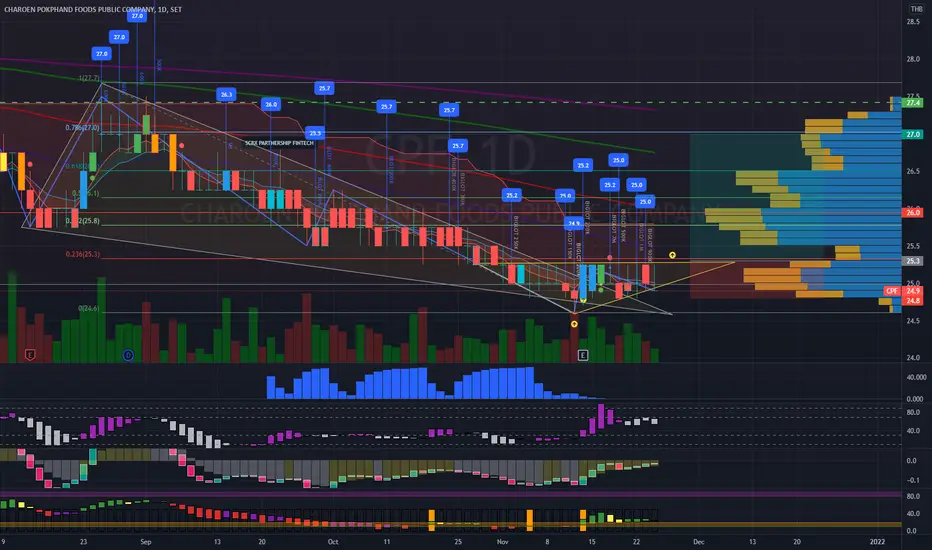
CPF | Trend Reversal Pattern Rising Triangle CPF | Thailand SET Index | Food Sector | Trend Reversal Chart Pattern | Rising Triangle
> Wait for candle breakout
> Multiple Bottom signals
> Banker Chip & Big Lot volume continuous supports
> MACD approaching golden cross (crossing up 0)
> RSI Ribbon strong divergent
Stoploss just above triangle bottom - Price Target at Fibo 0.786 - 1.00
Risk Ratio 1:3 minimum
TTA | Q321E Strong result speculative buy TP12.0 SL9.5TTA | THAILAND SET index | Transportation Sector | Chart Pattern| Price Action
> Buy Signal - Wait for Falling Wedge confirmed BREAKOUT / Possibly retest the resistance level 10.0
> RISK RATIO: 1:3
Always respect your stop-loss,

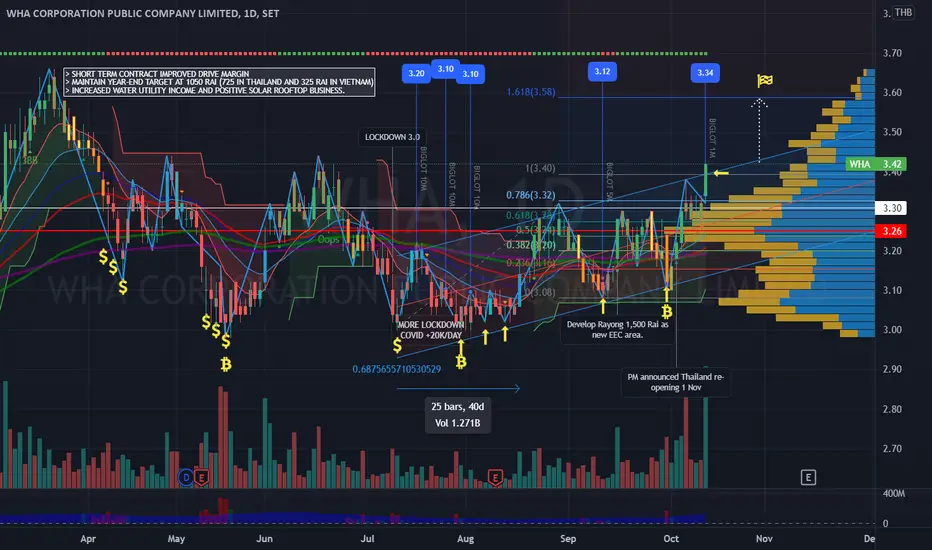
WHA | Breakout channel of trade | buy signal | TP 3.60 SL 3.30WHA breakout channel of trade upward trend - strong buy signal target price 3.60, stop loss 3.30
> Strong volume big lot 1 mil share push
> VA dominant on buy side
> positive BBD banker chip / fund flow
> average broker annual target price 4.80 - 5.00.
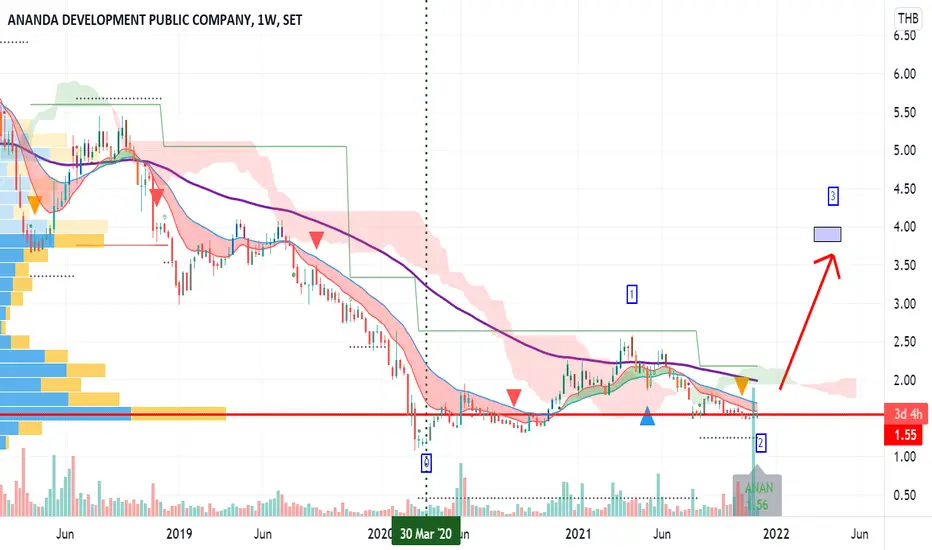
Low downside risk..It's time to speculate buy ANANPrice above VPVR 1.50. Suspected Wave2 is about finished as price retraced 61.8%
Wave 3 may begin soon with TP 3.8-4 bht (161.8%)
High volume bar a couple days ago may indicate accumulation
Cheap P/BV = 0.42
Stop Loss @ 1.46
It's time to buy DELTADELTA price broke VPVR @450, Money flow > 0 first day, positive pattern in TDigator/TD sequential
Target price 580-600
Stop Loss if price < 450

PTTEP | Q321E +40% Sell On Fact | Buy signal@RSI reboundPTTEP | Thailand SET Index | Price Action Analysis
This is my 3rd Buy position and decided not to take profit as the oil price continue to claim.
> Chart Pattern: Double Top and declining to test the Supertrend support.
> Banker Chip Volume support at EMA50 @ 117.0
> Buy position when RSI rebound, TP1: 127.0 TP2: 140 Timing mid-term trading about 1-2 month SL: slightly below EMA50
Always respect your stop-losses!
Best of luck

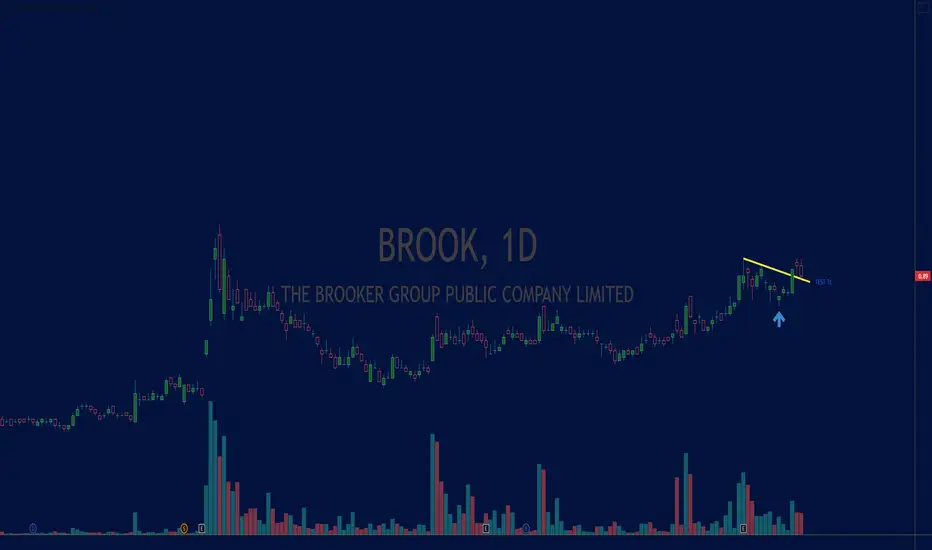
TEAMG will be back in the trend and go to the moon? SET:TEAMG
The high price with peak volume support the strong trend. Will TEAMG be launched to the moon?
First target will 3.52/ 3.80/ 4.12/4.64 ….
While the ceiling is 4.28 for today.
“High risk high return” will be kept in mind.

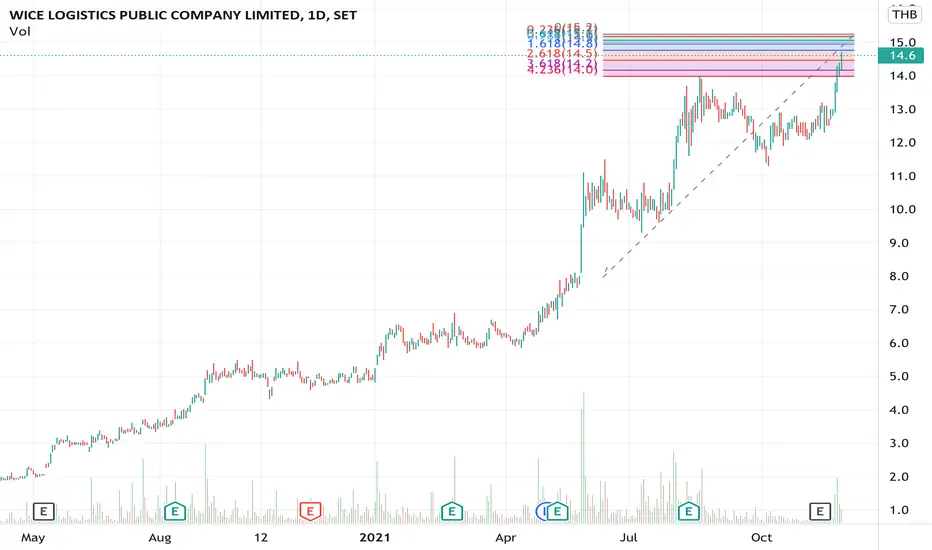
Wice is one stock with strong fundamental support. SET:WICE
Wice is one of my favorite stocks which has profit over Covids19 and still keep in the strong trend in price until hit new ATH at 14.00 baht.
The Fibonacci extension target will be 14.7 and next 15.9.
However the price is going up around 100% this year, please consider to invest.
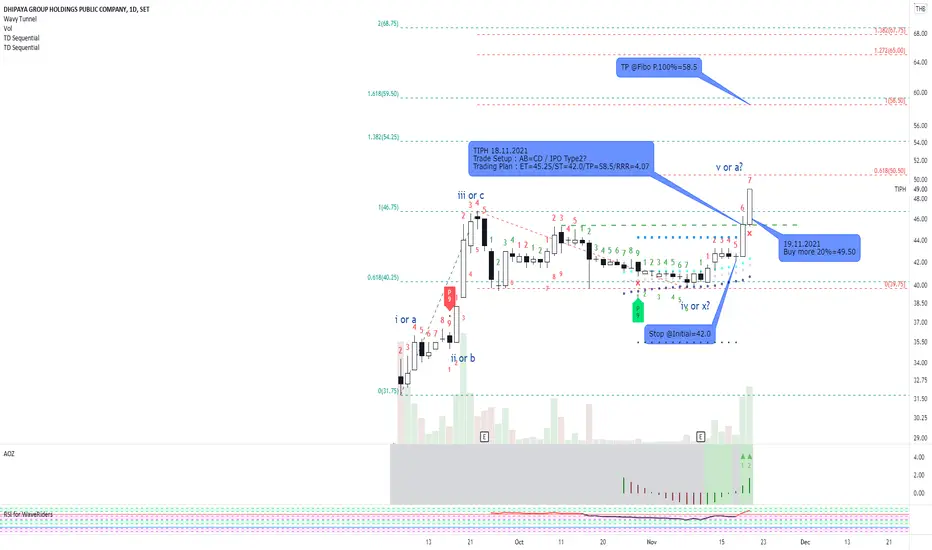
TIPH and AB=CD Trade SetupTIPH and AB=CD Trade Setup. According to this pattern, if it breaks out the previous high or at least the end of b of wave iv, it possibly to test the Fibo. P. 100% as the same level of Fibo Ext. 61.8%. The price breaking TDST L. is another supporting signal to decide to buy TIPH. at the limited risks. Take this opportunity and control your risks well.
Jmart Day 48.75 (at the end of the road, prepare to go down)Jmart Day 48.75 (at the end of the road, prepare to go down)
+1. Price Arrival at the end of the road 2.618%
+2. The 50.50-50.75 line is a significant resistance.
caused by the overlapping of the Fibo line
---------
Sell strategy
First target 45.75-46.50 if unable to stand down
Target two 42.75-43.25

CBG | Potential Trend Reversal | Falling Wedge Breakout TP 132 CBG | Thailand SET Index | Food Sector | Price Action & Chart Pattern Analysis
Potential Trend Reversal - Short Rebound | Bullish Divergent Signal |
> Falling Wedge Breakout Target Price 132.0 based on Double Bottom - Stop Loss EMA400 or 1st Bottom 117.0
> Big Lot volume support continuously
> Banker Fund Flow positive
> RSI strong divergent for a bullish signal
To avoid false breakout, highly recommend waiting for a bullish violation of the last higher low.
Always respect your stop-loss,

TOP | Elliott Wave Correction ABC Wave Position | MFI Divergent TOP | Thailand SET Index | Energy Sector | Correction ABC Wave about to end - Expect a rebound in near future.
> MFI Money Flow Index Divergent
> RSI tapping oversold position
> Elliott Wave Correction C position estimated at 1.0 of A Fibonacci.
Wait for a completed C position rebound signal or breakout before entering our first lot.
Stoploss can be placed at the lowest point of the C position.
Always respect your stop-loss,
Goodluck

BEC| Buy Signal Breakout | Strong Q321 TP 14.5 SL 12.5BEC | Thailand SET Index | Media Sector | Chart Pattern Breakout
> Bullish Butterfly Pattern - Channel trend breakout
> Strong Banker Chip and Big Lot volume support
> Banker Fundflow positive trend
> Supertrend/ CDC Action Buy Signal
> RSI uptrend
> Strong Q321 fundamental result performance
> Target Price 1| 14.5 Stop-loss 12.5 Risk Ratio 1:3
Always respect your stop-loss,
Goodluck

Thai Airways International - THAI BULLOnce the country starts opening up, expanding operations more you'll see a flow of interest enter the market.
You know me, know my trading style I BUY LOW SELL HIGH!
Expecting this one to rally soon enough.
Thailand is the Tourist go to destination!
SET:THAI
Thai Airways International - Since 1961

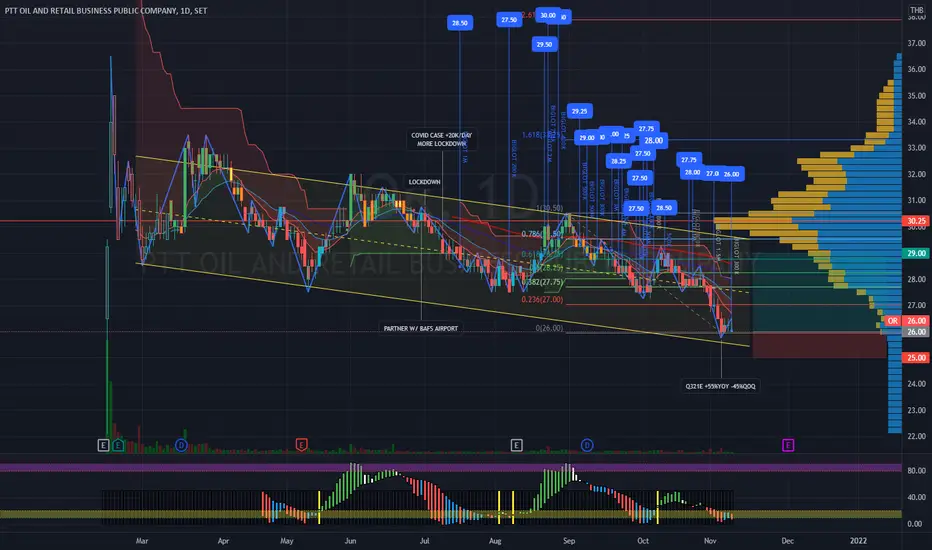
OR | Q3/21 E +55%YOY -45%QOQ Company Performance Spec BuyOR | Thailand SET Index | Chart Pattern | Price Action | Speculative Buy Target Price 29.0
> OR | Q3/21E Strong financial performance +55% YOY -45%QOQ
> Reversal Falling Flag Chart Pattern
> Buy position at Falling Flag Support Line 26.0
> Stoploss just below the support line 25.0
> Risk ratio: 1:3
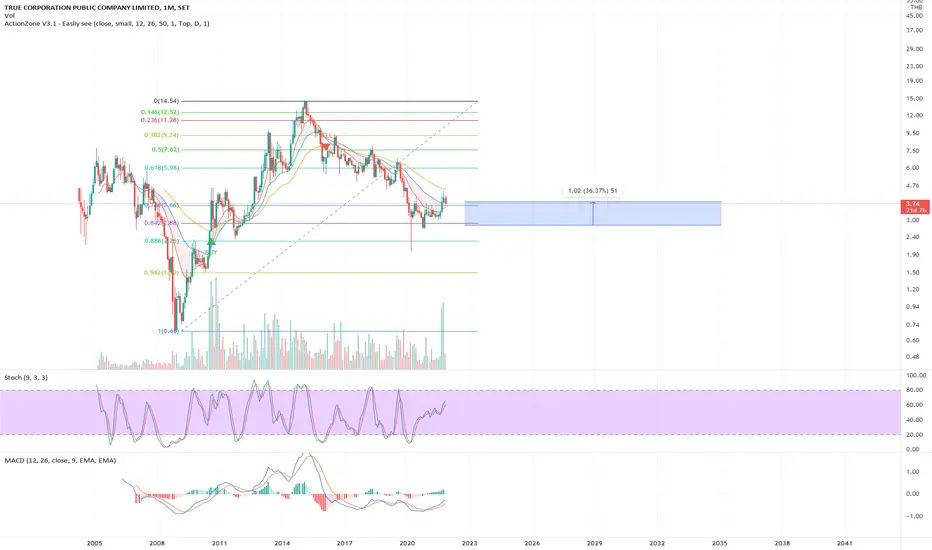
True Digital correction end and will move up up upTrue Digital correction end and will move up up up
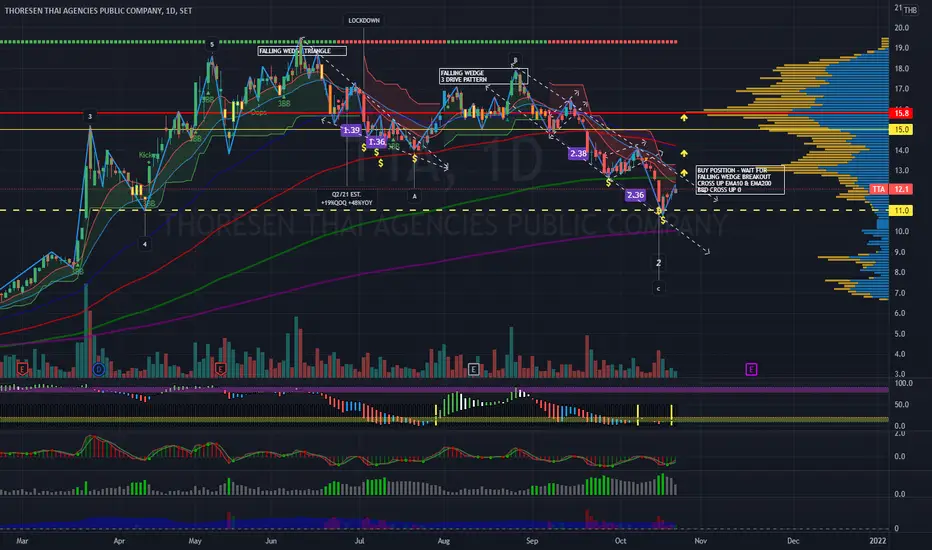
TTA | Re-entry Point Breakout Falling Wedge 3 Drive PatternTTA | Thailand SET Index | Transportation Sector
Target Price 16.00 at Volume Profile POC | Aggressive Stop loss at Falling Wedge downtrend line or conservative SL 11.0.
Risk ratio: 3.5
After a sharp declining trend crossing below EMA200 - completing Elliot Wave 2 Grand Supercycle, a possible bullish chart 3 DRIVE PATTERN
> Buy position | Re-entry point at Falling Wedge Breakout
> Crossing up EMA10 / EMA200 - signal for uptrend
> Previously strong Smart Money and Banker Chip signal
> Triple bottom of 3 Drive Pattern - a reversal pattern
> Q321E expected outstanding financial performance
www.kaohoon.com
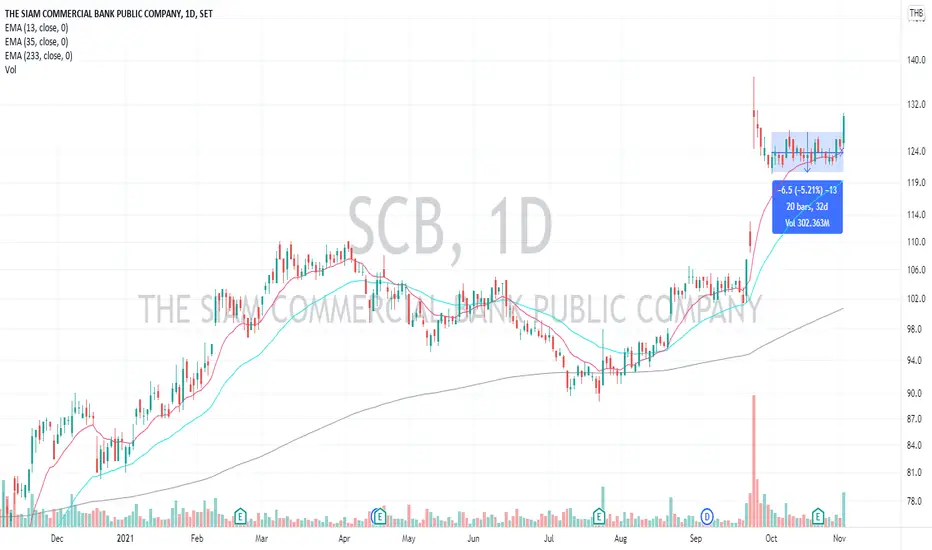
SCB Buy Again after gap openning14:14Oct 26, 2021Reuters
Thailand's Siam Commercial Bank to take on rivals with delivery 'super-app'
//
but the app didn't make profit on SCB.