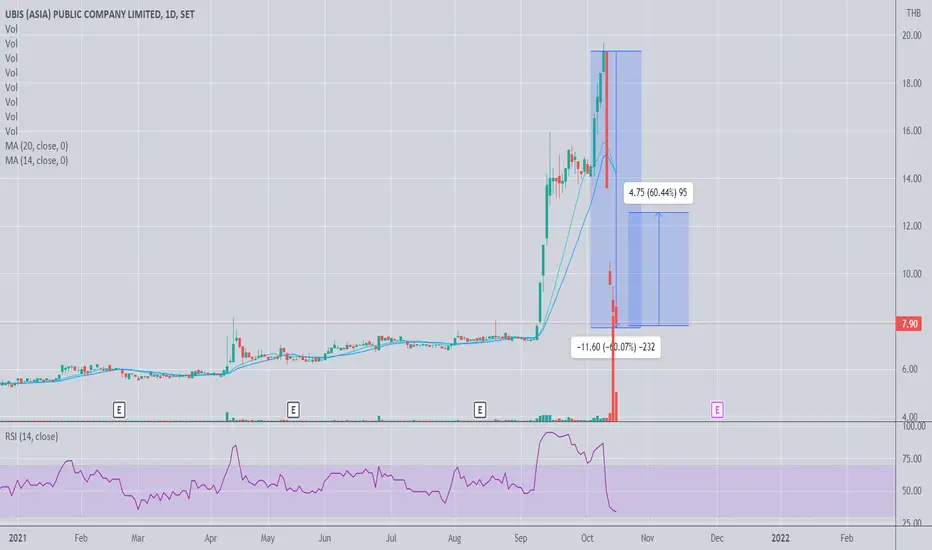
UBIS - Target : 12.5It is very oversold. Down 60% in a few days. Based on my experience, UBIS should be able to rebound to at least 12.5.
RCL | About to make Grand Supercycle Wave 2: TP 107.50 SL 40.00RCL | Thailand SET Index | Transportation Sector | Possible Wave 2 of Grand Supercycle - TP 107.50 Stop Loss Conservatively 40.00 (EMA200)
First Buy: 44.00
Second Buy: golden cross EMA10
Third Buy: cross up EMA20 or breakout downtrend channel of trade
Key indicators:
> Truly aggressive Banker Share Volume turned green and Smart.
> BBD signal about to cross up 0.
> Smart Money and Bottom
> All-time high BDI index

AS.W2 | Cross up Volume Profile POC 13.0 - Follow Buy SignalAS.W2 | Thailand SET Stock Market | Media Sector | Warrant
> Cross up Volume Profile POC 13.0 - Buy Signal, Stoploss EMA35 12.0
> Risk ratio 2.5
> Target Price 16.0 estimated based on recent Inverse Head&Shoulders

TTA with WTZ2 in DowntrendTTA with WTZ2 in Downtrend. Take the opportunity and control your risks well.

AS | Inverse Head & Shoulders Breakout Testing Support NecklineAS | Thailand SET | Media Sector | On-line Gaming
A Breakout Inverse / Reverse H&S Testing Support Neckline - possible go up with new TP 22.5 setup if support failed might drop to EMA100 or EMA200 to complete Elliot Wave correction phase A-B-C position.
> Aggressive Stop Loss 14.0 @EMA50
> Conservative SL 15.0 @Banker Chip / Smart Money Support

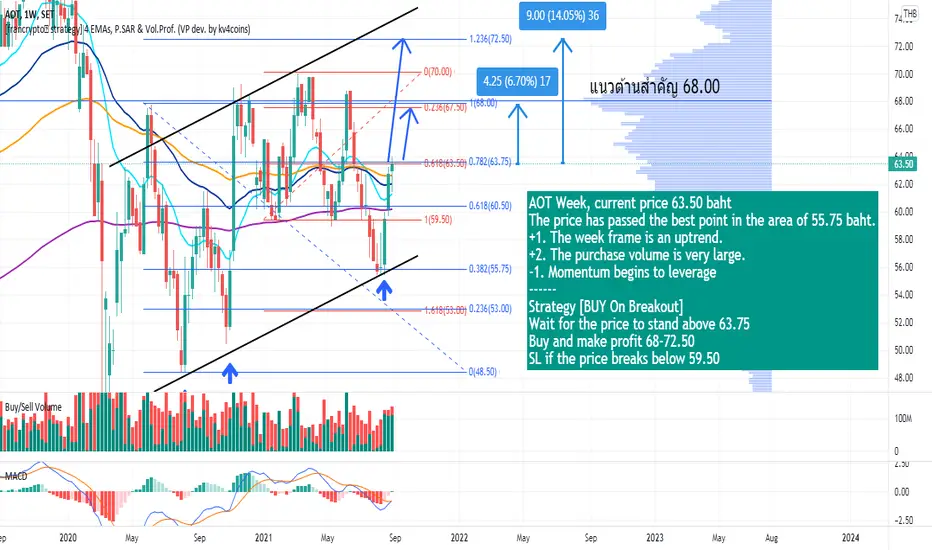
AOT Week current price 63.50 bahtAOT Week current price 63.50 baht
The price has passed the best point in the area of 55.75 baht.
+1. The week frame is an uptrend.
+2. The purchase volume is very large.
-1. Momentum begins to leverage
------------
Strategy
Wait for the price to stand above 63.75
Buy and make profit 68-72.50
SL if the price breaks below 59.50
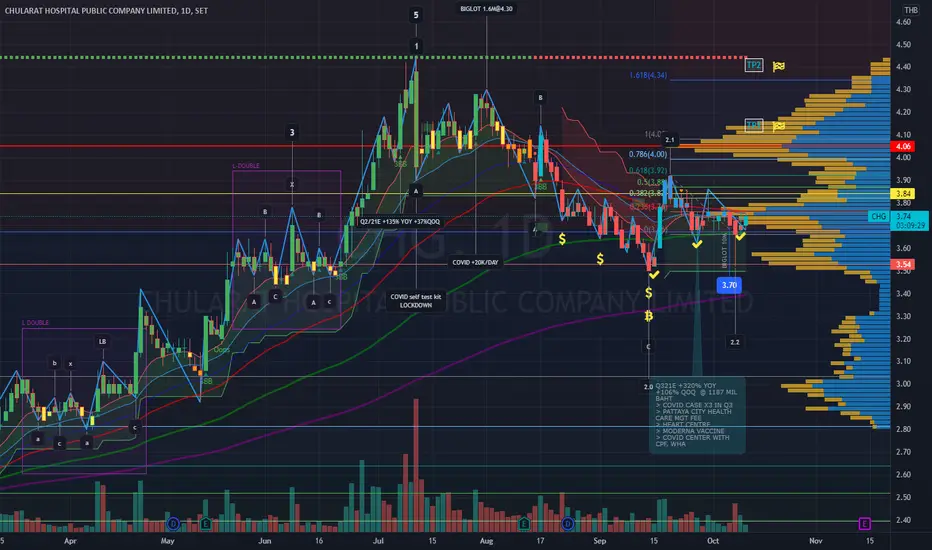
CHG | Buy Signal Doubled Bottom @EMA100 TP1 4.00 (+10%), SL 3.50CHG | BUY SIGNAL DOUBLED BOTTOM AT EMA100: 3.66 - Target Price 1 = 4.00 (+10%), Target Price 2 = 4.30 (+18%) Stop Loss = 3.50 (-6%)
> Fibo Ext. estimates target Elliot Wave projection 1,2, and 3 @TP 4.3 (+18%)
> Q321E +321% yoy, +106% qoq from COVID case x3 during 3rd lockdown
> Pattaya health mgt. fee
> Newly launch Heart Center - Samutphrakarn, Rayong
> Upcoming Moderna Vaccine
> Covid Center with CPF and WHA
> Broker Final Target Price at 4.80
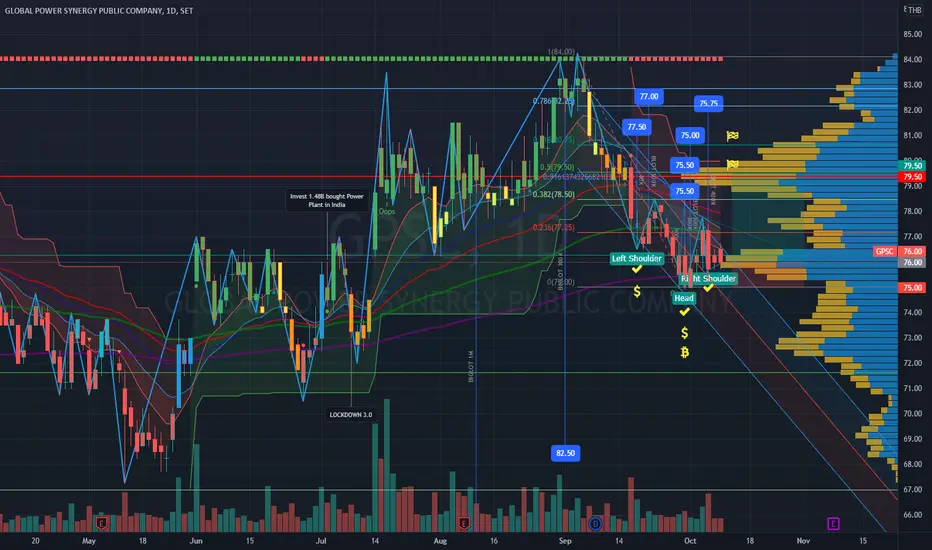
GPSC | Buy Signal-Inverted Head & Shoulders TP 80 (+5%) SL 75GPSC Buy Signal Position | Smart Money | Big Lots | Banker Chips | Inversed Head & Shoulders Target Price 1: 80 +5%, stop loss 75.
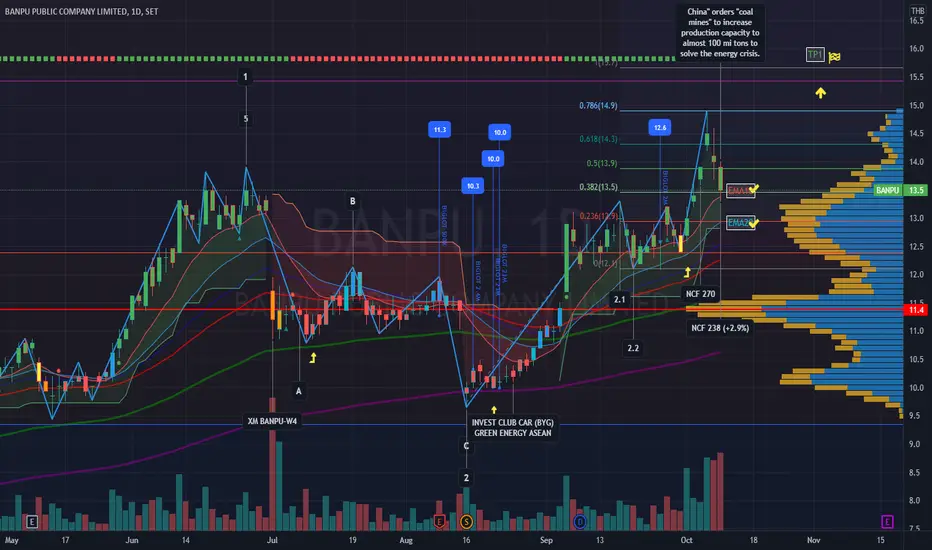
BANPU | Crossover EMA10 | Possible Re-entry@EMA20 | TP 15.7 +21%BANPU recent crossover EMA10 due to sudden decline of coal price and China restarting domestic coal production. China" orders "coal mines" to increase production capacity to almost 100 million tons to solve the energy crisis. China orders more than 70 coal mines
> Target Price 1 @ 15.7 based on Elliott wave extension projection.
> Stop Loss EMA50 @ 12.3
> Possible buy zone @ EMA10, EMA20 | 13.5, 12.9 - Buy position @ banker chip fund flow turned positive on day timeframe.
> New Castle Coal Price all time high this week at 270 and declined slightly to 238 still on the rise.
> BANPU.W4, BANPU.W5 trading this week making the stock more attractive.
TU | Head & Shoulders | Dropped below EMA50 | SL 20.5TU dropped below EMA50 after previous Head & Shoulders pattern making its way to reset current uptrend wave.
If dropped below 20.5 and possibly going into corrective wave C position at EMA200.
Stop Loss 20.5

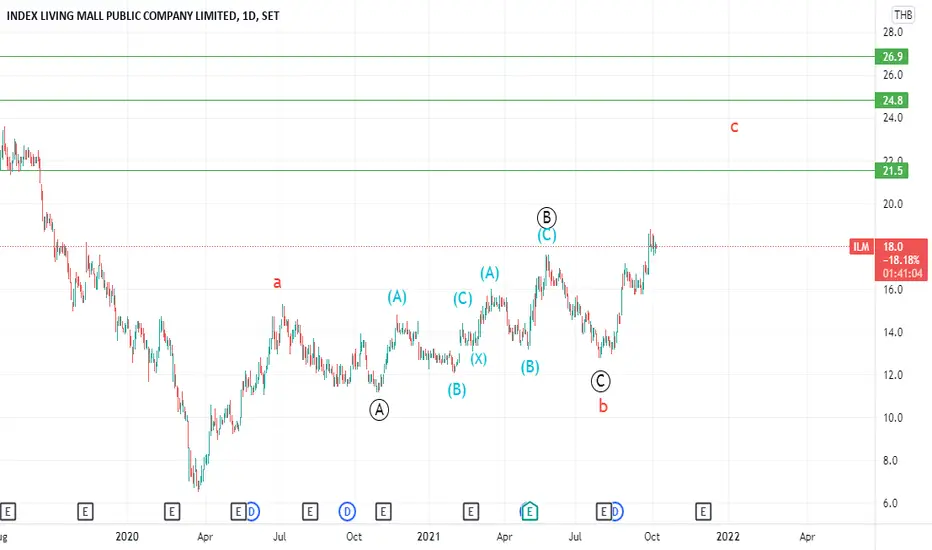
ILM (TH) - Elliot Wave Analysis- CYCLE ABC pattern where the CYCLE WAVE B seems to be a strong b + c-failure pattern. This shows us that we can expect an aggressive thrust of the CYCLE WAVE C pattern with strong resistant at the given level on the chart.
- INTERMEDIATE WAVE (B) of CYCLE WAVE B seems to be a non-standard correction with a hidden wave (X).
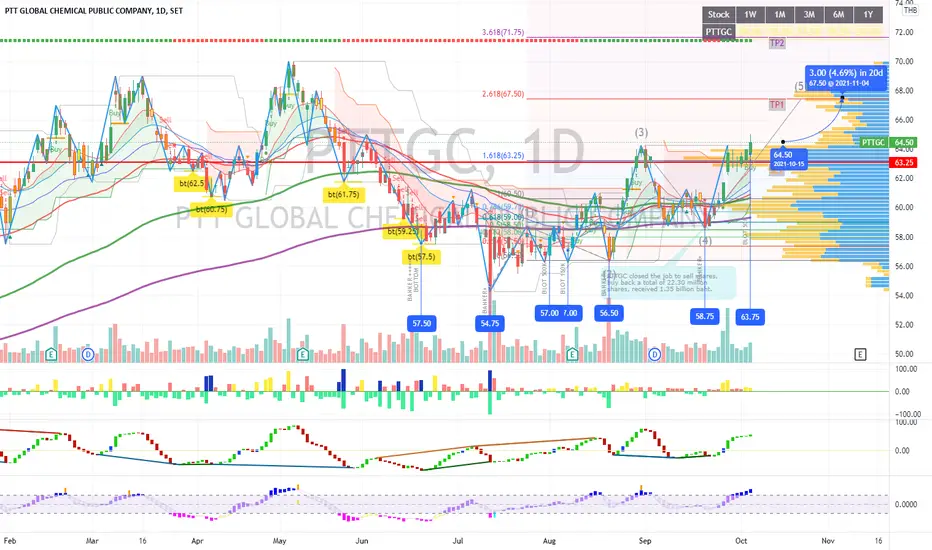
THAILAND SET: PTTGC - SPECULATIVE BUY TP1 - 67.50 STOPLOSS 63.00THAILAND SET: PETROCHEMICAL SECTOR | PTTGC
CURRENT PRICE: 64.50
BREAK OUT VOLUME POINT OF CONTROL: 63.00 and previous high
Reasonably good buy position for speculative TARGET PRICE 1 @ 67.50 (5.4%) at mini Wave 5 position.
Stop Loss: 63.00 (current POC)
>Strong Foreign fund flow (NVDR) - hit the highest daily chart at +450 mil baht / day
>Strong Banker fund flow
>RSI almost hit overbought, still have room to go further
RECENT NEWS UPDATE: PTTGC announces the end of the share repurchase program, totalling 22.30 million shares, receiving 1.35 billion baht. To increase financial liquidity
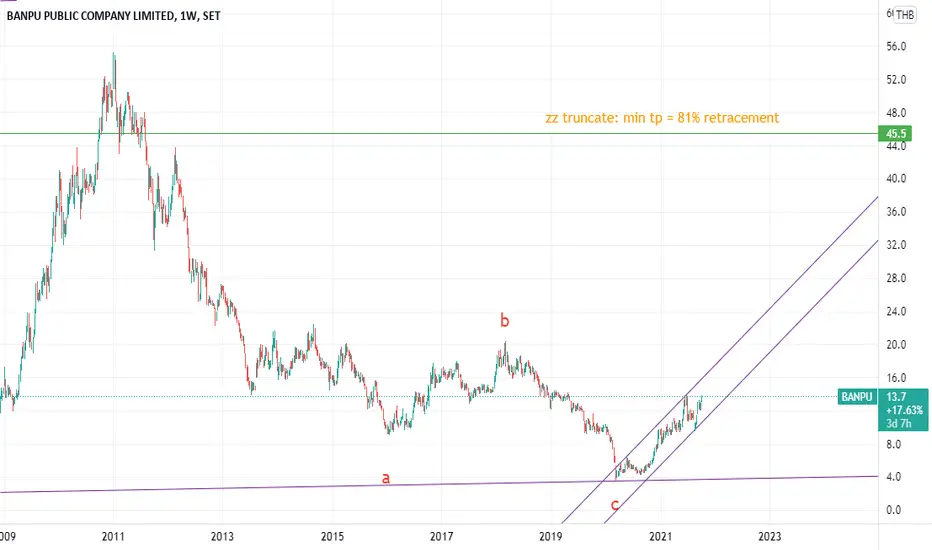
BANPU (TH) - Elliot Wave Analysis- On the weekly chart, you can see that there is a CYCLE zigzag truncate pattern. According to Glen Neely, this pattern has a minimum target of an 81% retracement @45.5.
- On the daily chart, there are two likely scenario that could occur:
1. Primary wave has already completed and we are approaching Primary wave .
2. Primary wave might not be completed: we might be in an Intermediate wave(B) of the primary wave .
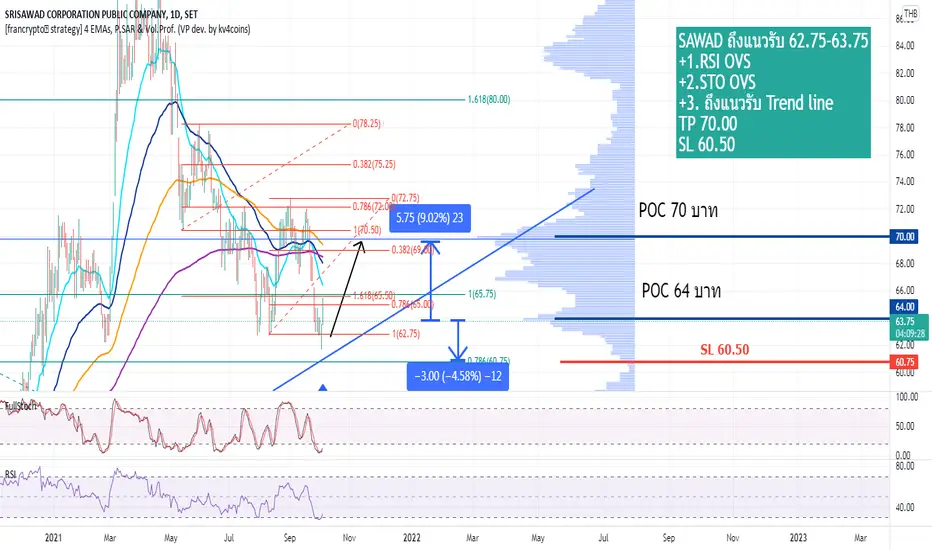
SAWAD reached the support line 62.75-63.75SAWAD reached the support line 62.75-63.75
+1.RSI OVS
+2.STO OVS
+3. Reached Trend line support
TP 70.00
SL 60.50
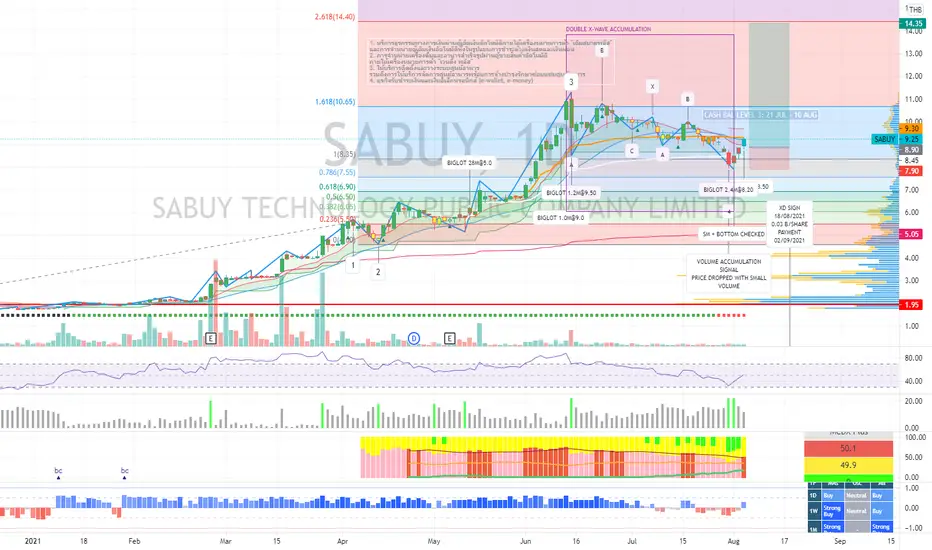
THAILAND SET: SABUY - SPECULATIVE BUY - TP 14.5 - 15.0NEW TP2 POSITION - WAVE 5.
Take profit Position - Target Price 1 - reached 12.0 after breaking out resistance 1.618 (10.65) and sustained above the level while overall THAILAND SET index declined lower than 1600 on Oct 1st.
> Current price broke lower EMA20 - take profit position.
> Overall BANKER FUND FLOW decreasing.
> RSI near oversold position.
> Possible 2nd TARGET BUY POSITION - 10.7 when fund flow turned positive, oversold, and double bottom in timeframe 1 HOUR.
> NEW TP2 AT WAVE 5 - 14.5 - 15.0

THAILAND SET: SABUY LONG POSITION - PRE-BUY SUPERTREND SIGNALPRE-BUY SUPERTREND SIGNAL at Elliott Wave 4 AT 8.95 - CUTLOSS 7.90
Overall SET down due to COVID outbreak of Delta variance and lockdown 3.0 in 28 provinces
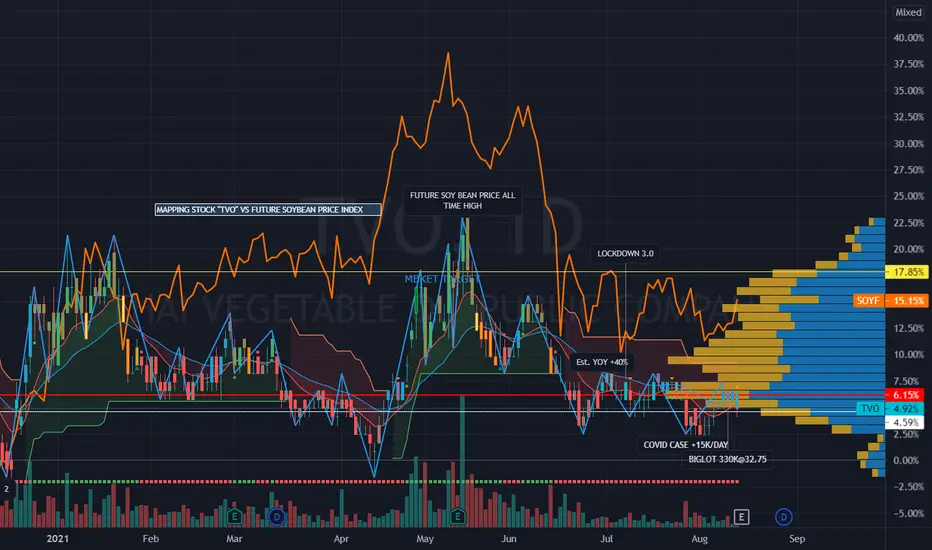
THAILAND SET: TVO THAI VEGETABLE OIL - SPECULATIVE BUYSpeculative BUY: TVO - Thai Vegetable Oil - Q2/21 Est. +113% QOQ, +92%YOY
> Weak Thai Baht - better export sales exchange rate
> Future Soy Bean rebounded as a positive factor for animal food supply profit contribution.
> Expect dividend 1.50 baht/share mid year (almost 5%, total year payout 8%)
Risk:
> SET declining due to COVID lockdown 3.0 w/ +25K cases /day
TTATTA sell
TTA sell
TTA sell
TTA sell
TTA sell
TTA sell
TTA sell
TTA sell
TTA sell
TTA sell
TTA sell
TTA sell

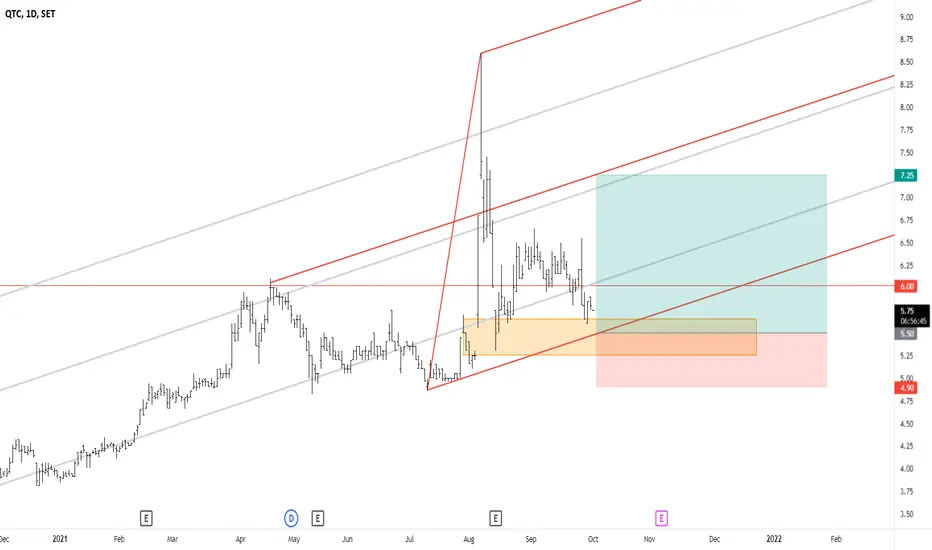
SET: QTC time to buy pullback?We can see the clear uptrend.
Higher high, higher low.
Red upslope medianline is pointing upward!
I'm going to long at the confluence between lower MLH and demand zone.
RR = 3:1

MENA (TH) - Elliot Wave Analysis- The first minute pattern was a zz truncate (July 7 - Aug 16). Hence, we have a TP for the second leg of 81% of the first zz truncate pattern (@2.56).
- Note: Minute wave of the first zz truncate seems to be a non-standard correction with the last ABC also being a zz truncate. However; price did not retract back to 61.8%/81% of this wave. Since history tends to repeat itself, we might need to keep in mind that this time our TP of 81% might not be reached.

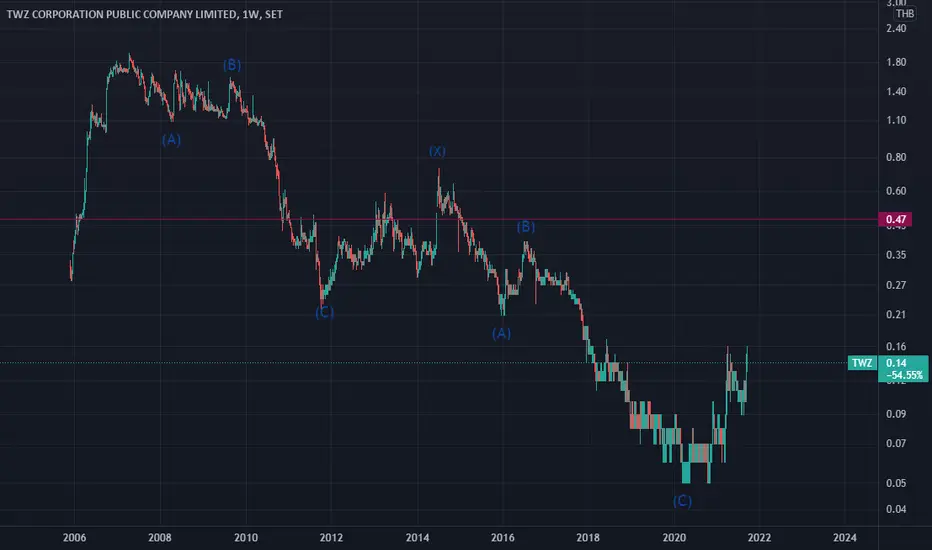
TWZ (TH) - Elliot Wave Analysis- Downtrend pattern: non-standard correction (ABCXABC), which according to Elliot Wave Theory should retrace back to at least 61.8% of the last ABC. (@0.47)
- Wait to enter after a nice retracement.