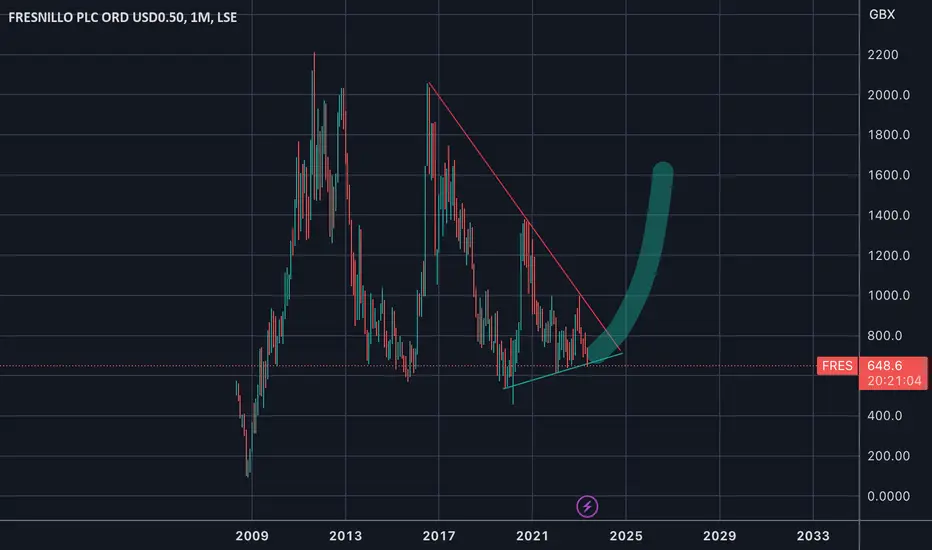
$OTC:FNLP Key Support Line and Falling Wedge Pattern
Introduction
This concise analysis examines the silver chart, highlighting the significance of a key support line and the presence of a falling wedge pattern. These technical indicators provide insights into potential price movements and suggest a possible bullish outlook for silver.
Key Line of Support
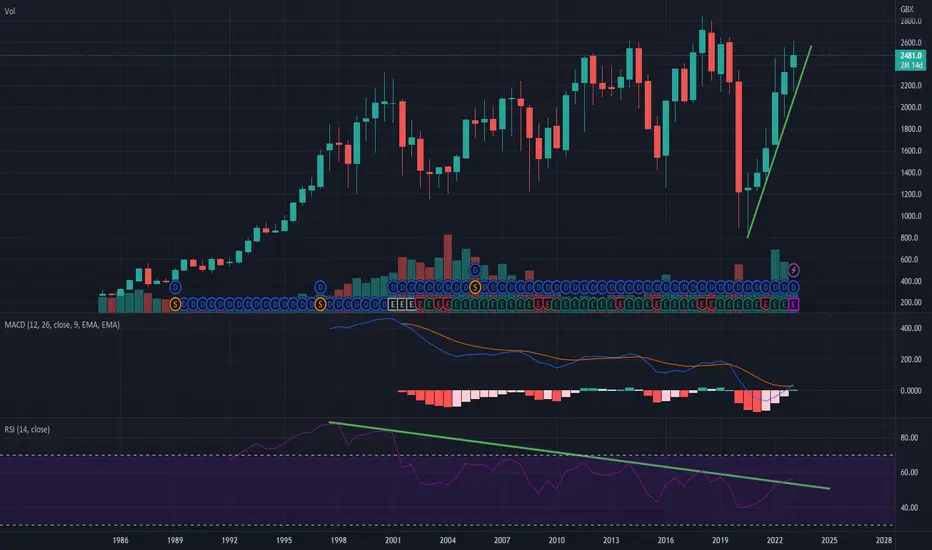
The silver chart reveals a well-defined line of support that has held multiple times, demonstrating its significance. This support line acts as a price level where buying pressure tends to emerge, preventing further downward movement. The repeated bounces off this support line indicate its strength and suggest that buyers are actively participating at this level. Traders often consider such support lines as critical areas to monitor for potential buying opportunities.
Falling Wedge Pattern
Within the silver chart, a falling wedge pattern has emerged, characterized by converging trendlines with a downward slope. This pattern typically represents a temporary consolidation phase before a potential bullish breakout. The upper trendline, connecting the descending highs, and the lower trendline, connecting the ascending lows, create a narrowing wedge shape. The falling wedge pattern often indicates a gradual decrease in selling pressure and a potential shift towards upward momentum.
Anticipated Breakout
The falling wedge pattern suggests a potential bullish breakout in the future. As the price approaches the apex of the wedge, the narrowing range indicates decreasing volatility and a possible resolution in favor of the bulls. Traders closely monitor this pattern as a breakout above the upper trendline can signify the end of the consolidation phase and the start of an upward move. The falling wedge, combined with the strong support line, adds to the potential upside momentum for silver prices.
Confirmation Indicators
To further validate the potential bullish scenario, traders may look for supporting confirmation indicators. These may include positive divergences in oscillators like the Relative Strength Index (RSI) or bullish candlestick patterns near the support line. Such indicators can strengthen the conviction in anticipating a bullish breakout and provide additional entry signals.
Conclusion
In conclusion, my analysis indicates a strong support line, a falling wedge pattern, and the support of favourable macroeconomic conditions, all pointing towards a bullish outlook. It's worth mentioning that my previous call on the same stock was well-timed , resulting in a ~ OTC:FNLPF 250% price increase. As I continue to closely monitor price action, I will consider these indicators and draw from my previous success when making informed decisions about investments in silver.
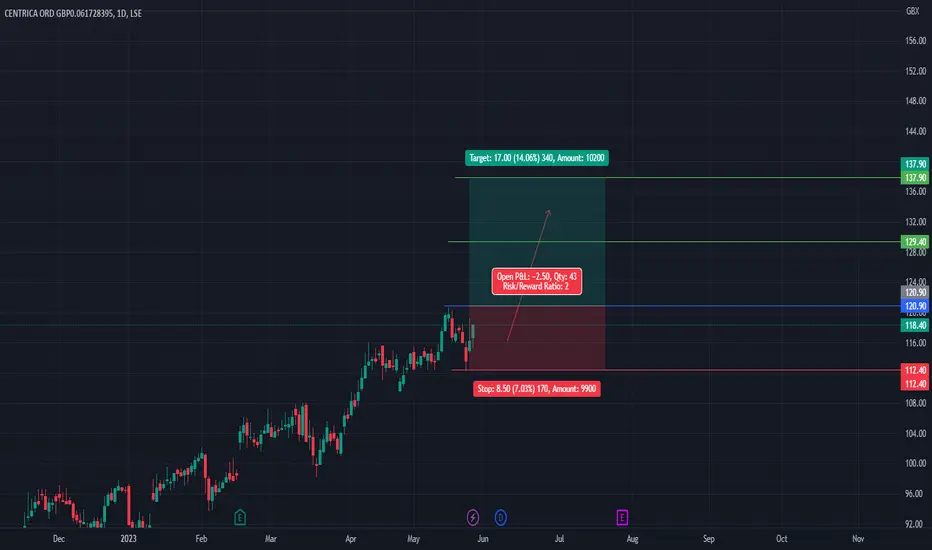
CENTRICA ORD GBPCNA printing higher high and higher lows we can buy on 120.90 level with Taking profit level of 129.40 and 137.90
BOO Short Sell (Circa 7-8%)BOO Short Sell based on equilateral triangle pattern within levels of resistance. Breakout will favour bearish. TP 37.45 based on previous resistance levels.

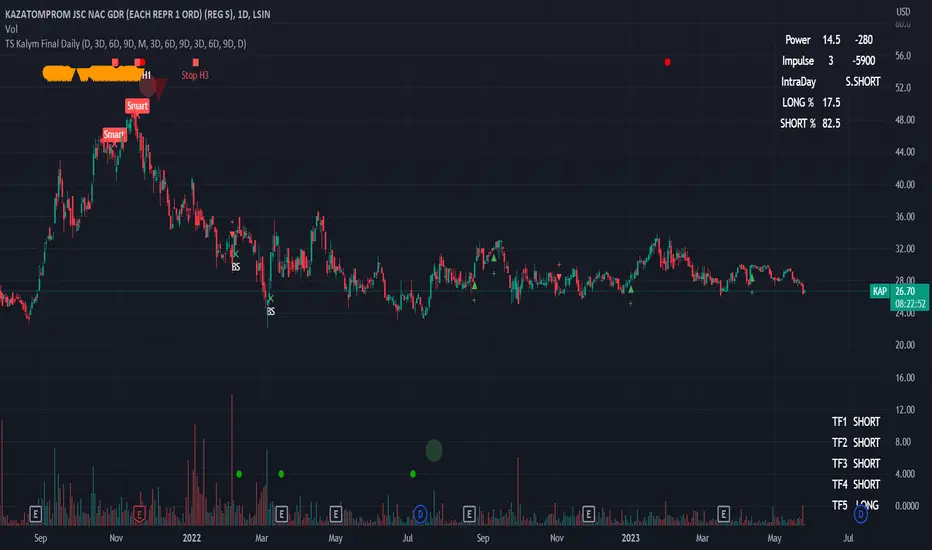
KAP - KazatompromBe carefully.
The Budennovskoye was transferred free of charge to the Russian oligarch Anisimov. Oligarch Anisimov sold the Budennovskoye to the Russian state corporation Rosatom. The deal was approved by the Kazakhstani government, without benefiting the country. Neither Kazakhstan nor Kazakhstani companies received any money from the sale of the Budenovskoye. A scandal is brewing in Kazakhstan. Investing in Kazatomprom seems like a bad idea.
I will simulate the Hedge grid system strategy == in a trendingI read somewhere that companies are not required to pay dividends to shareholders (this is correct, yes?).If so, then if company A never pays dividends to its shareholders, then what is the point of owning company A's stock? Surely the right to one vote for company A's Board can't be that valuable.What is it that I'm missing?
definitely if the stock has no intrinsic value, then what is causing its movement up and down ?
I will introduce in this post a strategy called the Hedge grid system
In this strategy if two traders decide to cooperate they can make a lot of money from any stock market even though most stocks do not have any intrinsic value
I will simulate the Hedge grid system strategy

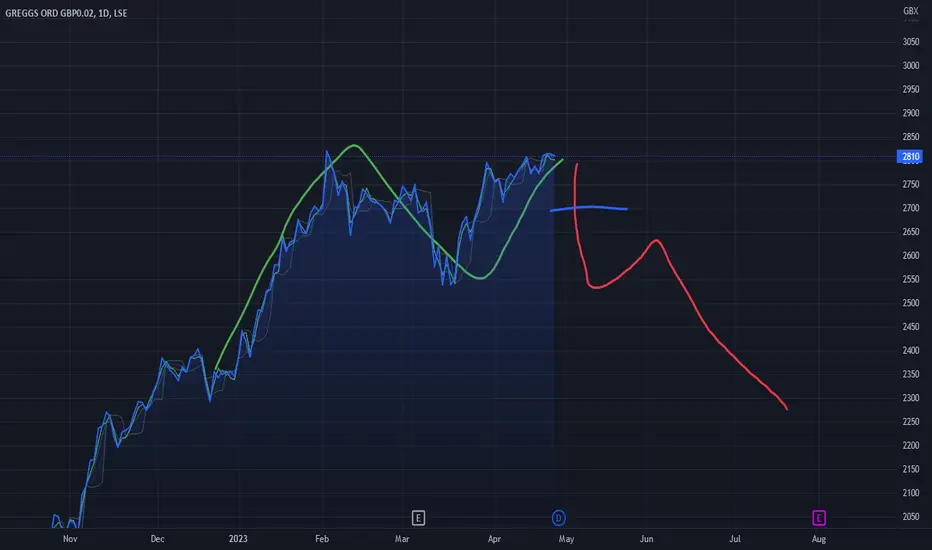
Greggs almost ready for reversalDONT ENTER YET
This is a preliminary idea, the red line indicates my prediction for the next price movement.
However, it may yet go up higher first.
I will be waiting for a sharp drop of about 100 points from the peak, to confirm a downtrend, signified by the blue line. Go short if we hit that
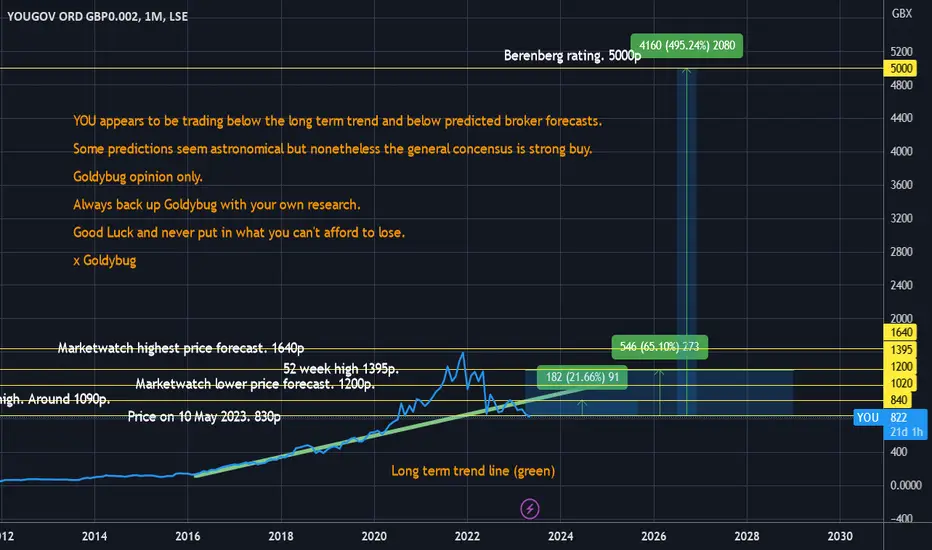
YOU Yougov - Underpriced relative to long term trend & brokersYougov (YOU) seems undervalued relative to the long term trend and multiple broker ratings. Goldybug could find no shorting activity currently posted ad given the impending UK elections next year an increase in activity for the company is predicted. Based on the deviation to the long term trend Goldybug has jumped into the mix for a long term investment opportunity.
Goldybug opinion only. Back up with your own research before spending your hard earned.
Never place what you cannot afford to lose.
Good Luck.
Goldybug. x
SSE moving on up, after a 6 month consolidationSSE has now resumed it's uptrend after breaking our in August last year. So, that took about 6 months of consolidation and a few tests of previous resistance at approx. 1500 which is now support.

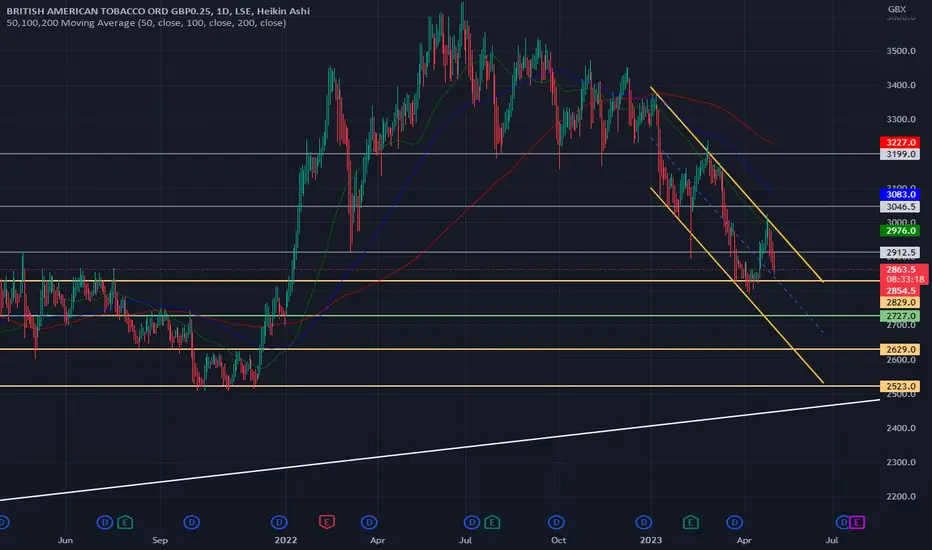
BATS/VUKE.... Down 25%!If I held and VUKE (Vanguard FTSE 100 ETF) I would sell it now to buy BATS. BATS is down 25% relative to VUKE and offering 8% dividend yield compared to ~4% for VUKE.

BATS, No Breakout!BATS is still stuck in this downtrend channel.
After taking some profits at 2900, I'm waiting for the next bottom!
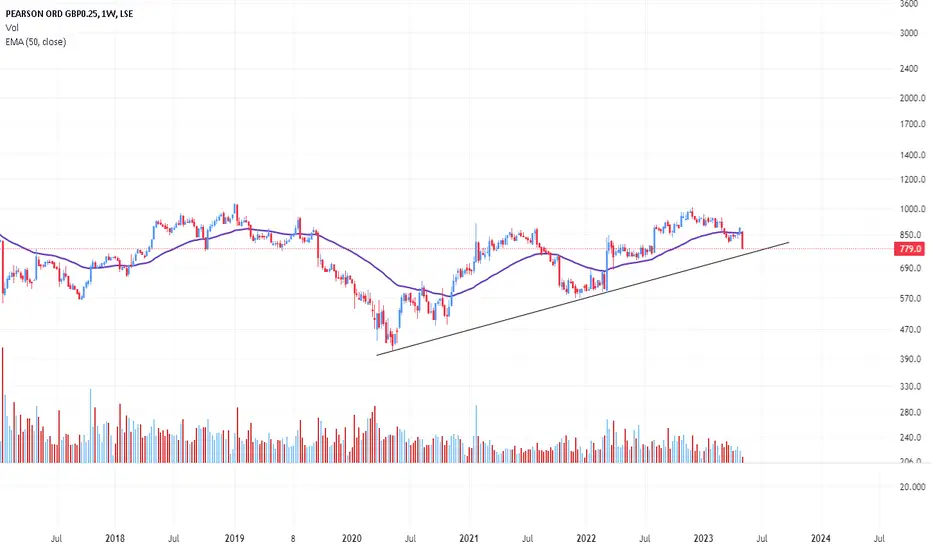
Pearson down 11% on AI worriesIf AI is eating your lunch, your company better have a good strategic plan to adjust and create new revenue streams.
This is classic Marketing myopia, e.g. US railways, in mid 20th century, saw market share eroded by the airlines. That's because railroads never saw themselves in the transportation business, and limited themselves themselves by thinking they were in Railroads alone.
Pearson has had to deal with all sorts of changes, especially technology, and I'm sure they will have a strategic plan.
Technicals: Bearish reversal now under 50 weekly EMA, but volume isn't high so early days. Below 756 would confirm a new downtrend.
The BP chart after the earning reportToday, the price of BP shares experienced a significant decline after the release of their Q1 earnings report, despite the fact that they made 4 billion during this time period. This phenomenon can be explained as a case of "buying the rumour and selling the fact." To better understand the market's reaction, we look at the BP chart to identify the key support levels.
Disclaimer:
The information posted on Trading View is for informative purposes and is not intended to constitute advice in any form, including but not limited to investment, accounting, tax, legal or regulatory advice. The information therefore has no regard to the specific investment objectives, financial situation or particular needs of any specific recipient. Opinions expressed are our current opinions as of the date appearing on Trading View only. All illustrations, forecasts or hypothetical data are for illustrative purposes only. The Society of Technical Analysts Ltd does not make representation that the information provided is appropriate for use in all jurisdictions or by all Investors or other potential Investors. Parties are therefore responsible for compliance with applicable local laws and regulations. The Society of Technical Analysts will not be held liable for any loss or damage resulting directly or indirectly from the use of any information on this site.

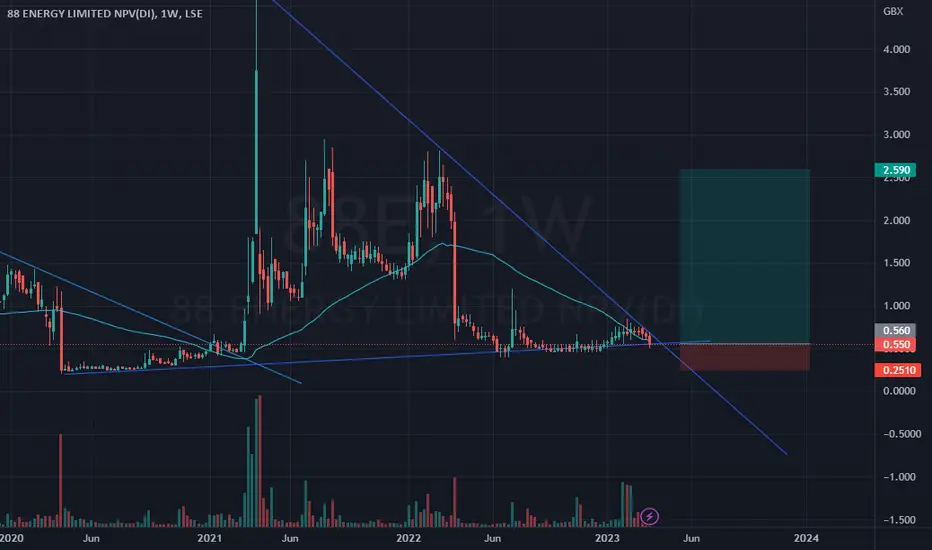
Long term downtrend Breakout trade 88e eeenfWe revisit 88E once again and can we reach our previous 10x on investment once again? If we break our multiyear downtrend line again we could be looking to big breakout. initial targets we would be looking at would be around
tp 1 = 1.1
tp 2 = 2.5
tp 3 = 5
News is due in coming weeks and depending on results we could surpass our TP3 targets if 88E hits a new oil discovery.
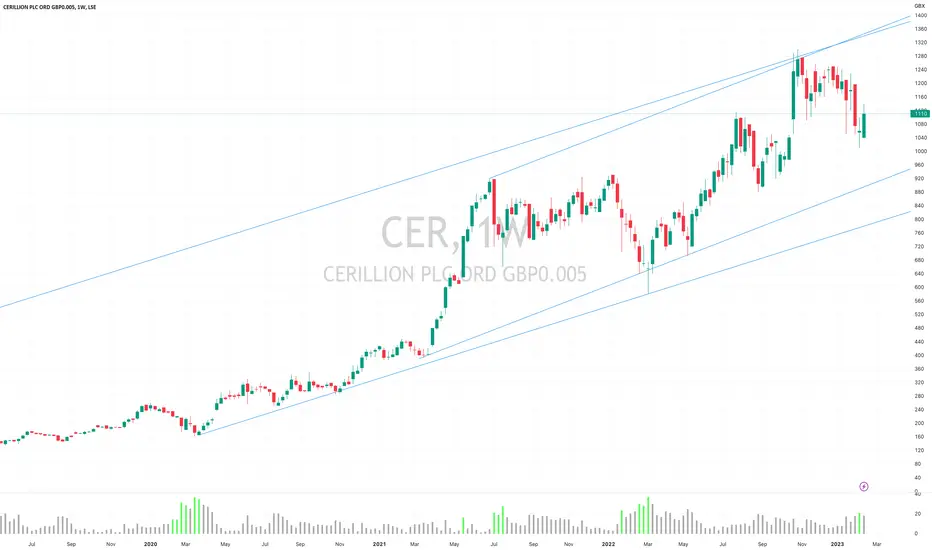
CER wait for backtest of upward channelCER wait for backtest of upward channel
no advice, chart is long and strong
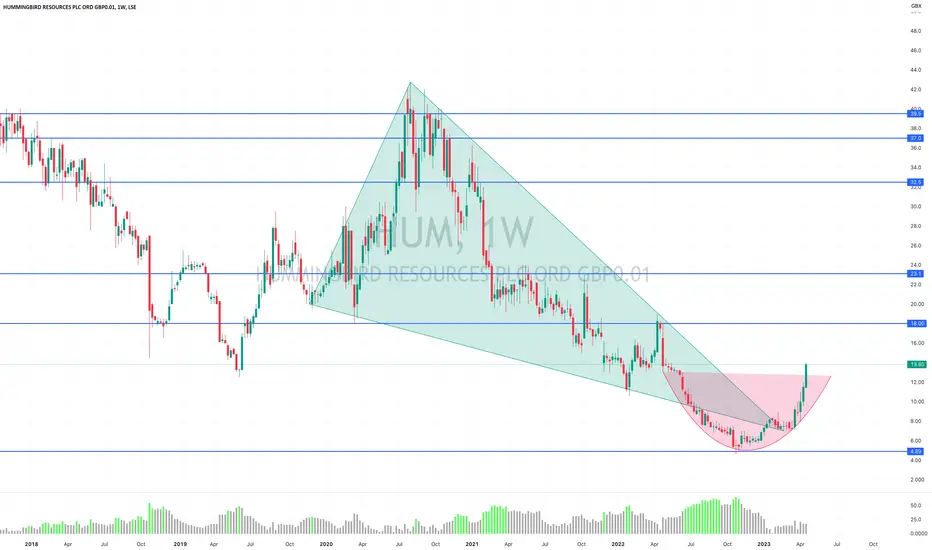
HUM - very strongHUM.L break out of descending triangle into a very positive pattern
No advice given
Potential resistance levels shown
Interesting to see the next few months
long position on CCHMy strtegy is based on price action with the reading of certain indicators that I like whilerespecting all the values that define the stock make

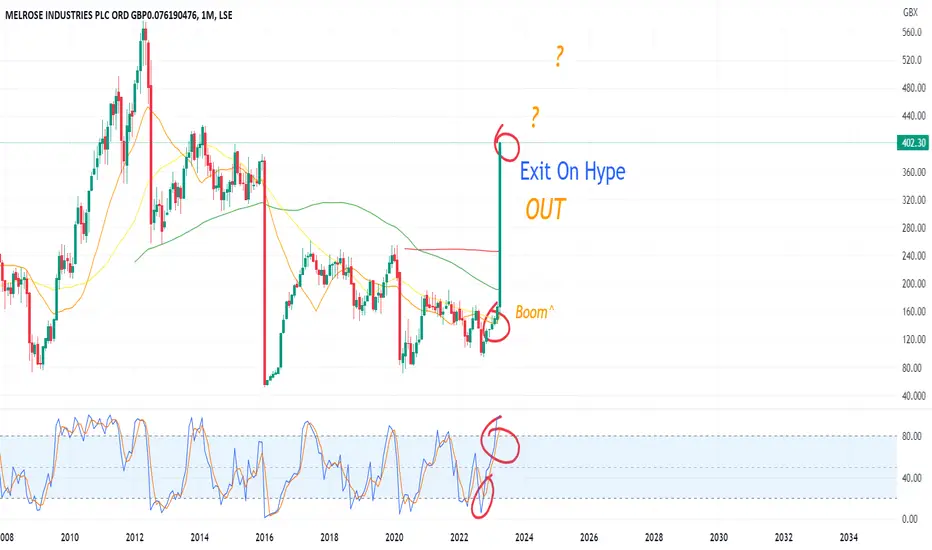
What To Do When Your Stock Pick Flies..Hey Traders,
For those who like Trading Stocks... People slam in to buy and you have the opportunity to take profit on huge moves.
You can either do this... Or gamble and let it fall.
Take gains repeatedly. It's a better process than guessing.
Long target 1300 in the coming months.National Grid Been in a solid uptrend for Many years .
Strong Support on the Green line (great entry point) and resistance on the red line (sell)
Just about to turn Green on the Monthly MACD .
Long target 1300 in the coming months.

JET2 PLC ORD GBP 4H LSE AVIATION SECTORJET2 PERFORMING WELL OVERALL SINCE THE COVID CRASH, STRUGGLED TO BREAK PAST THE 3 YEAR RESISTANCE OF APPROX 1403 ON A NUMBER OF OCCASSIONS, RISING WEDGES TEND TO BREAK TO THE DOWNSIDE 68% OF THE TIME,
FUNDAMENTALS ARE BRILLIANT ON THIS ONE. NEW TRAINING CENTRE AND AIRCRAFTS PURCHASES.
Jet2 Plc Market Data
TIDM JET2
Ticker Code JET2.L
ISIN GB00B1722W11
Currency GBX
Issue Country GB
Sector Ticker NMX2770
Year End 31-Mar-2022
Shares in Issue 215m
Market Cap. £2,802m
Market Size 2,000
PE Ratio -8.878
Earnings -147.00
Dividend 3.00
Yield 0.230%
# of Trades 700
Vol Sold 219,018
Vol Bought 96,967
52 Week High 1,394.50
52 Week High Date 08-Mar-2023
52 Week Low 637.40
52 Week Low Date 13-Oct-2022
JET2 Fundamentals
Standard IFRS IFRS IFRS IFRS IFRS
Millions Millions Millions Millions Millions
Income Statement 30 Mar '22 31 Mar '21 30 Mar '21 31 Mar '20 30 Mar '20
Revenue 1,231.70 395.40 395.40 3,584.70 3,584.70
Operating Profit / Loss (323.90) (336.10) (336.10) 184.60 184.60
Net Interest (66.00) (34.60) (34.60) (37.60) (37.60)
Pre Tax Profit (388.80) (369.90) (369.90) 147.70 147.70
Post Tax Profit (315.40) (299.50) (299.50) 111.60 111.60
Profit for the Period (315.40) (271.20) (271.20) 116.00 116.00
Equity Holders of Parent Company (315.40) (271.20) (271.20) 116.00 116.00
Minority Interests n/a n/a n/a n/a n/a
Continuing EPS
Earnings per Share (Basic) (147.00p) (151.20p) (166.90p) 77.90p 77.90p
Earnings per Share (Diluted) (147.00p) (166.90p) (166.90p) 74.80p 74.80p
Earnings per Share (Adjusted) (147.00p) (166.90p) (166.90p) 75.00p 75.00p
Continuing and Discontinued EPS
Earnings per Share (Basic) (147.00p) (151.20p) (166.90p) 77.90p 77.90p
Earnings per Share (Diluted) (147.00p) (151.20p) (166.90p) 77.80p 77.80p
Earnings per Share (Adjusted) (147.00p) (151.20p) (166.90p) 77.90p 77.90p
Dividend per Share n/a n/a n/a 3.00p 3.00p
Millions Millions Millions Millions Millions
Balance Sheet 30 Mar '22 31 Mar '21 30 Mar '21 31 Mar '20 30 Mar '20

LONG 6 Month Chart: Bullish over the next 6 to 12 months. 6 Month Chart looking strong
MACD Crossing and RSI has broken the downward trend.
Next 6 to 12 months Looking good for Shell.