What to Expect for EZJ Ahead of Q4 Earnings?On the hourly chart, EasyJet (EZJ) made a bullish breakout after forming a cup with handle pattern. Buyers may continue to push the EZJ share price forward to 415.3 - 422.6 levels, with 428 - 429.9 levels (August highs) as additional bullish targets.
Breaking down and closing below 399 pence may invalidate the prior hypothesis, causing the EZJ share price to fall further to 392.1 pence, with 381.9 and 371.6 as potential targets for sellers.
EasyJet is expected to earn 0.31 pence per share in the fourth quarter, up from -0.60p in the same period last year. Also, EasyJet's Q4 revenue is predicted to be £2.5 billion, up from £1.22 billion during the previous quarter.

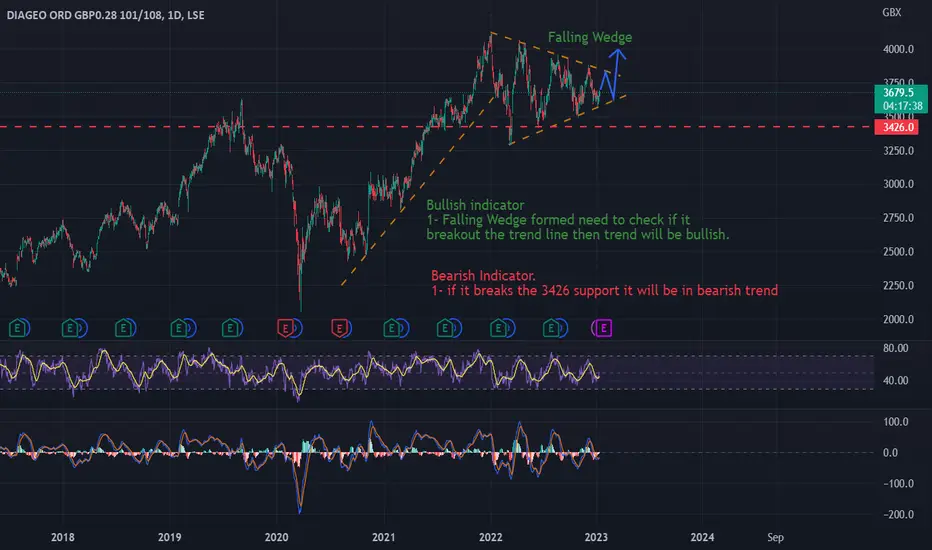
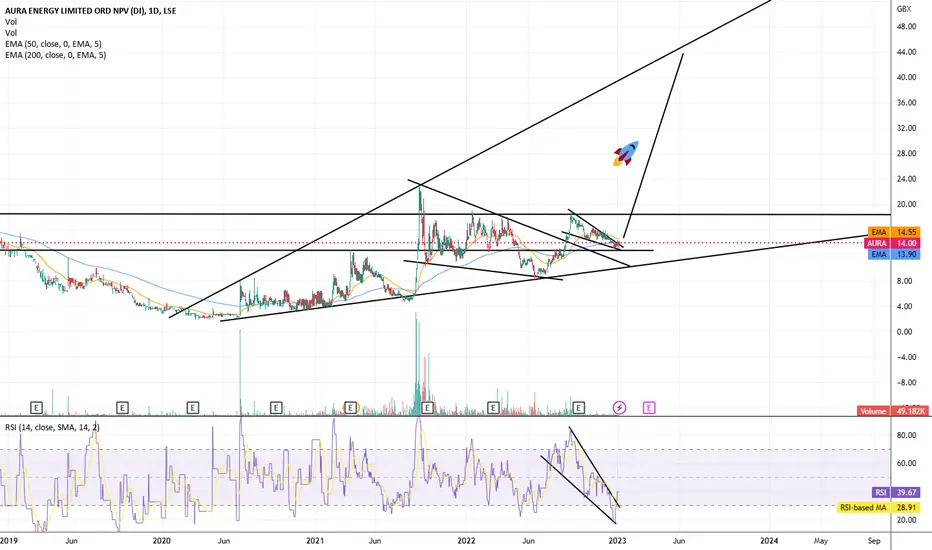
DGE Bullish indicator
1- Falling Wedge formed need to check if it
breakout the trend line then trend will be bullish.
Bearish Indicator.
1- if it breaks the 3426 support it will be in bearish trend
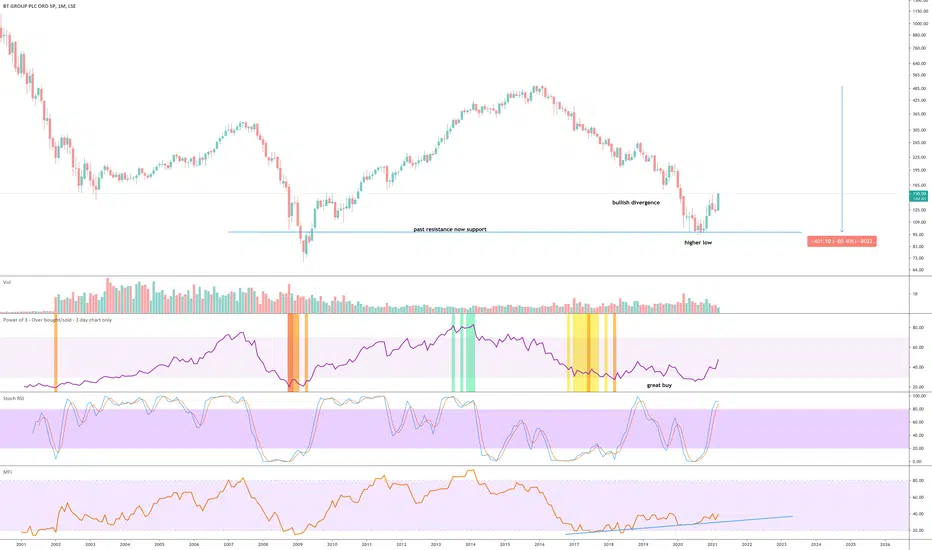
BT Group Plc *safe investment opportunity - low risk*
On the above monthly chart price action prints a higher low following a 80% correction since early 2016. Shortly after a 2:1 stock split. A ‘great buy’ opportunity now exists.
Why Bullish?
1) Regular bullish divergence between price action and the money flow index (MFI) - oscillator on bottom of chart.
2) Trend reversal. A higher low was printed from the crash in price action back in 2009.
3) The 3-month chart below provides a clearer picture of the overall trend between price action support and resistance. Clearly an amazing opportunity.
A buy from 130p is amazing if you can get it. Expecting price action resistance between 160-180.
Target? Around 800. This will take time 5 - 6 years but it beats cash resting in the bank account with no interest like the past 10 years!
3-month chart:
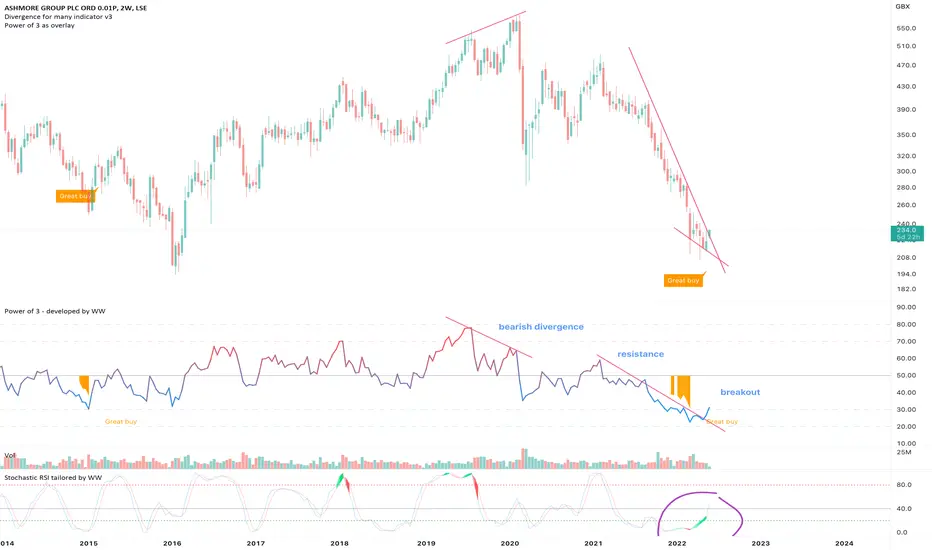
Ashmore Group PlcOn the above 2-week chart price action has corrected 60% since the bearish divergence back in February 2020. Now is an excellent time to be long, why?
1) A buy signal has printed.
2) Regular bullish divergence. 11 oscillators are currently printing bullish divergence with price action.
3) RSI and price action resistance breakout.
4) The 2-day stochastic RSI is crossing up 20 (purple circle) - do not ignore such beautiful signals.
5) Although the monthly candle is yet to close bar a few days, the monthly chart below is worth some attention. Price action is on significant support. Look left. It stands to good reason should price action close at 230-240 in the days towards the end of the month the candle will close green.
6) The last time monthly support was confirmed on this support / resistance level price action appreciated 90% and 150%, respectively. I think it is reasonable to assume a test of the upper channel resistance shall be repeated should this support be confirmed at the end of the month.
Is it possible price action falls further? For sure.
is it probable? No.
Ww
Type: Investment
Risk: <=6% of portfolio
Duration: N/A
Return: 2x
Monthly chart
YCA says the weekly trend is up $YCA since 2020
We now have Higher lows, lower highs, the squeeze is ON.

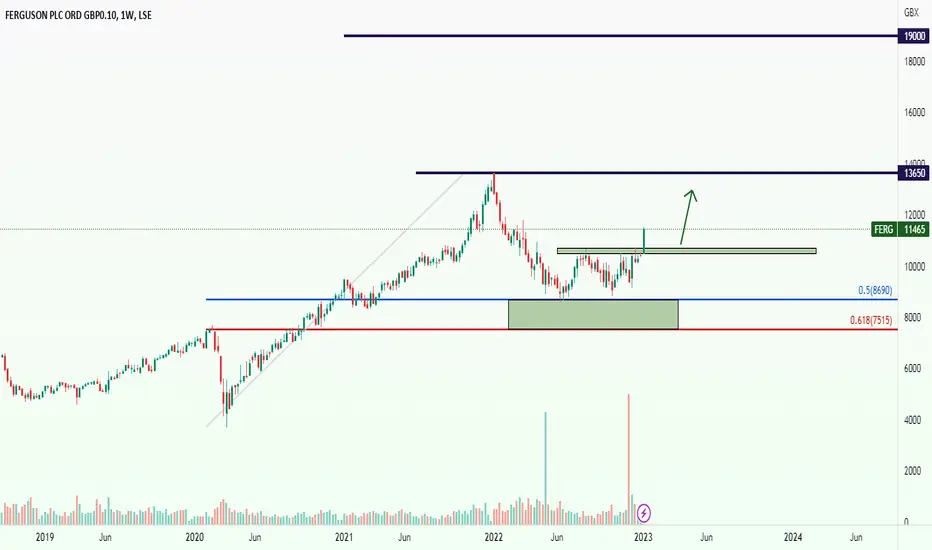
FERGUSON ,,, RISING It is a good example of a trend and a correction, ending exactly above 50-61.8 fib zone. It is inside an uptrend and the last weekly candle shows next target will be available so soon. Dont forget setting sl for it.
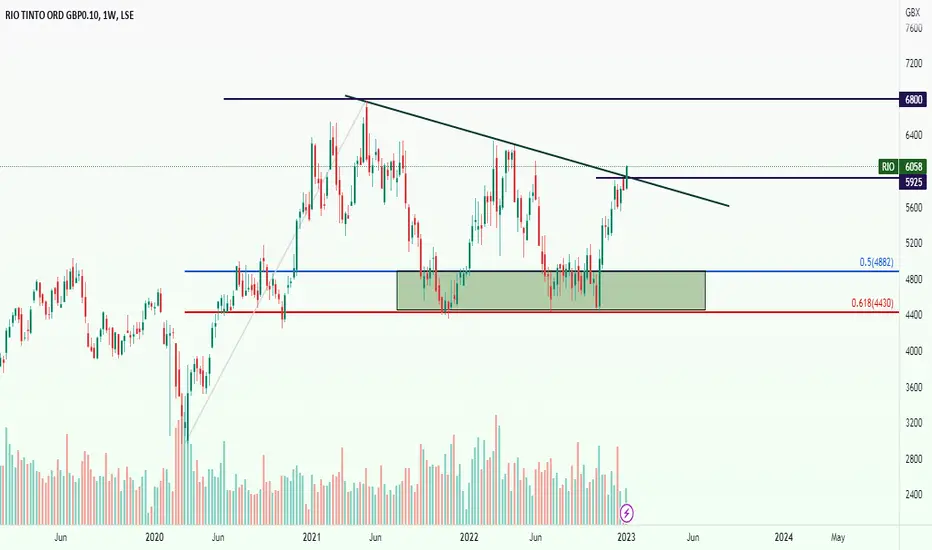
Rio Tinto ,,, Buy opportunity Uptrend
It's a good breakout and starting for a new trend, I suppose nest target will be at about 6800 and as always put SL at a sure place for new buying position.
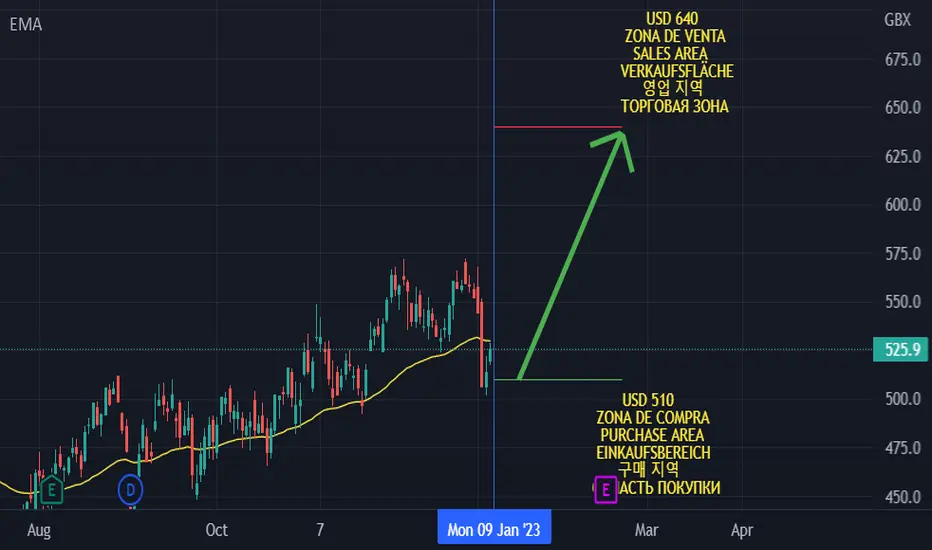
GLENCORE PLC ORD GLEN/USD HIGH PRECISION TRADINGLONG GLEN/USD 1 day Shopping ✅
Entry Point: USD 510.0
Target : USD 640.0
Stall Brake : USD 498.0
Speculation is extremely risky and must be executed with money that we are willing to lose or touch the stop loss.
Leave a comment that is helpful or encouraging. Together we can dominate the markets.
Trading is the only trade in which the only one responsible for our actions is oneself, our worst enemy is oneself, here there is no one to blame, this is not a collective work, the only one who presses the sell button buy and knows how much to invest and where to stop losses is you, and only you, so always remember that.
Important note: THE LEVEL OF LEVERAGE, the alert for taking early profits, the adjustment of the stop loss and the closing of forced operations are not made by this means.
And also always remember to have control over your losses, focus on this and you will lose.
Comment: WARNING!!!!
I AM NOT A FUTURIST, I DO NOT MAKE PREDICTIONS.
I AM A 100% MARKET OPERATOR, I WORK BASED ON MY EXPERIENCE, CONSISTENCY AND MY TRADING PLANNING.
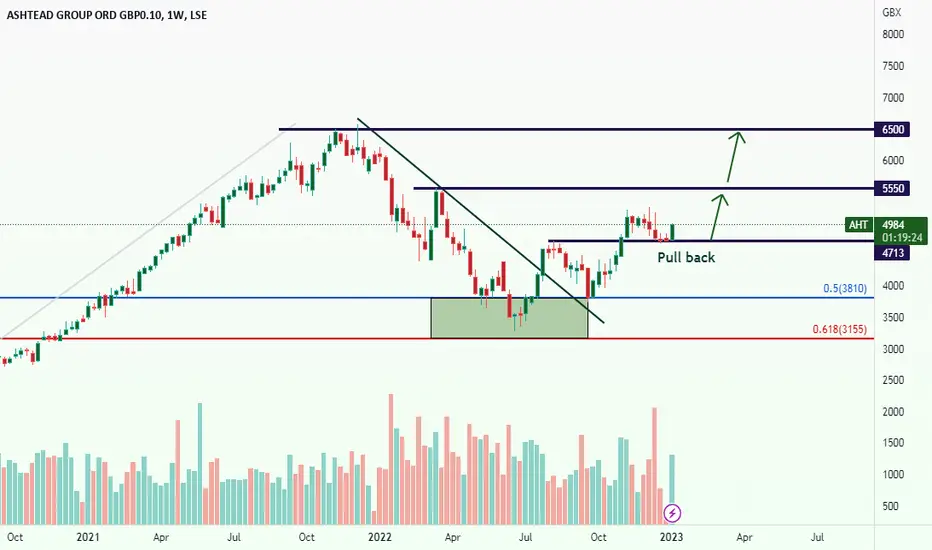
ASHTEAD ,,, Pullback Uptrend
It is a typical pullback to a broken level and followed by a good bullish candle on weakly time. It's triggered for buying by setting SL at about 4600 and next targets are 5550 and 6500.
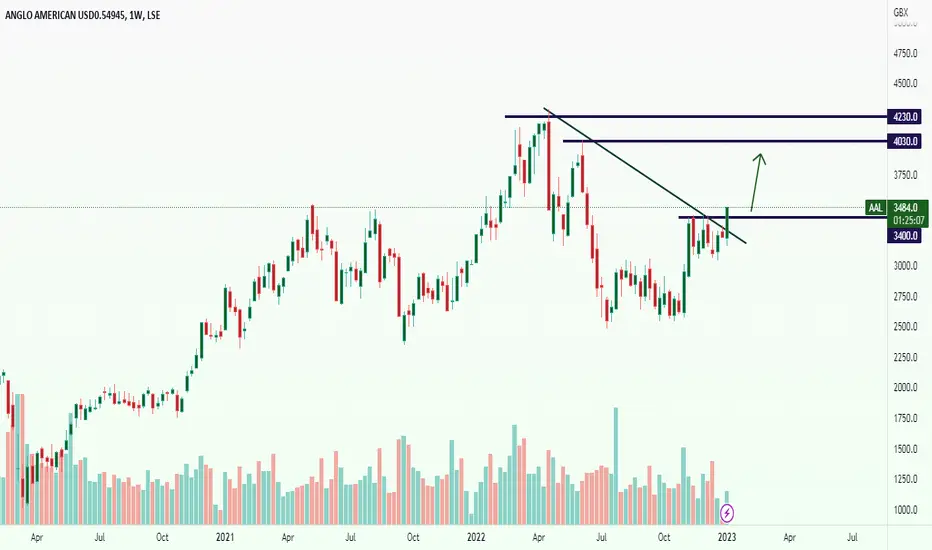
Anglo American ,,, Buy opportunity Uptrend
I suppose, this is a good breakout on daily time and by setting SL at about 3030, targets around 4030 and 4230 will be available. Whole market is not in a good mood , so try to enter with a small amount of your portfolio.
Time to sell out of GAW?Hi guys/gals,
I'll be walking you through my GAW analysis, I have worked from the monthly chart down to what you see here.
Tools I use:
Time based fib extension Fib retracement Colour coded rectangles Faces to show what I believe to be fear, neutral & greed sentiments Question marks Exclamation marks EMA/MA's
With Games Workshop having fallen under the 200 ssma I see it falling much lower. The price has fallen 50% from the high set in June of '2021 and has managed to rise 50% from the '2022 September lows.
As price is still holding under the 200 ssma the long term momentum is in a down trend indicating to me we could be seeing a possible reversal in price making newer lows than the one set in September.
Is this a good selling opportunity for those bag holders only time will tell.
My target for GAW is £20.00
GAW has been in a bull market since May of '2017 and is now what I believe to be in a short/mid term retracement to the upside before continuing to the downside targeting the red zone. If hit I see a possible bounce before hitting around £20.00, if momentum keeps up on the decline it could hit the orange zone before bottoming out.
Keeping in mind this is just my personal opinion and it may not play out like that at all.
Be smart, Invest small amounts, Capital preservation is key.
This is NOT financial advice DYOR!
Crypto Leonard.

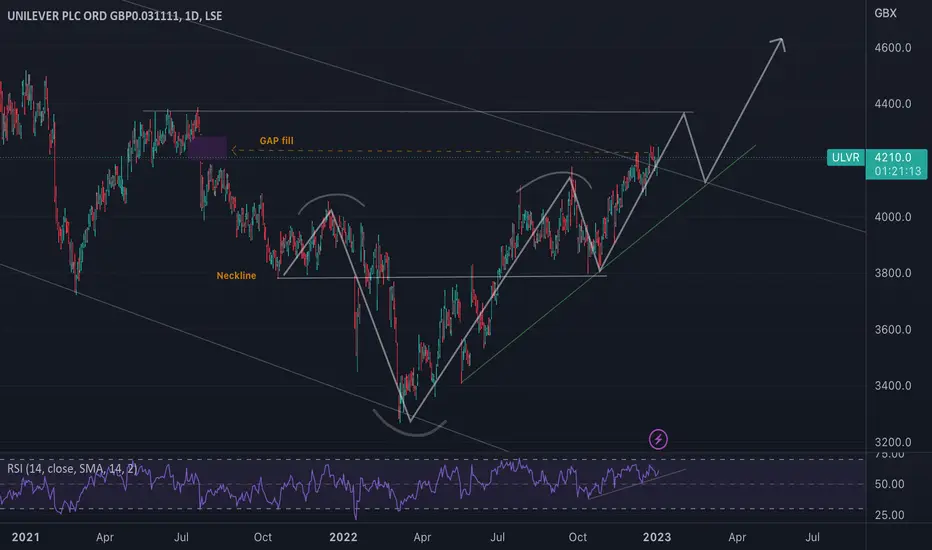
Unilever long above 40Unilever im long as long as its stays over 40.
its just filled the gap between 42-43. I expect either a push to the next level of resistance while the rsi is still bullish at around 43.60 or it sells off now and bounces at support.
classic inverse head and shoulders played out.
im long Unilever with they're pricing power over inflation and with they're restructure.
IT COULD DROP DURING A BLACK SWAN WHOLE MARKET DROP
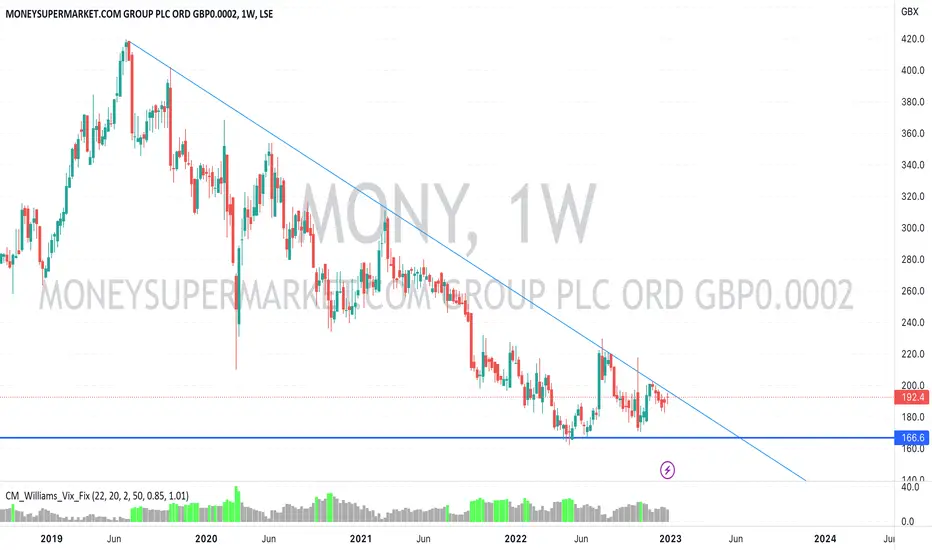
MONY upper resistance dominantMONY upper resistance dominant, monitor and see what happens
No advice given
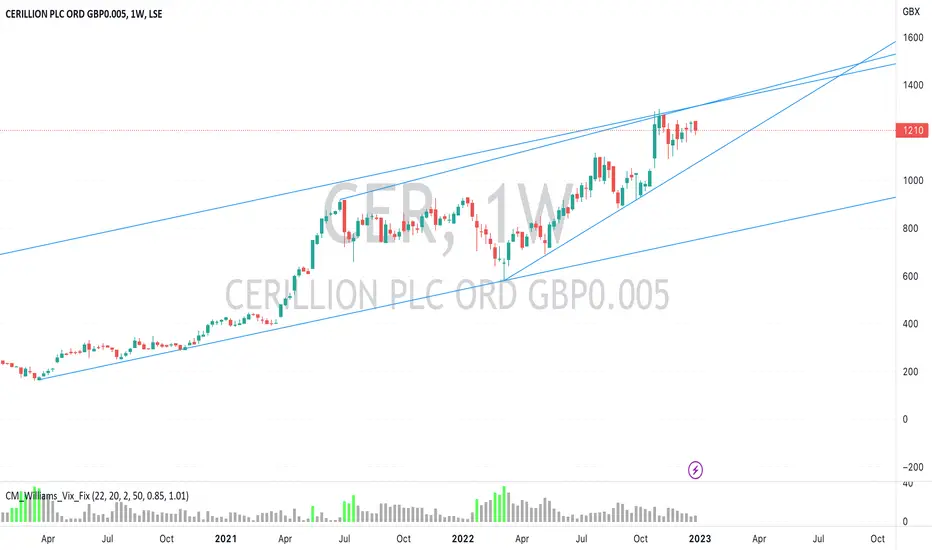
CER at top edge of upward channel - I think I missed this oneCER - can it continue or consolidate?
Upward channel but possible resistance
Long term trend very strong
No advice given
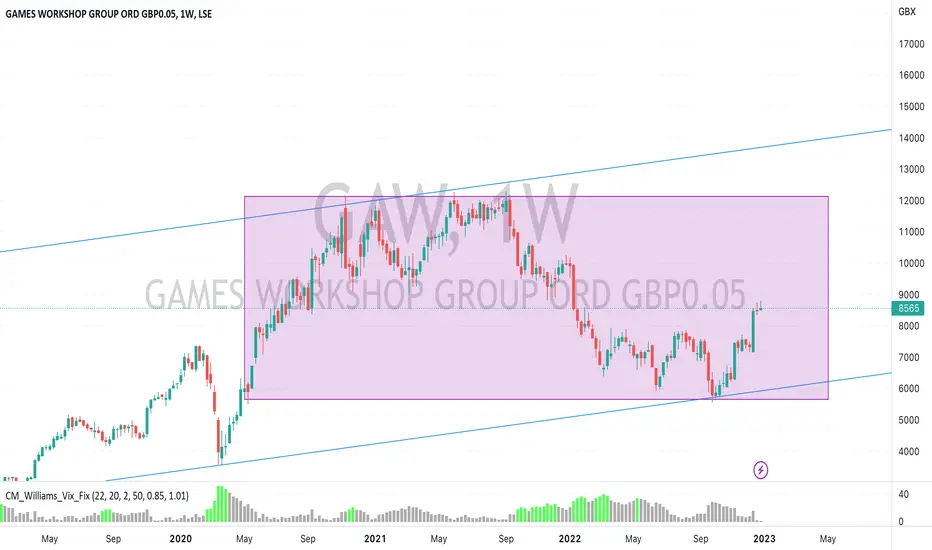
GAW consolidated In overall upward channelGAW consolidated In overall upward and long channel
No advice given but looks bullish
All comments welcome on chart or backstory
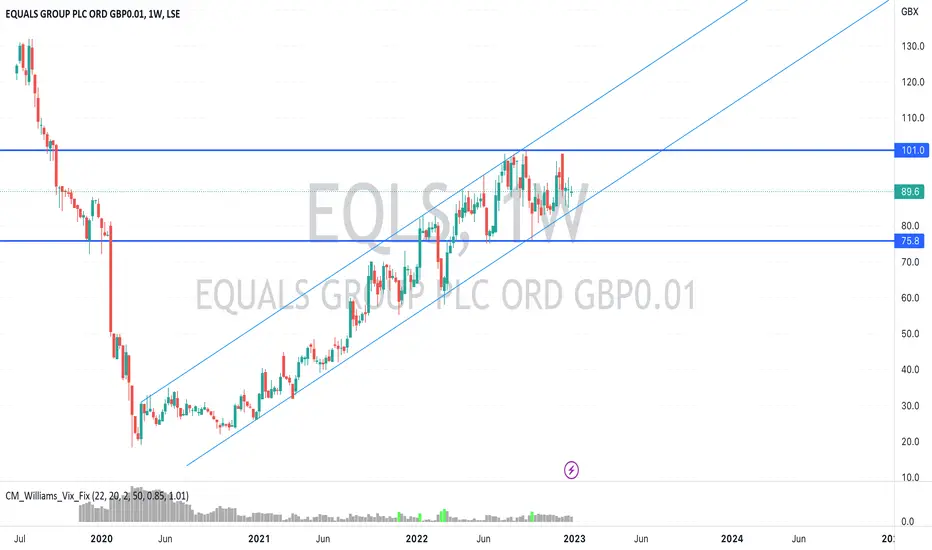
EQLS - had a good runEQLS - good run - will it continue or hit resistance?
strong upward channel
no advice given
all comments welcome
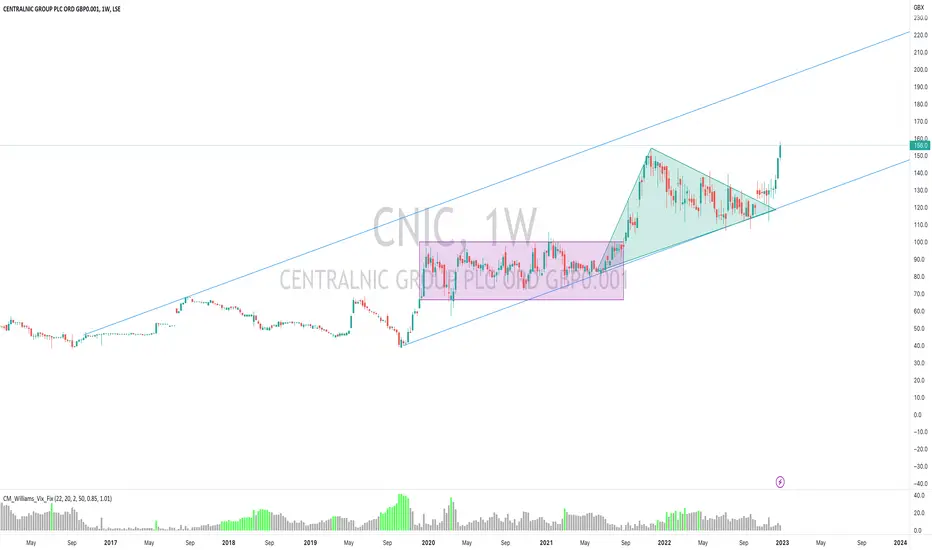
CNIC looks bullishCNIC - anyone comment please on prospect of this staying bullish?
All comments on chart welcome
Looks strong but no advice given
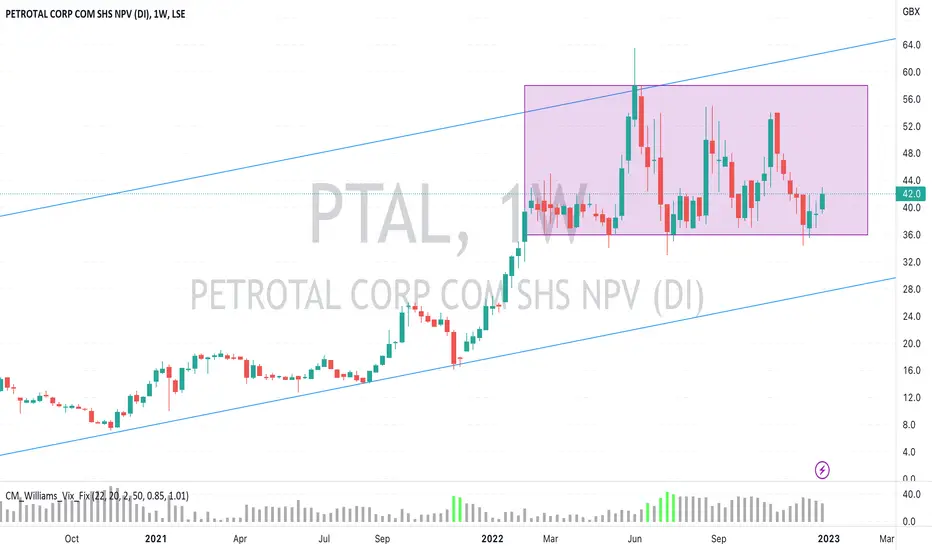
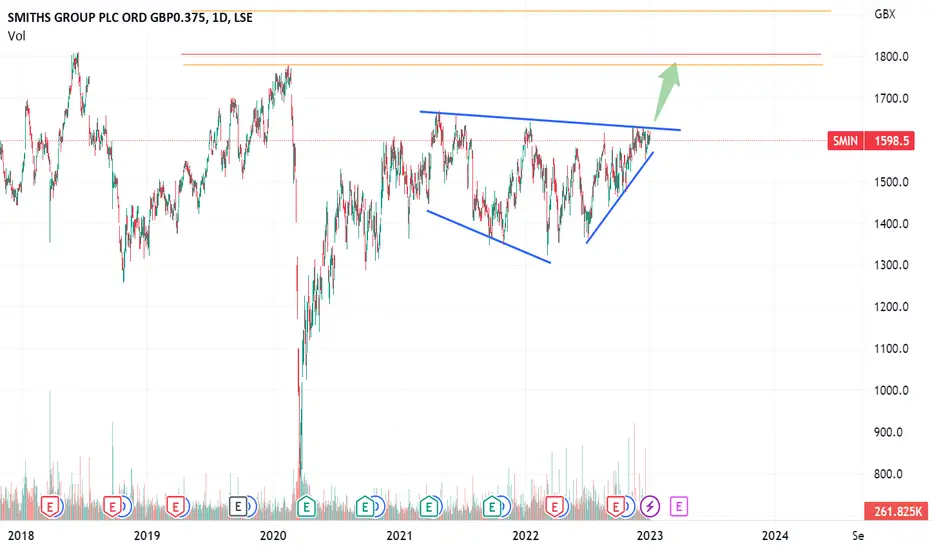
A bullish pattern unfoldingA consolidation pattern appeared in our model and this is amazing because this is a 2 years consolidation pattern which is quite rare to see.
Consolidation phases in the stock market refer to periods of time when the price of a particular stock or the overall market is relatively stable and not showing significant trends in either direction. These phases can be seen as a "pause" in the market's overall trend, and they can last for varying amounts of time. Consolidation phases can occur in both bullish and bearish markets.
In a bullish market, consolidation phases may be viewed as an opportunity for traders to take a break from buying and selling, or to reassess their positions and make any necessary adjustments. Some traders may see consolidation phases as an opportunity to buy into the market at a lower price, while others may choose to hold onto their existing positions until the market starts to trend upward again.
It is important to note that consolidation phases do not necessarily indicate a change in the market's overall trend. In a bullish market, for example, the market may continue to trend upward even if there are periods of consolidation along the way. As such, it is important for traders to use other forms of analysis, such as fundamental analysis, to determine the market's overall direction and make informed trading decisions.
Finally, this consolidatio phase is clearly limited by an upper trendline which could help us to trade this pattern.
If you buy in the consolidation pattern you can be trapped for months in a choppy market, but if you buy once the upper side has been broke, you can enjoy a fast rally with more probabilities. The zone between 1750 and 1800 looks great to take profits.
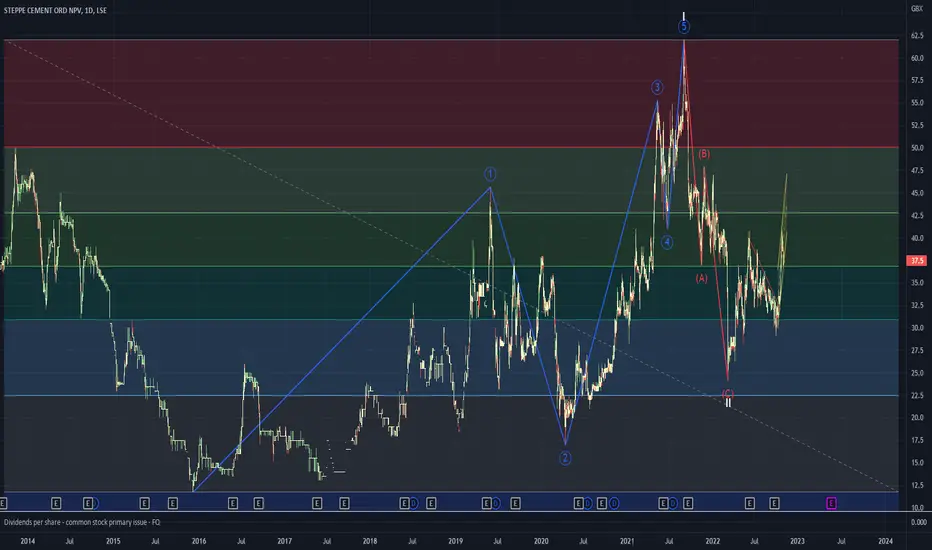
Elliot Wave Analysis of Steppe Cement (STCM)We've seen a 1,2,3,4,5 step advance (Wave I) and then an a,b,c counter trend decline (Wave II).
Wave III now looks to be underway and has a target of circa 100p, based on EW theory and the metrics of Waves I & II thus far
Cognitive Dissonance This happens to be some crap this side of the pond
But it doesn’t matter
Imagine it’s any of those things you wouldn’t consider buying RN…
Zoom, Peloton, Ark, Altcoins
And ask yourself if smart money has been buying or selling over the last few months
YW
GRI 2023

Q&As: order bookThere are people who trade based in order book exclusively & promote these so called orderflow trading platforms, even these days. Surely, it's a great deed to learn this interesting, exotic & unusual skill, but the thing is it's completely unnecessary.
The real use cases for DOM aka LOB aka order book aka Level 2 data are mitigating adverse selection, reducing market impact & spotting potential counter agents.
If you think deeper, all these issues are really all about position sizing and nothing else, you can operate as big as it's possible (depending how much diminishing returns you can let go), and the only thing that can help you figure it all out is order book.
The one & only principle of orderbook analysis is to understand where's us (operators), and where's them (ones who just need to be filled), be nice with yours & be a nice counter agent for them.
It's very simple, clients place big orders that immediately stand out. Everything else is us, we're spreading our orders equally all around the book.
For some reason not many think about it, but as a maker it's good to not only provide liquidity aka make the market, but also to consume these huge limit orders if it lets you to offload some risk or to open a position if the prices are good. By doing so you always make the market better, the faster and in more clear fashion the market activity is unwinding - better for all of us.
If you look at order book histogram and imagine it turned horizontally, you'll see peaks & valleys. So being inside a loading range (past a level) or nearby risk offloading areas (predetermined exit areas), you spread your limit orders the way they kinda fill these valleys, and you can also use market orders to kinda smooth the sharp peaks in order book. That's how you reduce your market impact.Your impact will start being too high when by filling the valleys you'll be creating new peaks, and by smoothing peaks you'll be creating new valleys. Easy enough? All the wise-ass reinforced learning & stochastic control models will output the same behavior, just a bit worse because they'll never defeat your "feel". They way you can process a feedback loop, as an organic, is DOPE.
By monitoring your position in the queue you can decide to replace some limit orders that sit deep to somewhere where probabilities won't be your enemies. If you're not in the first 5% of the queue at these places, your're prone to adverse selection. Closer you are to the front of the level, the worse position in the queue is ok. Negligible but stable adverse selection has a huge negative long term impact, should be taken very srsly.
In theory, it makes sense to care about order book as soon as you start trading more than 1 lot or if 1 lot is already a serious size on a given instrument. In practice, when you notice a statistically significant drop in revenue per lot on a given instrument, minding all other factors are equal, it's time to open dem books.
