EZJ awaiting a correction.EasyJet - 30d expiry - We look to Buy at 353.1 (stop at 329.8)
A lower correction is expected.
Short term RSI is moving lower.
A higher correction is expected.
Bespoke support is located at 350.
We look to buy dips.
338 has been pivotal.
The 50 day moving average should provide support at 352.
Our profit targets will be 409.8 and 419.8
Resistance: 430 / 448 / 480
Support: 400 / 370 / 350
Disclaimer – Saxo Bank Group.
Please be reminded – you alone are responsible for your trading – both gains and losses. There is a very high degree of risk involved in trading. The technical analysis , like any and all indicators, strategies, columns, articles and other features accessible on/though this site (including those from Signal Centre) are for informational purposes only and should not be construed as investment advice by you. Such technical analysis are believed to be obtained from sources believed to be reliable, but not warrant their respective completeness or accuracy, or warrant any results from the use of the information. Your use of the technical analysis , as would also your use of any and all mentioned indicators, strategies, columns, articles and all other features, is entirely at your own risk and it is your sole responsibility to evaluate the accuracy, completeness and usefulness (including suitability) of the information. You should assess the risk of any trade with your financial adviser and make your own independent decision(s) regarding any tradable products which may be the subject matter of the technical analysis or any of the said indicators, strategies, columns, articles and all other features.
Please also be reminded that if despite the above, any of the said technical analysis (or any of the said indicators, strategies, columns, articles and other features accessible on/through this site) is found to be advisory or a recommendation; and not merely informational in nature, the same is in any event provided with the intention of being for general circulation and availability only. As such it is not intended to and does not form part of any offer or recommendation directed at you specifically, or have any regard to the investment objectives, financial situation or needs of yourself or any other specific person. Before committing to a trade or investment therefore, please seek advice from a financial or other professional adviser regarding the suitability of the product for you and (where available) read the relevant product offer/description documents, including the risk disclosures. If you do not wish to seek such financial advice, please still exercise your mind and consider carefully whether the product is suitable for you because you alone remain responsible for your trading – both gains and losses.

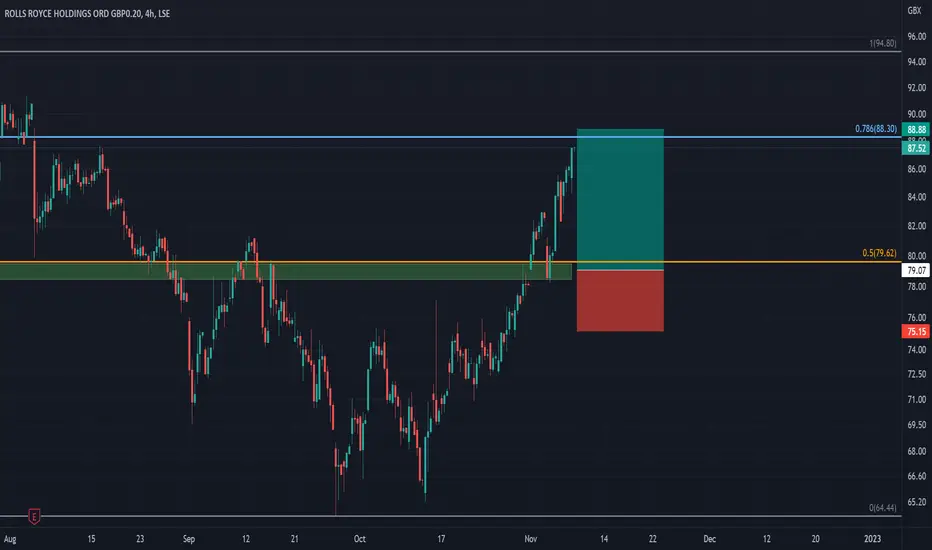
RR to found buyers at 50% pullback?Rolls Royce (RR.) - 30d expiry- We look to Buy at 79.07 (stop at 75.15)
Short term bias has turned positive.
Levels close to the 50% pullback level of 79.62 found buyers.
Levels below 80.00 continue to attract buyers.
We look to buy dips.
Daily signals are mildly bullish.
Our profit targets will be 88.88 and 90.88
Resistance: 90.00 / 94.80 / 97.00
Support: 84.50 / 82.00 / 78.30
Disclaimer – Saxo Bank Group.
Please be reminded – you alone are responsible for your trading – both gains and losses. There is a very high degree of risk involved in trading. The technical analysis , like any and all indicators, strategies, columns, articles and other features accessible on/though this site (including those from Signal Centre) are for informational purposes only and should not be construed as investment advice by you. Such technical analysis are believed to be obtained from sources believed to be reliable, but not warrant their respective completeness or accuracy, or warrant any results from the use of the information. Your use of the technical analysis , as would also your use of any and all mentioned indicators, strategies, columns, articles and all other features, is entirely at your own risk and it is your sole responsibility to evaluate the accuracy, completeness and usefulness (including suitability) of the information. You should assess the risk of any trade with your financial adviser and make your own independent decision(s) regarding any tradable products which may be the subject matter of the technical analysis or any of the said indicators, strategies, columns, articles and all other features.
Please also be reminded that if despite the above, any of the said technical analysis (or any of the said indicators, strategies, columns, articles and other features accessible on/through this site) is found to be advisory or a recommendation; and not merely informational in nature, the same is in any event provided with the intention of being for general circulation and availability only. As such it is not intended to and does not form part of any offer or recommendation directed at you specifically, or have any regard to the investment objectives, financial situation or needs of yourself or any other specific person. Before committing to a trade or investment therefore, please seek advice from a financial or other professional adviser regarding the suitability of the product for you and (where available) read the relevant product offer/description documents, including the risk disclosures. If you do not wish to seek such financial advice, please still exercise your mind and consider carefully whether the product is suitable for you because you alone remain responsible for your trading – both gains and losses.
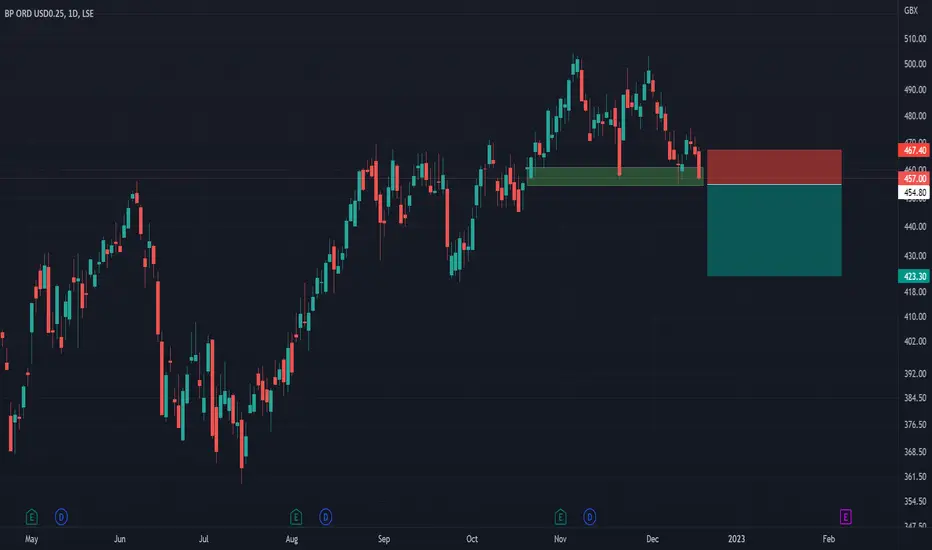
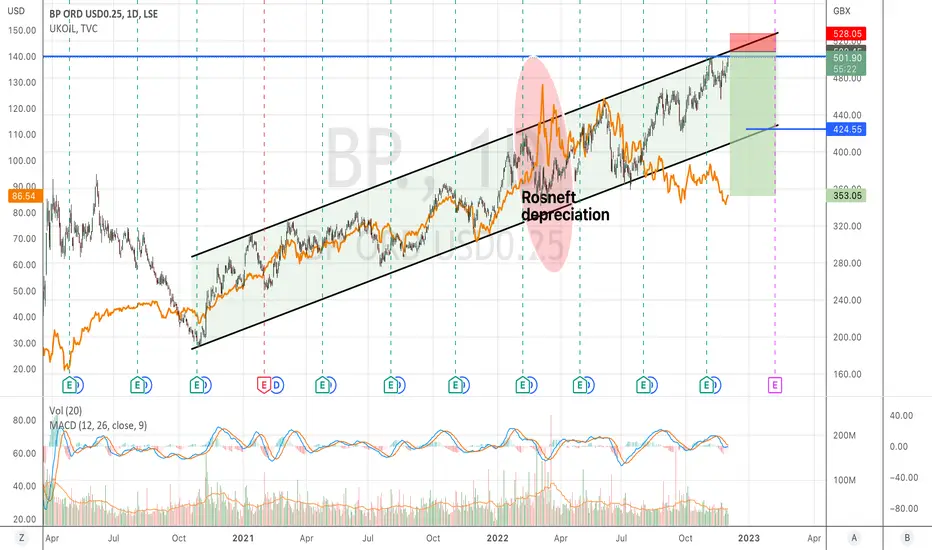
BP at overbought extremes.BP. (BP.) - 30d expiry - We look to Sell a break of 454.8 (stop at 467.4)
Daily signals for sentiment are at overbought extremes.
A higher correction is expected.
A break of the recent low at 455 should result in a further move lower.
The bias is to break to the downside.
Short term momentum is bearish.
Current prices have reacted from a low of 455, however, we expect further losses to follow.
Our profit targets will be 423.3 and 416.3
Resistance: 470 / 475 / 483
Support: 455 / 445 / 440
Disclaimer – Saxo Bank Group.
Please be reminded – you alone are responsible for your trading – both gains and losses. There is a very high degree of risk involved in trading. The technical analysis , like any and all indicators, strategies, columns, articles and other features accessible on/though this site (including those from Signal Centre) are for informational purposes only and should not be construed as investment advice by you. Such technical analysis are believed to be obtained from sources believed to be reliable, but not warrant their respective completeness or accuracy, or warrant any results from the use of the information. Your use of the technical analysis , as would also your use of any and all mentioned indicators, strategies, columns, articles and all other features, is entirely at your own risk and it is your sole responsibility to evaluate the accuracy, completeness and usefulness (including suitability) of the information. You should assess the risk of any trade with your financial adviser and make your own independent decision(s) regarding any tradable products which may be the subject matter of the technical analysis or any of the said indicators, strategies, columns, articles and all other features.
Please also be reminded that if despite the above, any of the said technical analysis (or any of the said indicators, strategies, columns, articles and other features accessible on/through this site) is found to be advisory or a recommendation; and not merely informational in nature, the same is in any event provided with the intention of being for general circulation and availability only. As such it is not intended to and does not form part of any offer or recommendation directed at you specifically, or have any regard to the investment objectives, financial situation or needs of yourself or any other specific person. Before committing to a trade or investment therefore, please seek advice from a financial or other professional adviser regarding the suitability of the product for you and (where available) read the relevant product offer/description documents, including the risk disclosures. If you do not wish to seek such financial advice, please still exercise your mind and consider carefully whether the product is suitable for you because you alone remain responsible for your trading – both gains and losses.
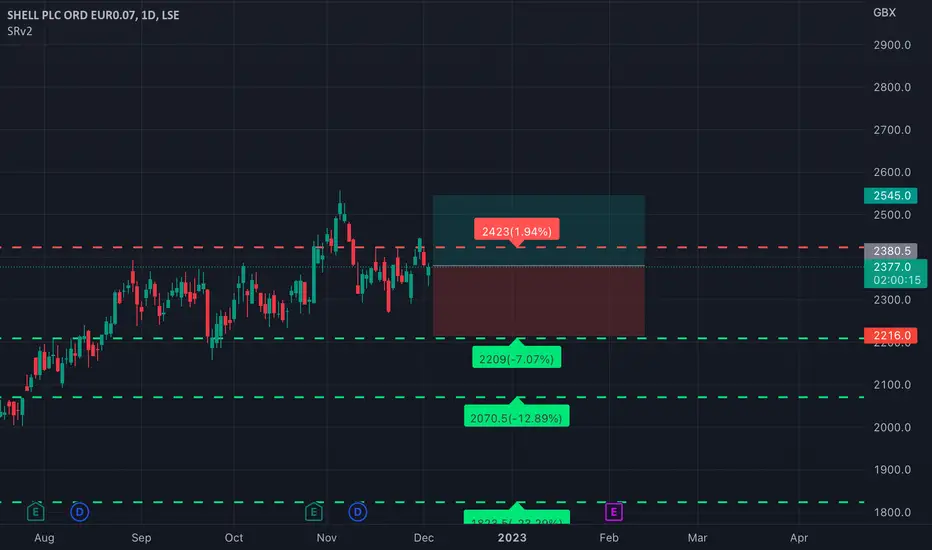
SHELL | Bearish Move | 4 Hr
SHELL is not making new HH's
Also it broke major trendline
It is near the resistance (Entry)
Trend indicates that it will continue its bearish move.
It is not a financial advice.
Thanks

Target 71.28 ( 1 to 5 months )Good Fundamental and Technical and good Breakout , So Target 71.28 , Duration 1 to 5 months...........

Easyjet in Inverted head and shoulders?EasyJet - 30d expiry - We look to Buy at 351.1 (stop at 332.9)
A bullish reverse Head and Shoulders is forming.
Levels below 350 continue to attract buyers.
Bespoke support is located at 345.
We look to buy dips.
This stock has seen good sales growth.
338 has been pivotal.
Our profit targets will be 396.6 and 406.6
Resistance: 375 / 400 / 430
Support: 360 / 345 / 320
Disclaimer – Saxo Bank Group.
Please be reminded – you alone are responsible for your trading – both gains and losses. There is a very high degree of risk involved in trading. The technical analysis , like any and all indicators, strategies, columns, articles and other features accessible on/though this site (including those from Signal Centre) are for informational purposes only and should not be construed as investment advice by you. Such technical analysis are believed to be obtained from sources believed to be reliable, but not warrant their respective completeness or accuracy, or warrant any results from the use of the information. Your use of the technical analysis , as would also your use of any and all mentioned indicators, strategies, columns, articles and all other features, is entirely at your own risk and it is your sole responsibility to evaluate the accuracy, completeness and usefulness (including suitability) of the information. You should assess the risk of any trade with your financial adviser and make your own independent decision(s) regarding any tradable products which may be the subject matter of the technical analysis or any of the said indicators, strategies, columns, articles and all other features.
Please also be reminded that if despite the above, any of the said technical analysis (or any of the said indicators, strategies, columns, articles and other features accessible on/through this site) is found to be advisory or a recommendation; and not merely informational in nature, the same is in any event provided with the intention of being for general circulation and availability only. As such it is not intended to and does not form part of any offer or recommendation directed at you specifically, or have any regard to the investment objectives, financial situation or needs of yourself or any other specific person. Before committing to a trade or investment therefore, please seek advice from a financial or other professional adviser regarding the suitability of the product for you and (where available) read the relevant product offer/description documents, including the risk disclosures. If you do not wish to seek such financial advice, please still exercise your mind and consider carefully whether the product is suitable for you because you alone remain responsible for your trading – both gains and losses.

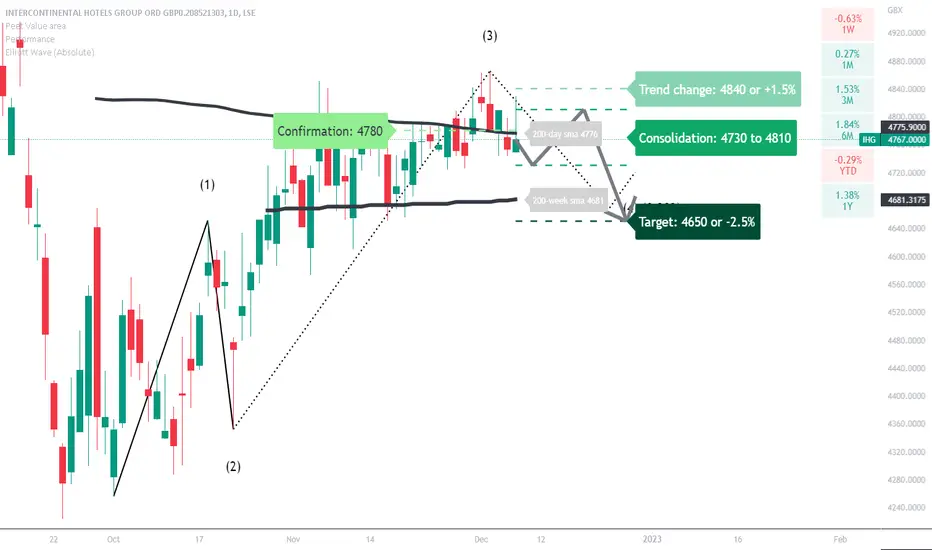
IHG: corrective waveA typical 1, 2 and 3 wave pattern is busy unfolding.
It appears that the price action is busy with wave 4, which is a corrective wave.
The net movement of corrective waves is against the trend at one larger degree. Corrective waves typically consist of three sub-waves.
The target is set at 4650, which is just below its 200-week simple moving average.
Crossing above 4840 will negate the corrective wave.
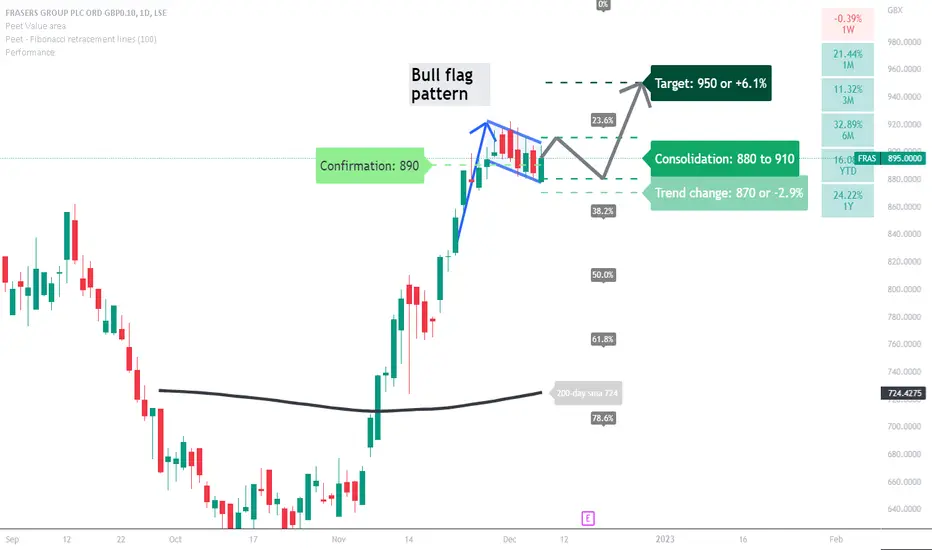
FRAS: bull flag pattern?It seems like a bull flag pattern is busy developing.
A price action above 870 supports a bullish trend direction. Further confirmation above 890.
Crossing below this level will negate the bullish trend and acts as a stop-loss.
Increase exposure from a break above the 910 resistance.
Decrease exposure for a break below the 880 support.
Target is set at 950.
Remains a risky trade as the price action is already in overbought territory.
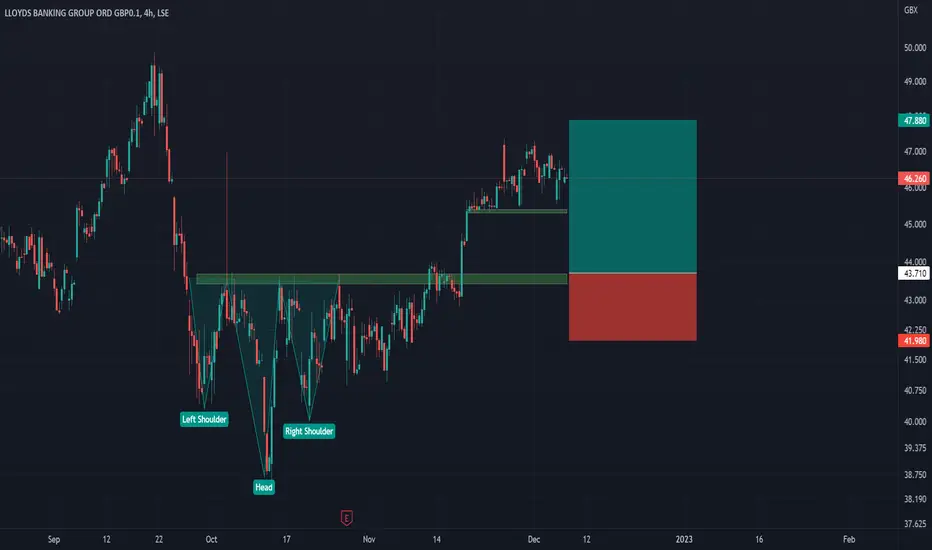
LLOY being a good buy at IH&S highs?Lloyds Bank - 30d expiry- We look to Buy at 43.71 (stop at 41.98)
Broken out of the Head and Shoulders formation to the upside.
Previous resistance at 43.70 now becomes support.
We look for a temporary move lower.
Support is located at 43.70 and should stem dips to this area.
Daily signals are mildly bullish.
Expect trading to remain mixed and volatile.
A break of support at 45.30 should lead to a more aggressive move lower towards 43.70.
Our profit targets will be 47.88 and 48.88
Resistance: 47.35 / 48.00 / 49.85
Support: 45.30 / 43.70 / 43.00
Disclaimer – Saxo Bank Group.
Please be reminded – you alone are responsible for your trading – both gains and losses. There is a very high degree of risk involved in trading. The technical analysis , like any and all indicators, strategies, columns, articles and other features accessible on/though this site (including those from Signal Centre) are for informational purposes only and should not be construed as investment advice by you. Such technical analysis are believed to be obtained from sources believed to be reliable, but not warrant their respective completeness or accuracy, or warrant any results from the use of the information. Your use of the technical analysis , as would also your use of any and all mentioned indicators, strategies, columns, articles and all other features, is entirely at your own risk and it is your sole responsibility to evaluate the accuracy, completeness and usefulness (including suitability) of the information. You should assess the risk of any trade with your financial adviser and make your own independent decision(s) regarding any tradable products which may be the subject matter of the technical analysis or any of the said indicators, strategies, columns, articles and all other features.
Please also be reminded that if despite the above, any of the said technical analysis (or any of the said indicators, strategies, columns, articles and other features accessible on/through this site) is found to be advisory or a recommendation; and not merely informational in nature, the same is in any event provided with the intention of being for general circulation and availability only. As such it is not intended to and does not form part of any offer or recommendation directed at you specifically, or have any regard to the investment objectives, financial situation or needs of yourself or any other specific person. Before committing to a trade or investment therefore, please seek advice from a financial or other professional adviser regarding the suitability of the product for you and (where available) read the relevant product offer/description documents, including the risk disclosures. If you do not wish to seek such financial advice, please still exercise your mind and consider carefully whether the product is suitable for you because you alone remain responsible for your trading – both gains and losses.
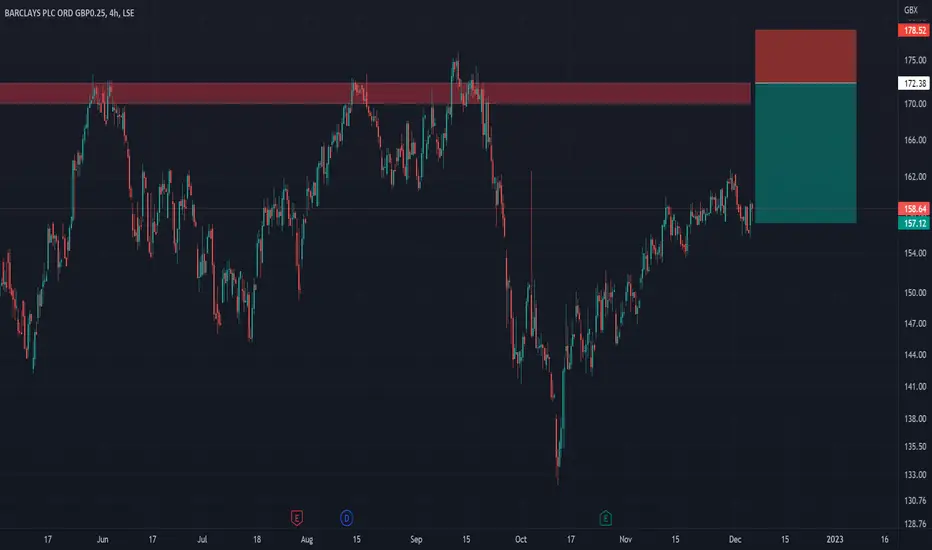
Barclays gains to be capped.Barclays - 30d expiry - We look to Sell at 172.38 (stop at 178.52)
175 continues to hold back the bulls.
Broken out of the Head and Shoulders formation to the upside.
The primary trend remains bearish.
Bespoke resistance is located at 173.
Early optimism is likely to lead to gains although extended attempts higher are expected to fail.
Resistance could prove difficult to breakdown.
Our profit targets will be 157.12 and 152.12
Resistance: 162.50 / 167.00 / 173.00
Support: 155.60 / 150.00 / 145.00
Disclaimer – Saxo Bank Group.
Please be reminded – you alone are responsible for your trading – both gains and losses. There is a very high degree of risk involved in trading. The technical analysis , like any and all indicators, strategies, columns, articles and other features accessible on/though this site (including those from Signal Centre) are for informational purposes only and should not be construed as investment advice by you. Such technical analysis are believed to be obtained from sources believed to be reliable, but not warrant their respective completeness or accuracy, or warrant any results from the use of the information. Your use of the technical analysis , as would also your use of any and all mentioned indicators, strategies, columns, articles and all other features, is entirely at your own risk and it is your sole responsibility to evaluate the accuracy, completeness and usefulness (including suitability) of the information. You should assess the risk of any trade with your financial adviser and make your own independent decision(s) regarding any tradable products which may be the subject matter of the technical analysis or any of the said indicators, strategies, columns, articles and all other features.
Please also be reminded that if despite the above, any of the said technical analysis (or any of the said indicators, strategies, columns, articles and other features accessible on/through this site) is found to be advisory or a recommendation; and not merely informational in nature, the same is in any event provided with the intention of being for general circulation and availability only. As such it is not intended to and does not form part of any offer or recommendation directed at you specifically, or have any regard to the investment objectives, financial situation or needs of yourself or any other specific person. Before committing to a trade or investment therefore, please seek advice from a financial or other professional adviser regarding the suitability of the product for you and (where available) read the relevant product offer/description documents, including the risk disclosures. If you do not wish to seek such financial advice, please still exercise your mind and consider carefully whether the product is suitable for you because you alone remain responsible for your trading – both gains and losses.
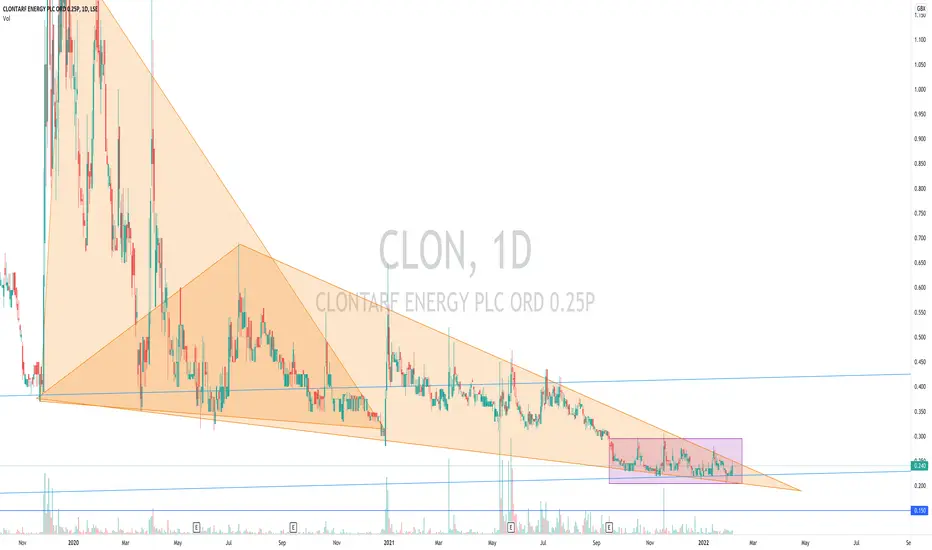
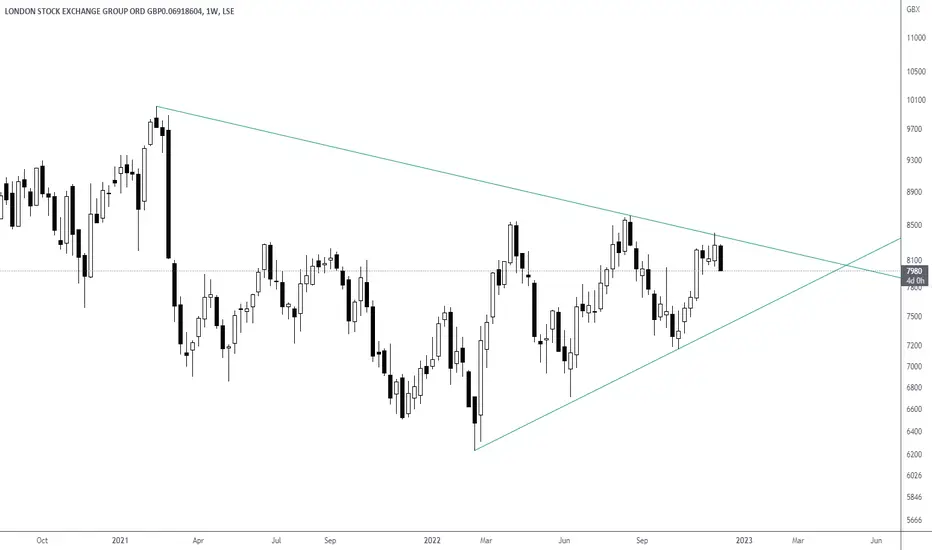
Breakout about to happen on London Stock Exchange Group (LSEG)Price movement is primarily trapped inside the triangle formation, however if we examine under the bonnet, the most recent lows are high lows, that being said, the corresponding highs are a mixed bag.
The bias for the direction of possible break out is, therefore, slightly tilted towards the upside.
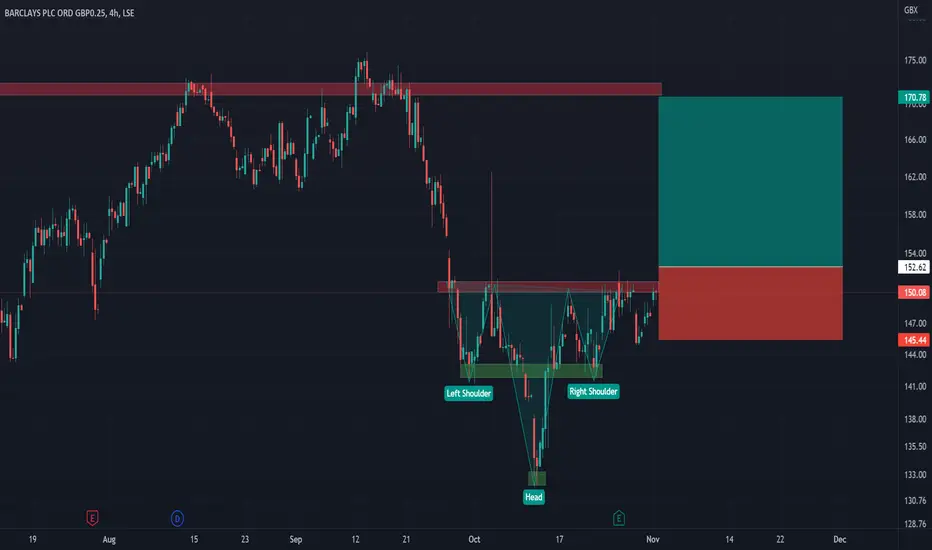
BARC to break from IH&S.Barclays - 30d expiry - We look to Buy a break of 152.62 (stop at 145.44)
We are trading at oversold extremes.
A bullish reverse Head and Shoulders has formed.
Short term bias has turned positive.
Prices have reacted from 132.06.
A break of the recent high at 152.22 should result in a further move higher.
Our outlook is bullish.
Our profit targets will be 170.78 and 175.78
Resistance: 151.00 / 160.00 / 170.00
Support: 143.00 / 140.00 / 132.00
Disclaimer – Saxo Bank Group.
Please be reminded – you alone are responsible for your trading – both gains and losses. There is a very high degree of risk involved in trading. The technical analysis , like any and all indicators, strategies, columns, articles and other features accessible on/though this site (including those from Signal Centre) are for informational purposes only and should not be construed as investment advice by you. Such technical analysis are believed to be obtained from sources believed to be reliable, but not warrant their respective completeness or accuracy, or warrant any results from the use of the information. Your use of the technical analysis , as would also your use of any and all mentioned indicators, strategies, columns, articles and all other features, is entirely at your own risk and it is your sole responsibility to evaluate the accuracy, completeness and usefulness (including suitability) of the information. You should assess the risk of any trade with your financial adviser and make your own independent decision(s) regarding any tradable products which may be the subject matter of the technical analysis or any of the said indicators, strategies, columns, articles and all other features.
Please also be reminded that if despite the above, any of the said technical analysis (or any of the said indicators, strategies, columns, articles and other features accessible on/through this site) is found to be advisory or a recommendation; and not merely informational in nature, the same is in any event provided with the intention of being for general circulation and availability only. As such it is not intended to and does not form part of any offer or recommendation directed at you specifically, or have any regard to the investment objectives, financial situation or needs of yourself or any other specific person. Before committing to a trade or investment therefore, please seek advice from a financial or other professional adviser regarding the suitability of the product for you and (where available) read the relevant product offer/description documents, including the risk disclosures. If you do not wish to seek such financial advice, please still exercise your mind and consider carefully whether the product is suitable for you because you alone remain responsible for your trading – both gains and losses.
LLoyds Bank in inverted and shoulders.Lloyds Bank - 30d expiry - We look to Buy a break of 43.71 (stop at 41.98)
Trading has been mixed and volatile.
A bullish reverse Head and Shoulders has formed.
43.62 has been pivotal.
A break of the recent high at 43.62 should result in a further move higher.
The bias is to break to the upside.
Our outlook is bullish.
Our profit targets will be 47.88 and 49.88
Resistance: 43.60 / 45.00 / 46.50
Support: 42.00 / 40.50 / 38.50
Disclaimer – Saxo Bank Group.
Please be reminded – you alone are responsible for your trading – both gains and losses. There is a very high degree of risk involved in trading. The technical analysis , like any and all indicators, strategies, columns, articles and other features accessible on/though this site (including those from Signal Centre) are for informational purposes only and should not be construed as investment advice by you. Such technical analysis are believed to be obtained from sources believed to be reliable, but not warrant their respective completeness or accuracy, or warrant any results from the use of the information. Your use of the technical analysis , as would also your use of any and all mentioned indicators, strategies, columns, articles and all other features, is entirely at your own risk and it is your sole responsibility to evaluate the accuracy, completeness and usefulness (including suitability) of the information. You should assess the risk of any trade with your financial adviser and make your own independent decision(s) regarding any tradable products which may be the subject matter of the technical analysis or any of the said indicators, strategies, columns, articles and all other features.
Please also be reminded that if despite the above, any of the said technical analysis (or any of the said indicators, strategies, columns, articles and other features accessible on/through this site) is found to be advisory or a recommendation; and not merely informational in nature, the same is in any event provided with the intention of being for general circulation and availability only. As such it is not intended to and does not form part of any offer or recommendation directed at you specifically, or have any regard to the investment objectives, financial situation or needs of yourself or any other specific person. Before committing to a trade or investment therefore, please seek advice from a financial or other professional adviser regarding the suitability of the product for you and (where available) read the relevant product offer/description documents, including the risk disclosures. If you do not wish to seek such financial advice, please still exercise your mind and consider carefully whether the product is suitable for you because you alone remain responsible for your trading – both gains and losses.

GLENCORE SHARE will be dumped Glancore shares are going to be dumped by investors. Technical indicators of a brutal massive sell-off of Glencore share price. Glencore activities are criminal

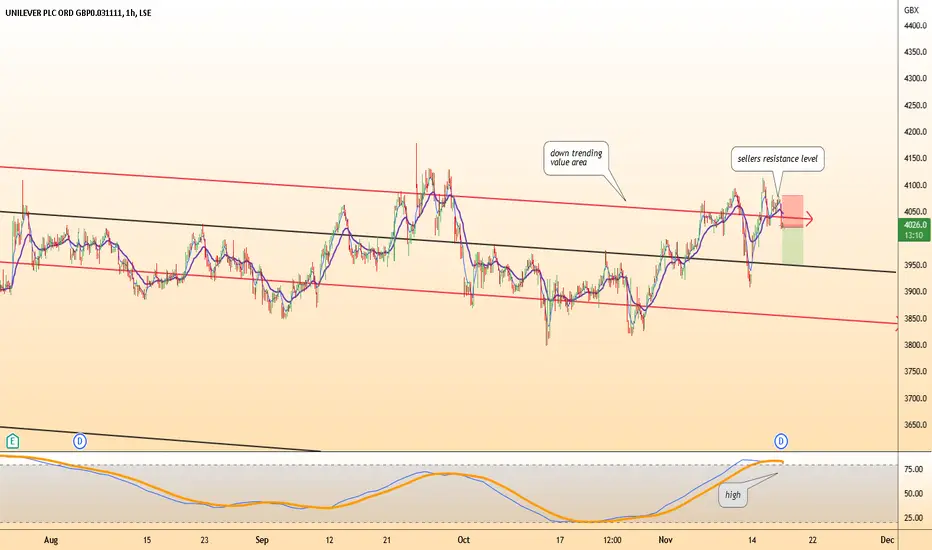
ULVR shortA down trending value area
Sellers resistance at top value area edge
Daily stochastic at high extreme
5/20ma cross trigger
stop loss previous high
target value area control line or possible lower edge value area
exit at re cross of 5/20ma
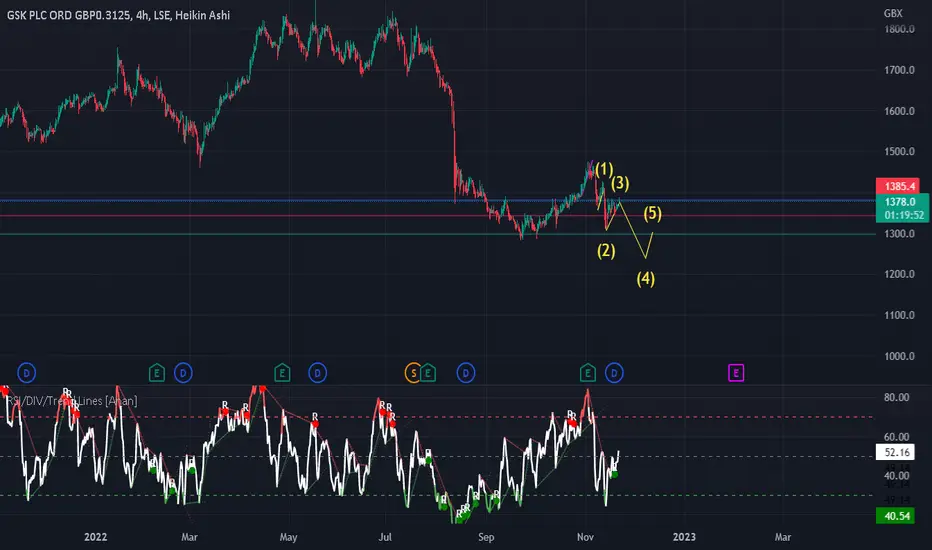
GSKI do not provide personal investment advice and I am not a qualified licensed investment advisor.
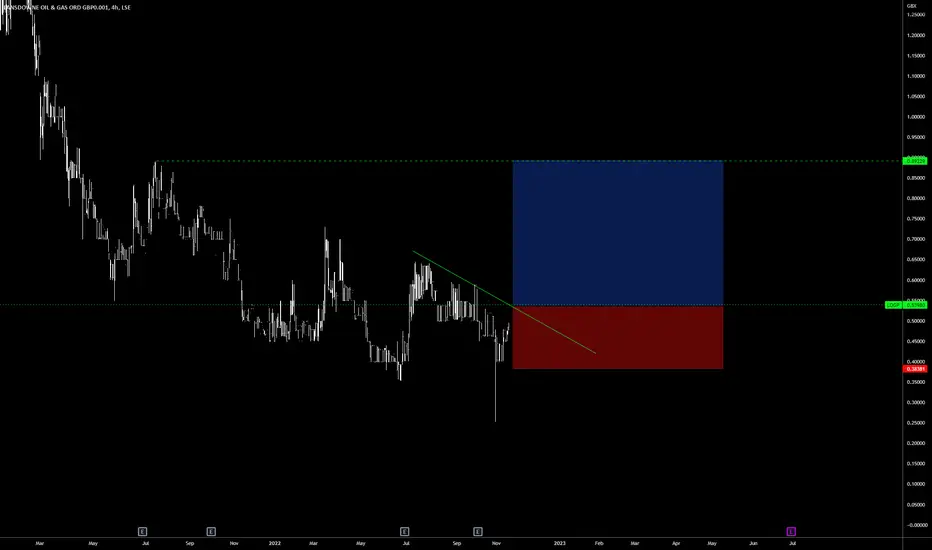
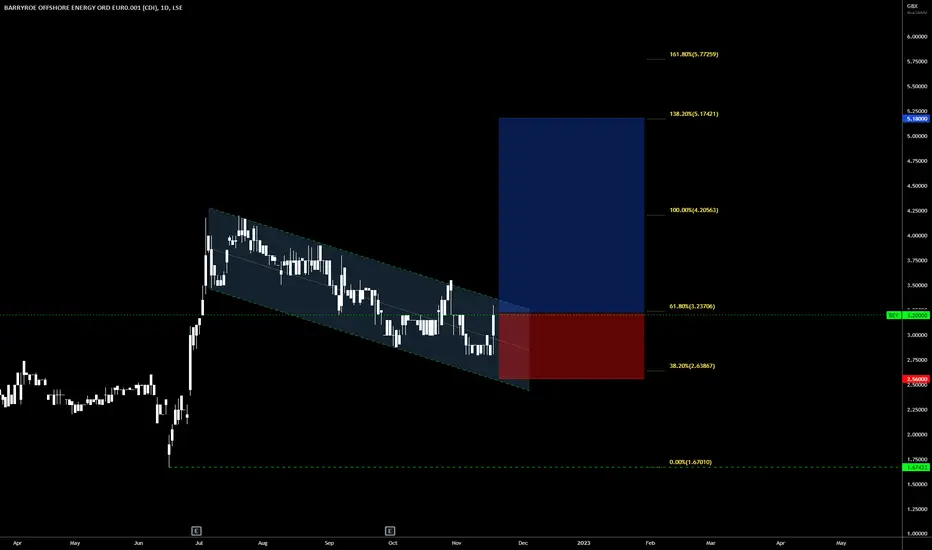
Barryroe Offshore Energy Long for strong upside.Barryroe Offshore Energy Long for strong upside.
We could see a strong continuation of the impulse after consolidation here.