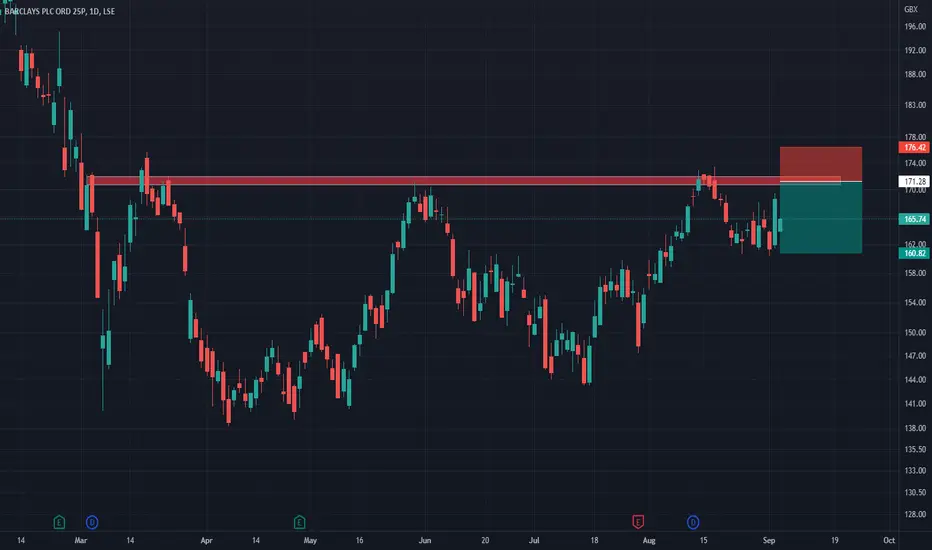
Barclays: Money not in the bank Barclays
Short Term
We look to Sell at 171.28 (stop at 176.42)
Previous resistance located at 170.00. Although the bulls are in control, the stalling positive momentum indicates a turnaround is possible. We look for a temporary move lower. We therefore, prefer to fade into the rally with a tight stop in anticipation of a move back lower.
Our profit targets will be 160.82 and 151.60
Resistance: 170.00 / 175.00 / 195.00
Support: 160.00 / 151.00 / 143.00
Disclaimer – Saxo Bank Group. Please be reminded – you alone are responsible for your trading – both gains and losses. There is a very high degree of risk involved in trading. The technical analysis, like any and all indicators, strategies, columns, articles and other features accessible on/though this site (including those from Signal Centre) are for informational purposes only and should not be construed as investment advice by you. Such technical analysis are believed to be obtained from sources believed to be reliable, but not warrant their respective completeness or accuracy, or warrant any results from the use of the information. Your use of the technical analysis, as would also your use of any and all mentioned indicators, strategies, columns, articles and all other features, is entirely at your own risk and it is your sole responsibility to evaluate the accuracy, completeness and usefulness (including suitability) of the information. You should assess the risk of any trade with your financial adviser and make your own independent decision(s) regarding any tradable products which may be the subject matter of the technical analysis or any of the said indicators, strategies, columns, articles and all other features.
Please also be reminded that if despite the above, any of the said technical analysis (or any of the said indicators, strategies, columns, articles and other features accessible on/through this site) is found to be advisory or a recommendation; and not merely informational in nature, the same is in any event provided with the intention of being for general circulation and availability only. As such it is not intended to and does not form part of any offer or recommendation directed at you specifically, or have any regard to the investment objectives, financial situation or needs of yourself or any other specific person. Before committing to a trade or investment therefore, please seek advice from a financial or other professional adviser regarding the suitability of the product for you and (where available) read the relevant product offer/description documents, including the risk disclosures. If you do not wish to seek such financial advice, please still exercise your mind and consider carefully whether the product is suitable for you because you alone remain responsible for your trading – both gains and losses.
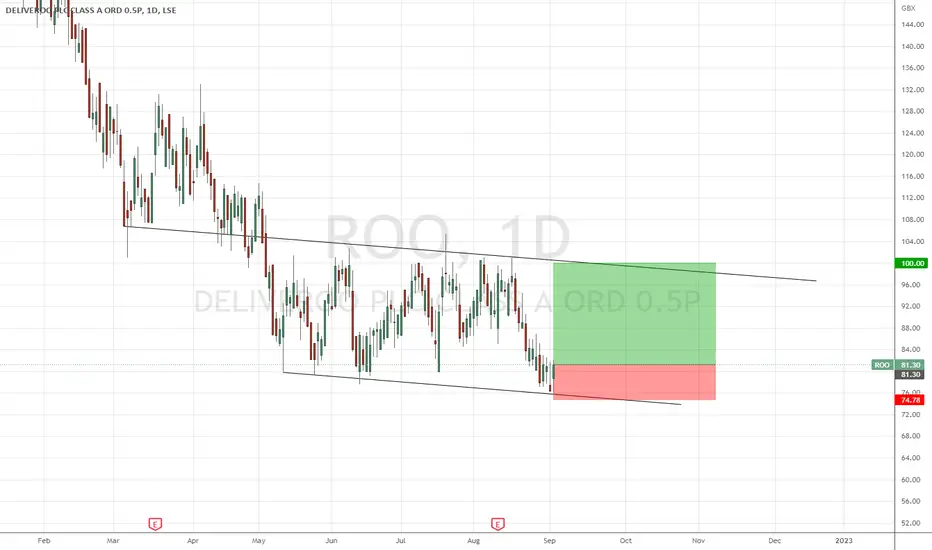
ROO:Can base hold?Roo has been a disappointment from a price perspective since listing north of 380 and now trading at 81. I am looking at a base forming and want to play that base holding to a target of 100. Potential R OF 2.87.
BAB: Ascending triangle?Lookin at another bullish continuation. Ascending triangle taking shape. Will target the neckline resistance for an R of 2.55.

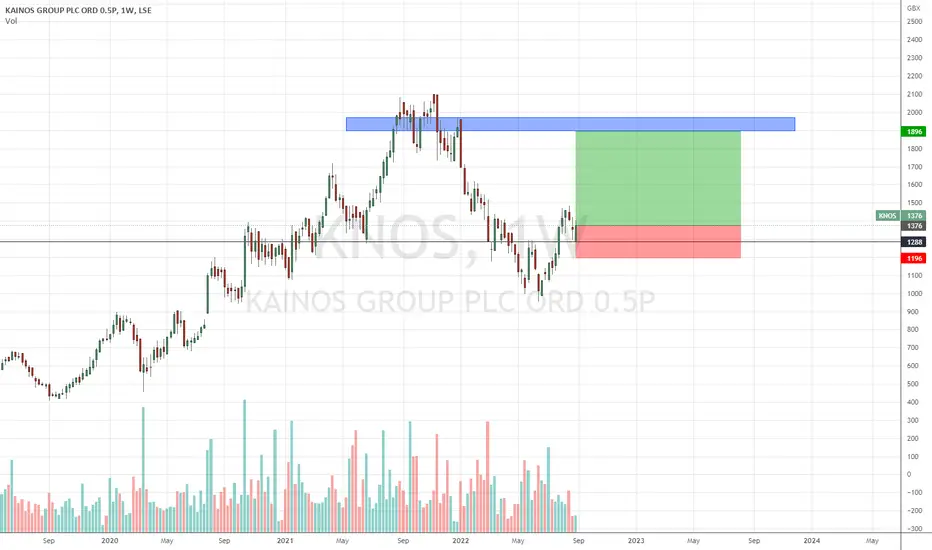
KAINOS: Bullish continuation?Looking for a bullish continuation from last week's strong weekly candle. A bullish head and shoulders taking shape and targeting 1900 zone. The risk to reward is 2.89 for this one.
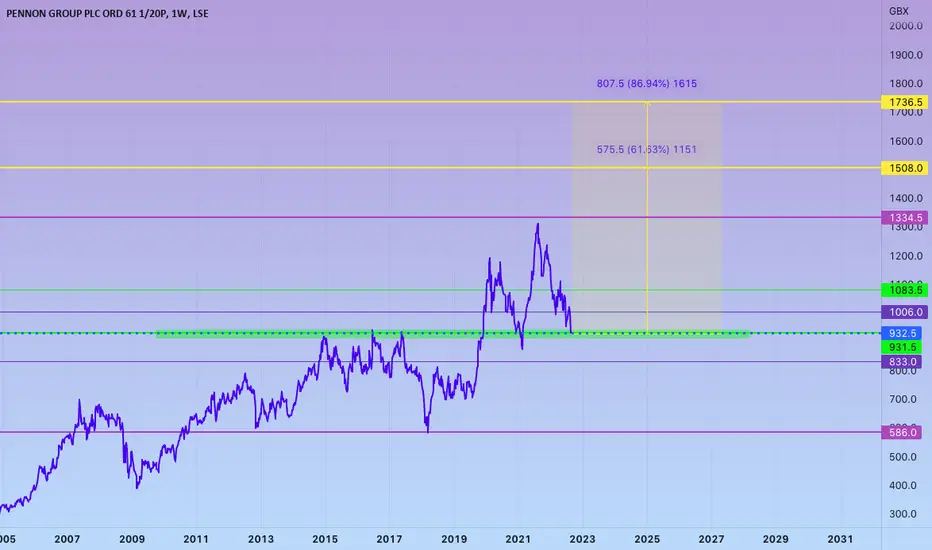
UK WATER CRISIS... SO WHATS UPInspired by the draught
Pennon Water Services are business water specialists providing water retail services for business customers’ water management needs across the UK.
We provide over 870 million litres of safe, clean drinking water, to an estimated population of c.3.5 million people every day. And when they’ve finished with it, over 19,000km of sewers take used water and surface water run-off to one of our 653 wastewater treatment works where it is treated, tested and safely returned to the environment.
I am going to list the other UK WATER UTILITY STOCKS
SENNA SEASON
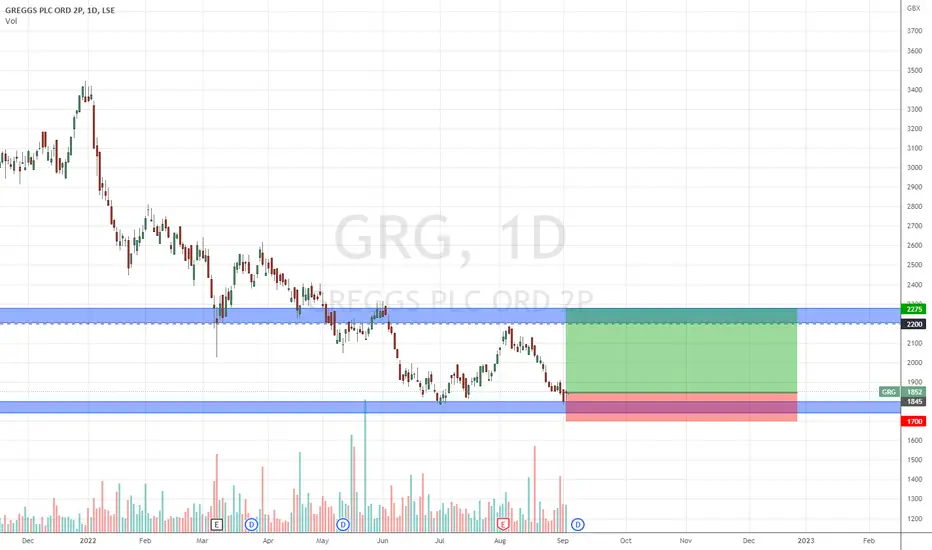
GRG:Price warming up!We are at a psychological zone and I expect the bulls to come in and defend the zone. Looking to target the next zone at the 2200 zone for a RR of 2.97.
Recovery Play?Looking to play the recovery up from the bounce from 2 positions. The 1st target 1090 and 2nd target 1236. Friday's candle had good volume. the proper entry would have been 30 August daily close but better late than never.
1st TP=2.44
2nd TP=4.31

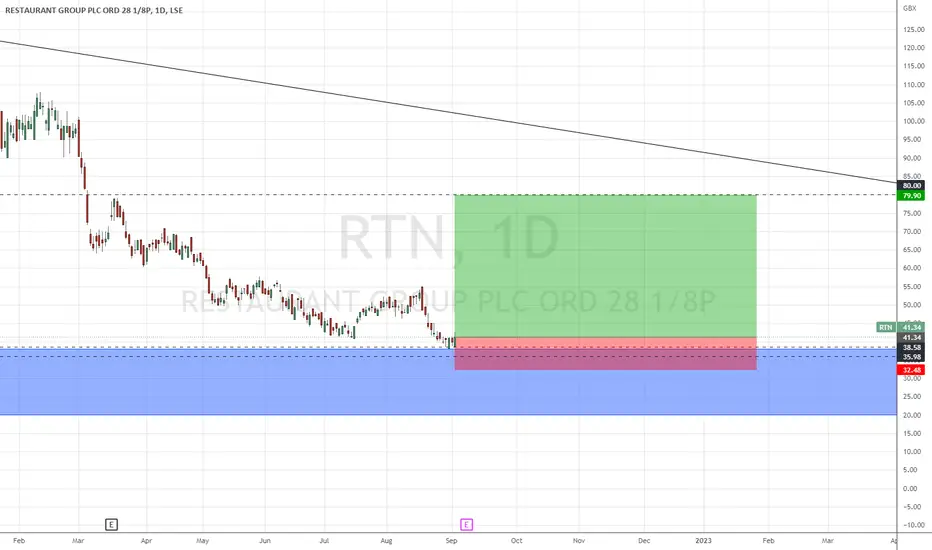
RTN:Lucrative risk reward!They recently agreed to acquire a Mexican style restaurant for £7 mil. With inflation expected to go slightly higher than current levels, consumer spending will definitely go down. Despite this I expect bulls to come in and support the share and catapult it higher from these levels its currently trading at. We are currently close to the all time lows and price action created a bullish formation on the weekly last week.
I look to buy last week's close with ultimate target being the £80.00 zone. Will however take some off the table around the £60.00 zone. Total R is 4.35.
GKP continues in 2yr ascending channelGKP continue to hold
Continues in 2yr plus ascending channel with broker rating+50% and continued dividends
no advice given

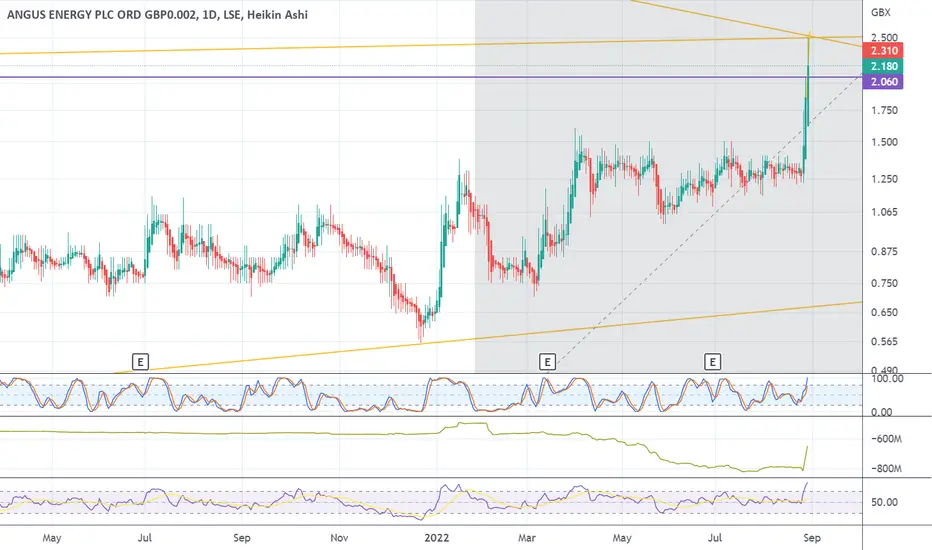
$angs.l Angus Energy PLC Price Change % Change Share Price Bid Price Offer Price High Price Low Price Open Price Shares Traded Last Trade
0.26 12.68% 2.31 2.25 2.30 2.475 2.075 2.075 252,253,435 16:35:09
great fundamentals, expecting positive rns September. active oil wells and ownership. im buying for long term, 30p target
NatWest NWG 1dayShorting and take profit target 230p, only trading Friday. Share Price: 252.90Bid: 252.50Ask: 252.60Change: -3.90 (-1.52%)
they have a stock 13/14 reverse split on Tuesday 30th Aug 2022 and special dividend snapshot. expect volatility that week.

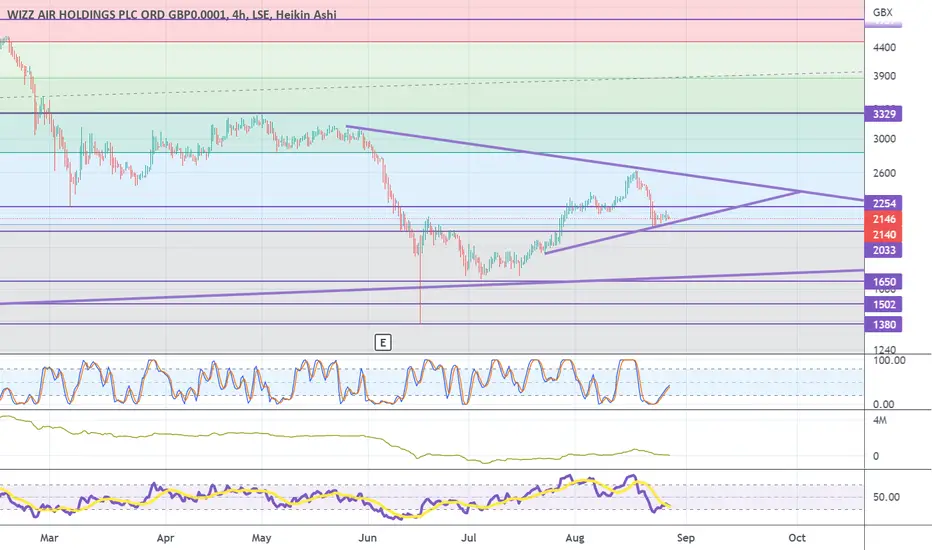
wizz air 4hr for the aviation industry im bullish, making a good pandemic recovery, The aviation market is anticipated to register a CAGR of over 5% during the forecast period (2022 - 2027). it is expected to take 2-3 years to recover completely. However, the return of the Boeing 737MAX into service and the recovery in domestic demand helped the OEMs in obtaining more orders and increasing aircraft deliveries in 2021.
AVACTA Update - Don't sell too earlyThis is a friendly note, just to say, don't sell too early. I don't want you sitting at the dinner table at christmas, with a frown on your face.
Purely from what this chart is saying; forget about all the positive fundamentals going on in the background.
(1) We had an impulse move from the lows down @ ~40p, up back inside the previous range and on to 130p. From which we have seen a healthy correction, and the lows of the previous range held well. Drawing a fibonacci retracement of that move we can see that 0.5 held well (will post image below).
Following this correction we have seen price now break out from previous diagonal resistance.
(2) And now we have the price action and the lagging strand nicely clear of one another and the cloud, across multiple time frames; a bullish scenario. This can be especially said for the last time it broke out on the 4 hour chart. (This is pointed out on the chart).
Now i dont think this break out, combined with the fact that we are above the cloud will be any different from the last break and impulse move.
(3) Now I'm no Elliott wave theory specialist, but having a rudimentary count, means that we are for wave through of the overall 5 wave move, which has a tendency to be the longer extended wave move.
Drawing a fibonacci expansion from the first move, the overhead targets for this 3rd wave are (0.618) ~ 159 ; (1.00) ~ 197 ; (1.6) ~ 260. Don't forget that these 3 waves tend to be constructed of a 5 wave move themselves.
Notice how these numbers line up quite nicely with some historical price action.
Please don't take this as financial advice. These are my own ideas, and putting them here for illustrative purposes.
I wish you all the best as always in your journey.

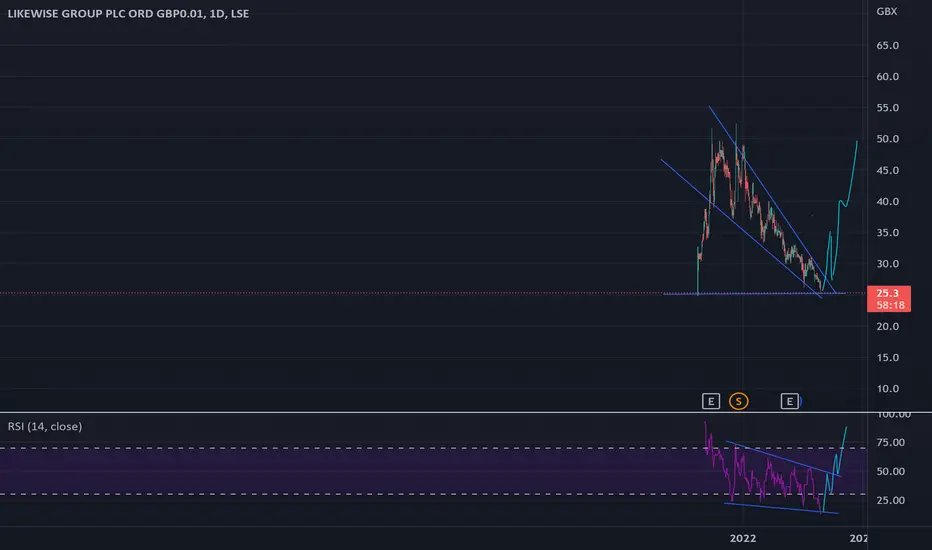
Likewise potential upside move Looking oversold on the RSI, falling wedge tightening which could lead to a move to the upside
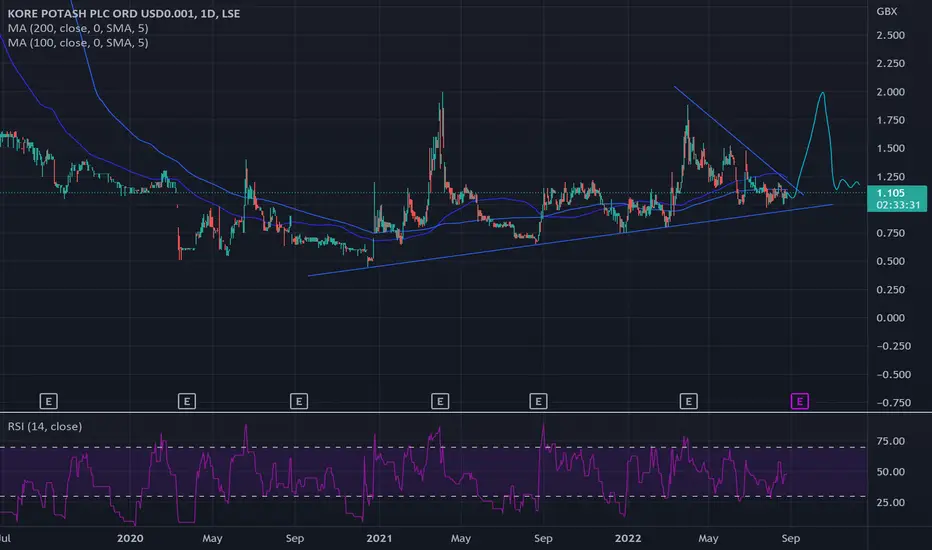
The only way is up... This just screams of a breakout.. historical support and nice wedge pattern, likely to fall back down
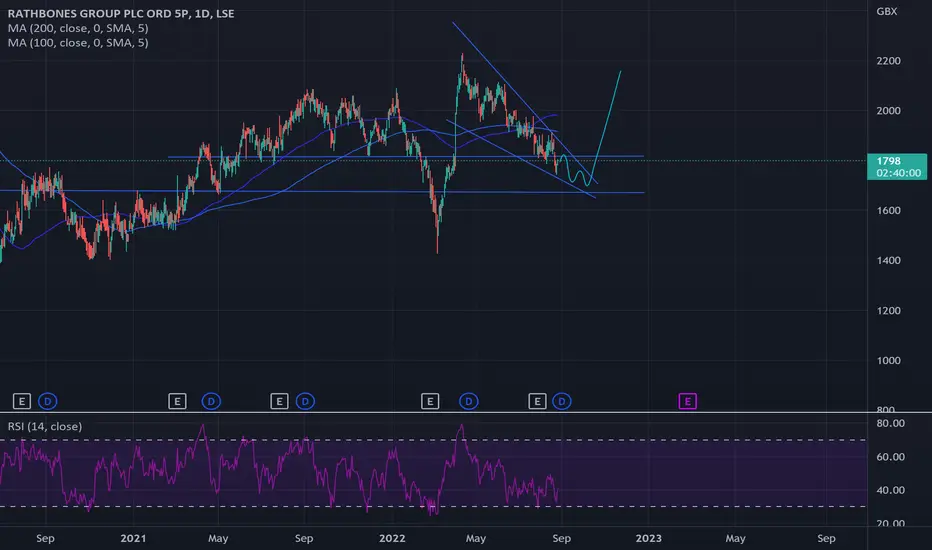
Bullish RATFalling wedge, potential breakout on the horizon, looks like the lower support would make sense
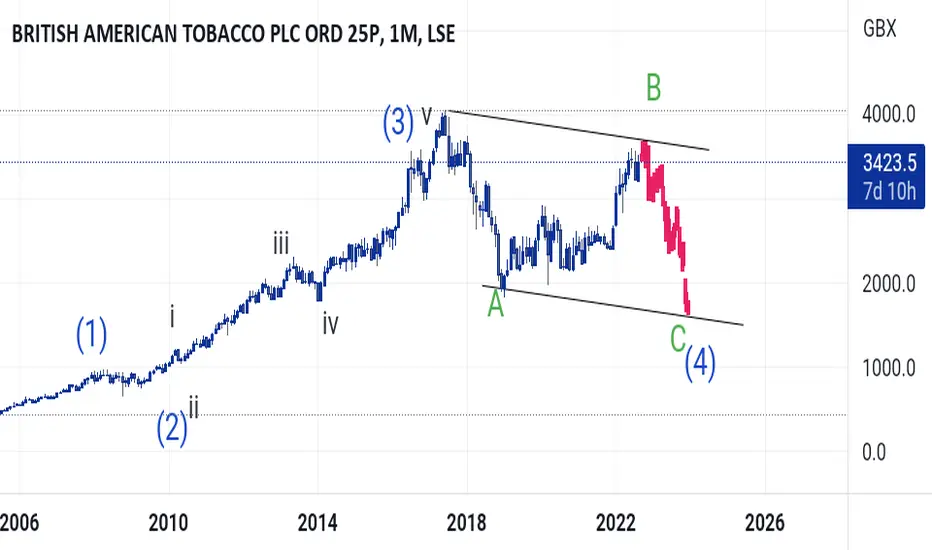
Price Action is the Only TruthAt the western markets, the stock is mimicking each other. We also have a 535 zigzag here. The AB wave is done and we are anticipating a drop to complete the C wave.
Train about to leave - Last CallSomething tells me this is your last chance to get on the AVACTA train.
Fundamentals
- We are awaiting the results of phase 1 trials, and all things are pointing for it to be very positive.
- A great pipeline of drug development
- Possible Take-over bids incoming
- With a little research, the list goes on and on to be honest for Avacta.
Charts
- Higher time frame, we have formed this bull flag from the previous impulse move.
- Price action has consolidated and we now have decent accumulation/consolidation under the upper resistance of the flag pattern.
- On to this, price action and lagging span is about to be trading above the ichimoku cloud on pretty much all important time frames. 15 minute through to 1 day. When you get this confluence across time frames it can be very exciting.
Price predictions for me are.
- 140p within 2 weeks
- 200p+ end of September.

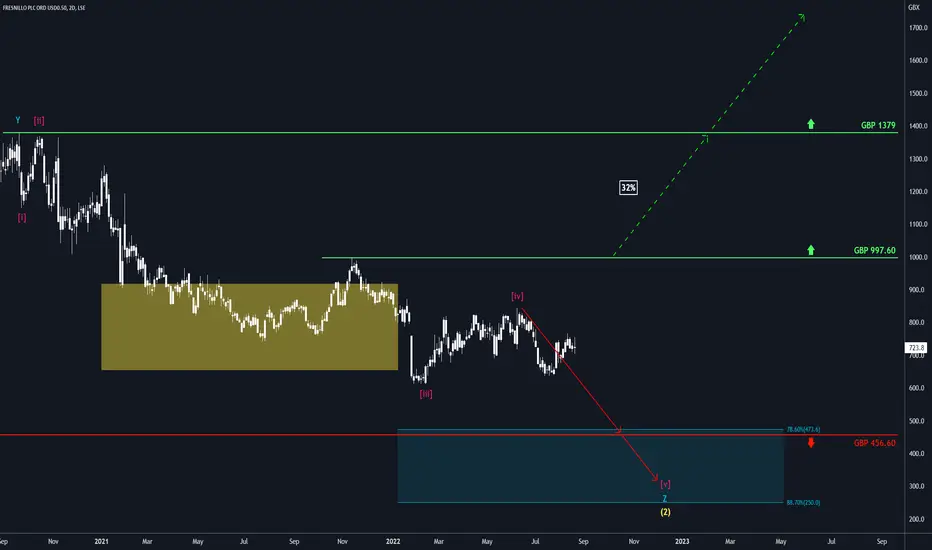
Fresnillo: Attention SeekerBulls and bears are currently both angling for Fresnillo’s attention. We still expect the bears to win, though. They should grab Fresnillo and take it below the support at GBP 456.60, pulling it into the turquoise zone between GBP 473.60 and GBP 250 to finish wave v in magenta as well as wave Z in turquoise and wave (2) in yellow. However, there is indeed a 32% chance that the bulls could be victorious instead and push Fresnillo above the resistance at GBP 997.60, thus eliciting further ascent above GBP 1379.
XLM UAH as an indicator of XLM growthHryvnia as an indicator of XLM growth is also a graph that shows when there will be an introduction of digital hryvnia based on xlm defined agreement between the Ukrainian authorities and Stellar developers already exists. With a high probability before solving the hryvnia problem, they will create a serious fall in UAH to which zone the analysis will be in the next idea and the solution will be in the form of creating a digital hryvnia in the application

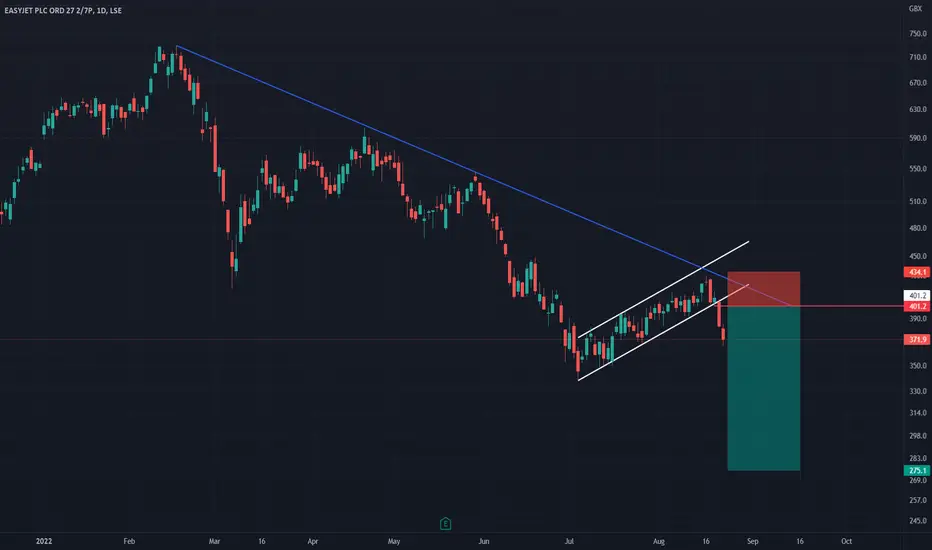
easySell? No signs of the downtrend coming to an end.EasyJet - Intraday - We look to Sell at 401.2 (stop at 434)
The medium term bias remains bearish. Broken out of the channel formation to the downside. An overnight negative theme in Equities has led to a lower open this morning. Preferred trade is to sell into rallies. Expect trading to remain mixed and volatile.
Our profit targets will be 275 and 250
Resistance: 401 / 429.9 / 448.6
Support: 368.4 / 338 / 300
Disclaimer – Saxo Bank Group. Please be reminded – you alone are responsible for your trading – both gains and losses. There is a very high degree of risk involved in trading. The technical analysis, like any and all indicators, strategies, columns, articles and other features accessible on/though this site (including those from Signal Centre) are for informational purposes only and should not be construed as investment advice by you. Such technical analysis are believed to be obtained from sources believed to be reliable, but not warrant their respective completeness or accuracy, or warrant any results from the use of the information. Your use of the technical analysis, as would also your use of any and all mentioned indicators, strategies, columns, articles and all other features, is entirely at your own risk and it is your sole responsibility to evaluate the accuracy, completeness and usefulness (including suitability) of the information. You should assess the risk of any trade with your financial adviser and make your own independent decision(s) regarding any tradable products which may be the subject matter of the technical analysis or any of the said indicators, strategies, columns, articles and all other features.
Please also be reminded that if despite the above, any of the said technical analysis (or any of the said indicators, strategies, columns, articles and other features accessible on/through this site) is found to be advisory or a recommendation; and not merely informational in nature, the same is in any event provided with the intention of being for general circulation and availability only. As such it is not intended to and does not form part of any offer or recommendation directed at you specifically, or have any regard to the investment objectives, financial situation or needs of yourself or any other specific person. Before committing to a trade or investment therefore, please seek advice from a financial or other professional adviser regarding the suitability of the product for you and (where available) read the relevant product offer/description documents, including the risk disclosures. If you do not wish to seek such financial advice, please still exercise your mind and consider carefully whether the product is suitable for you because you alone remain responsible for your trading – both gains and losses.
Jet2 part of the dart group family, neutral/long jet2 is in my list of safe stocks, i like this stock for the long term, good fundamentals and technicals. support of around £7.65 since 2018. Im long on this for the long term, phil messon ceo is a forward thinking and customer focused. one for the retirement portfolio, short term expected to hit support again before hitting ath again next year,

GGP Deep DiveHere's a macro macro (1 week chart) deep dive on GGP:
- No fundamentals here, just looking at the chart zoomed way out.
- Price bounced from the 0.786 fibonacci retracement (1 week chart). A good place for an entry, but only in hindsight now.
- Looking for this level to hold ~ 9.44, and on the lower time frames it looks as though price action is trying to form a swing higher low ~10.00.
- One might want to take an entry here in the hope that this higher low plays out and we get a reversal. But we need to go to lower time frames though as to whether or not here would be good for an entry.
- There is an overhead diagonal resistance also, blue line, which is something to keep an eye on.
- Also there is clear resistance, dead centre on the RSI, which makes sense as that price action has been bearish and therefore RSI oscillating below ~50. It would be interesting to see that resistance broken down and for price action to break above the 50 line.
1 hour and 4 hour:
- The price action and ichimoku cloud indicator shows that price action is bearish. On the 1 hour there is even a bear flag forming.
If i was in a position here:
- I would feel that I might have weathered most of the down move, and a relief rally to the upside was on the cards.
If i was taking a position here, 2 options:
(1) take an entry here, and hope the higher low plays out. A stop-loss would sit below, 9.44 (and as such, your price target should reflect this in its risk/reward ratio.
(2) wait for confirmation of an entry on the lower time frames. This might look like a bullish divergence on the 4 hour, or price action unfolding long enough sideways, that you get price action and the lagging span (ichimoku) both above the cloud on the 1 hour (and for a better quality trade) the 4 hour.
Price targets
- On a quick glance, the most immediate price target for me would be 12.82, then 15.32 after that.
