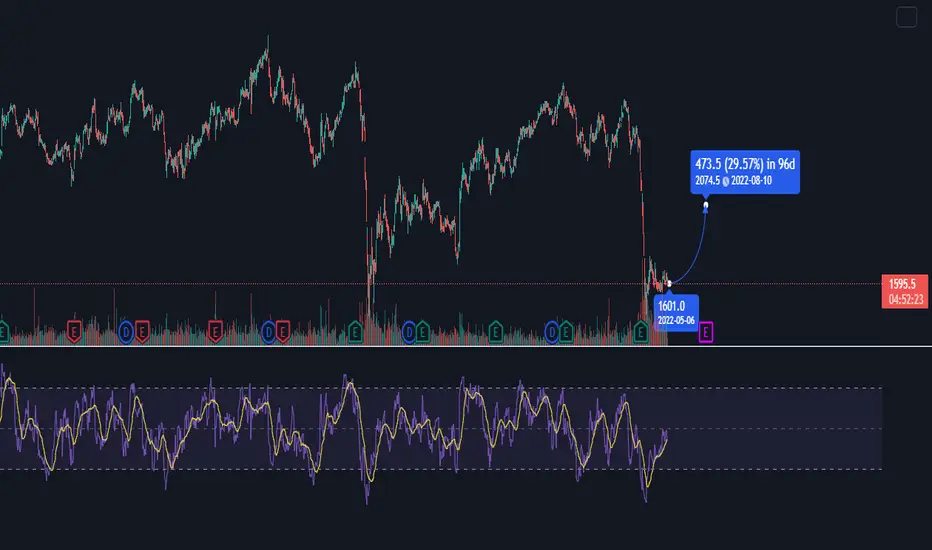
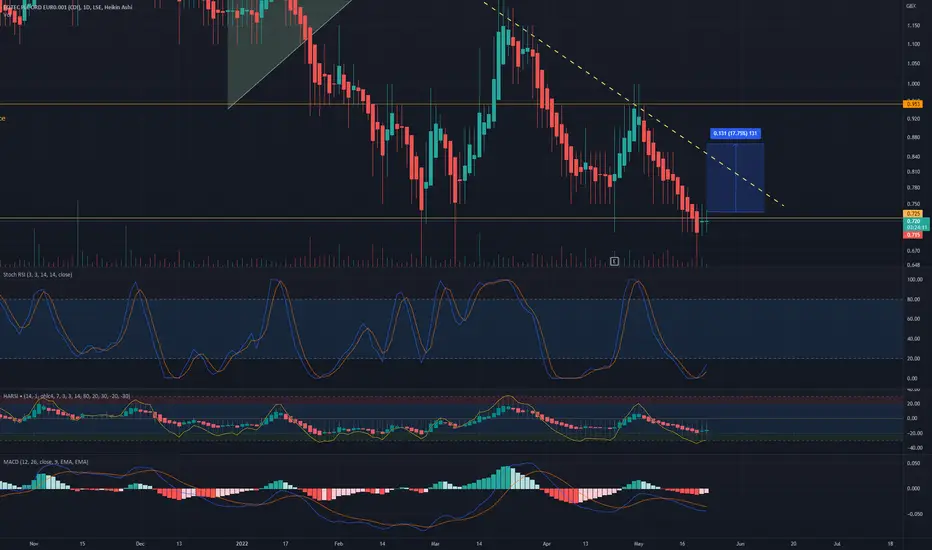
Centrica go down optimal go on short for 2 botomCentrica go down optimal go on short for 2 botom. What you men?

Anglo Diamonds PLC another diamond company that I follow- for atleast 5 years now-- besides lucara diamonds
just post some charts watching the 15 minute windows--over tomorrow and next week hoping to make some trades- and raise the prices. For their firms and accountants. not to mention the stock owners.

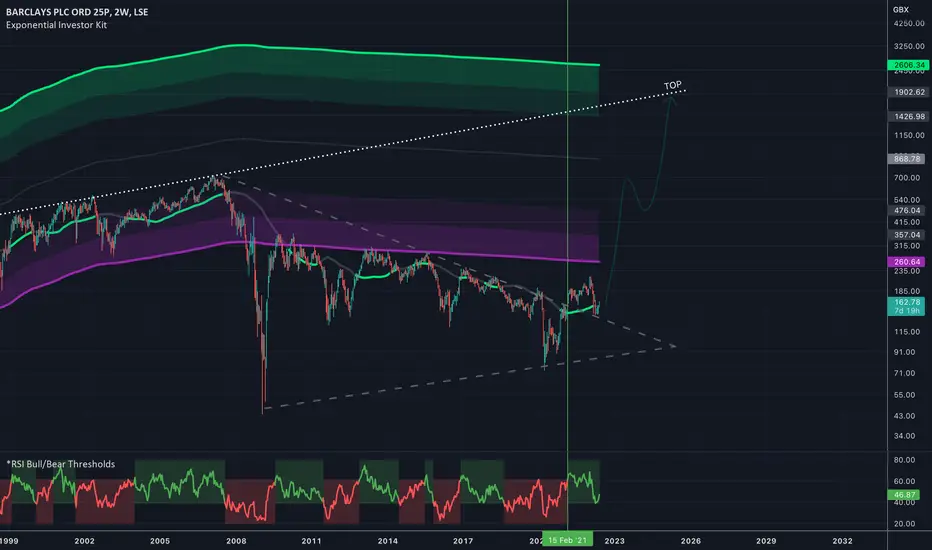
BARCLAYS - Clear As Day - Buy @163p
REASONS TO BE BULLISH
Technical - Recently broke out of a 15 year pennant pattern and just retested for support.
Technical - Recently crossed and reclaimed the 50 MA.
Technical - MA 50 looking like it may cross the 100 and 200 in future months.
Technical - RSI is in the bull zone (bouncing off its base).
Technical - A 155p entry was triggered when reclaimed MA and RSI bull-zone on the same candle. We're now at almost the same level.
Technical - All-time high was back in 2007. This stock hasn't been touched in 15 years and is now winding-up to revisit the top of the upwards slanting trend-line.
Technical - Looks like wave 1 of a 5-wave move is complete/near completion.
Fundamentals - Price to earnings is just 4.7. Barclays is looking like incredible value right now. Net earnings up 275% for the year.
Fundamentals - Dividend yield is ~4% - not to be sniffed at all in this environment - they may even increase this given how profitable banking with current accounts may turn out to be if the BOE base rate continues to increase.
Fundamentals - Implied volatility in the options market is increasing, and it seems like some big players may be eyeing-up Barclays for a big position (likely long but perhaps short).
Fundamentals - Less exposed to the U.K. than some of its counterparts (like Lloyds). With U.S. and India appearing in their Top 4 countries in terms of investment.
Target 1 - First target would be reaching the underside of the purple channel once more at 260p or £2.60. A 60% move off todays prices.
Target 2 - Next profit target would be 750p or £7.50 (a 4.6x move). That could be attainable fairly quickly in the next decade on current trajectory. I don't normally like to post timescales but I am curious to see how this one plays out.
Target 3 - The white top line coincides with the 2.272 and 2.414 fib extension (from Mar20 to Mar22). This generates an ultimate price target of between £10.50 (1050p) and £17.30 (1730p). This matches with the extension from the height of the pennant (top to bottom) also.
REASONS TO BE BEARISH
Technical - Below the purple bear channel and not showing signs yet of being an 'exponential' candidate.
Technical - Stop loss will be 140p at the prior low - representing a 12.5% risk.
Technical - Only recently broke out of the pennant pattern. Could still reverse from here.
Fundamentals - Inflation is not usually too good for growth and banks, with costs increasing as well as profits from interest rates.
Fundamentals - With interest rates increasing you'd anticipate that defaults and leverage will unwind in other economies and wreak havoc. Perhaps Barclays have repaired their balance sheet in the last 15 years or perhaps the UK government will continue to backstop, but current market conditions don't make for pretty reading.
SUMMARY
Buying Barclays here seems like a no-brainer here. Significant dividends in a stagflationary environment cannot be ignored. Neither can we ignore a reasonably priced stock in 2022, as well as a successful backtest of multiple breakouts on our indicators/TA. Time to keep an eye on this one.
SSE - So Simple & Easy - BUY @£1,766REASONS TO BE BULLISH
Technical - Recently broke all-time high from 2007 - 15 yes FIFTEEN years ago!
Technical - Crossed the 50 MA some weeks back and just reclaimed the top of the purple channel. Holding there at support. A great time to reload.
Technical - 50, 100 and 200 MAs all the right way around now, after crossing back in October 2020.
Technical - Back in 2019, we had a double-threshold break. Crossing the 50 MA and entering the RSI bull zone on the same candle - my favourite type of entry. it has already back-tested that move.
Fundamental - Providing a dividend of 4.6% in a stagflationary environment, SSE is not to be sniffed at. 29 years of consistent dividends too!
Fundamental - Furthermore, demand from UK households is not receding from here. Same for sustainable energy & ESG investment.
Fundamental - Price to earnings is reasonable at ~7.6, unlike many other companies on the market.
Fundamental - SSE's standard mix has 55% renewables, with 40% from natural gas. The average UK provider offers 40% renewable, 38% gas and 16% nuclear. They're one of the best in a bad worldwide bunch.
Targets - Initial target would be a 200% move to £3,300. Should the energy really be 'cooking on gas', we may see it reach the £5-10k top channel (in green) after the coming 5 years.
Targets - Any pullback to the 50 EMA is to be bought (~£1,475 and rising).
WHAT COULD BE BEARISH
Fundamental - Sold off on news of a potential windfall tax on oil & gas producers. As of today, I would rate the chances of that passing or affecting SSE as unlikely, despite the political pressure. Even if implemented, it is perhaps more likely to stunt BP and Shell's progress than a "greener" company like SSE.
Fundamental - Businesses like SSE are needed to support households and also shift to a greener future - being one of the biggest investors in green energy in the country. Unless those in charge wish to undo all their promises in recent years, I'd rate the chances of this impacting SSE as low.
Technical - Down nearly 8% for the day and with other more risky assets selling-off, SSE may still stutter (even if downside limited from here).
Technical - Stop loss would be £1,285 which would create a new low and a 27% decline
SUMMARY
Overall, this seems like one of the biggest no-brainer investments out there. Relatively low-risk, relatively high-reward.
Dividend - Check. ESG - Check. Inflation-proof - Check. Value - Check. New ATH - Check.
Absolutely long-term bullish on SSE, although I expect a a few weeks of sideways action to settle on top of the prior all-time high to call it support. Today SSE is a solid purchase and I expect will remain a good time to begin a position, inspite of the market & political risks identified above. Let's keep an eye on this one in the years ahead. Thanks for reading!

IMPERIAL by name & nature - BUYREASONS TO BE BULLISH
Price just reclaimed the 50 MA and is hovering right at the 100 also (£1,817).
RSI on the 2 week chart recently turned bullish, coinciding with reclaiming the 50 MA.
Trend line + MA cross = Bullish Entry. These are my favourite trades when the two signals cross the threshold on the same candle. Double confirmation.
Further upside will see both cross above the 200 MA (the top of the purple channel at £2,575), which will further cement its place in a bull market.
Imperial Brands are currently paying out a 7.8% dividend yield. Fundamentally, investors wire going tol flock to dividend paying stocks en masse.
They have a price to earnings ratio of 7.27 which is very low by market standards. UK FTSE is trading at
The stress of a downturn in market, trade & geopolitical conditions is likely to increase people's dependency on the products they produce.
UK stock market is not over-leveraged, particularly not in value stocks like IMB.
Has already endured a 6 year bear-market.
Initial profit target is at £4.2k-£4.7k (the mid-point), which also coincides with it's prior all-time high. Here it will likely take a breather and form a cup and handle for a year or two (like April 2012 to April 2014).
Has the potential to approach the top of the channel at £7k to £14k in the decade ahead.
REASONS TO BE BEARISH
Across many other assets, I am seeing potential capitulation in stocks going into June/July this year.
It could retrace 10-20% along with more risky assets, but I suspect it will hold it's own for years to come.
Stop would be at £338 - which would represent a 33% loss. That would put-in a new lower low and likely lead to more downside and a negated bull-run.
SUMMARY
In times of market conditions and the stagflation that we find ourselves subjected to, IMB is a solid buy and a great risk-reward entry here. Despite it's low expected volatility, it will likely provide a decent dividend and return on investment. IMB has a chance of keeping-up and in fact exceeding inflation. That is not to be sniffed-at, with the meme stocks facing their day of reckoning. We'll keep an eye on this one, as this indicator has provided 2 entries at £1,671 and £1,770 recently. Enjoy and thanks for reading!

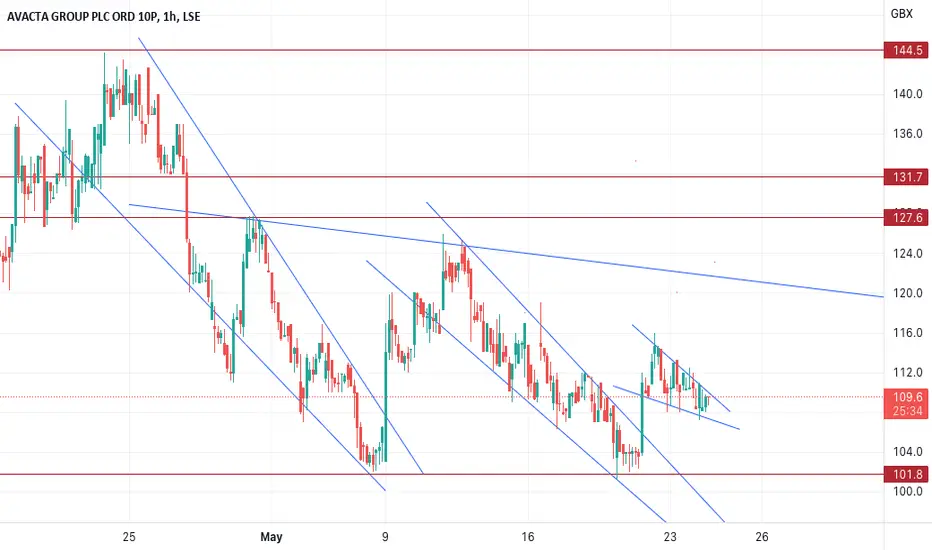
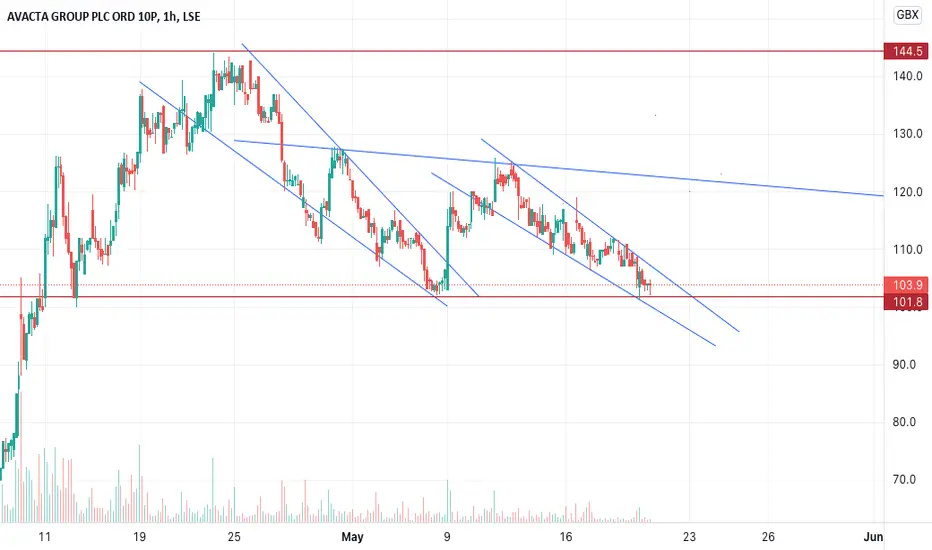
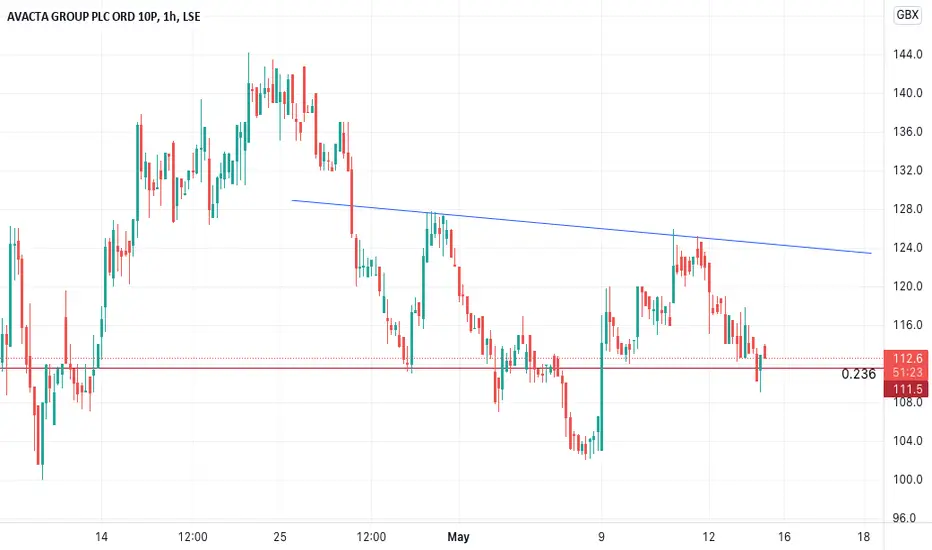
Update on AVACTAHeres a little update on AVACTA. Falling descending wedges breaking out, and then the formation of a mini bull flag. Might see a pop to 121 today but maybe even further.
Good luck everyone!
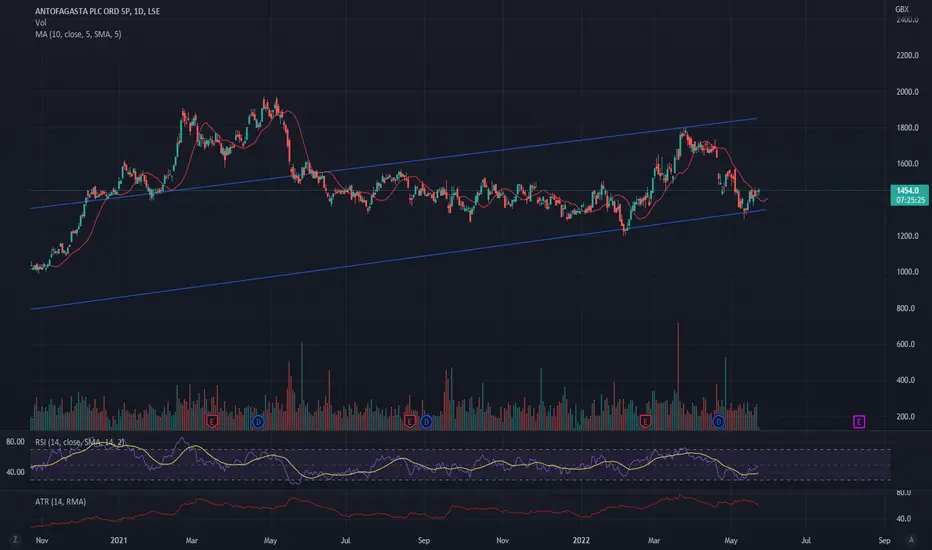
ANTO Long Tunnel IdeaANTO is in an uptrend in both weekly and monthly time frames. It has held its structure through the recent market volatility and is in a strong sector.
It has just bounced off the lower trend line and come from an oversold position.
I have taken a small position and am aiming for the top trendline on the chart over the coming days/weeks.
EQTEC Bounce by 20%I am expecting a bounce of approximately 20% from current resistance level. Let's see how it plays out
Long LSE Down to 76 fib. Up off 76 fib. I buy 61 fib retests. Another bread and butter style trade. Stop under 76 because if we get there it's not working.

runprofits linkgeneric chart setup to link from RPG
allows linking from pops and drops to a chart from a Power Bi dat set
just a way to visualise the data and id trends anlaysed using data mining and technical quant scores
AVACTA updateWhat AVACTA is looking like. Im hoping for a move to the neckline of that inverse head and shoulders, some consolidation here and then a break through with a fair target of 140p.
Waiting for monday openWaiting for monday open.
Simply staring at this chart and waiting for LSE open monday morning. Thank god its not a bank holiday otherwise the wait would be longer hah
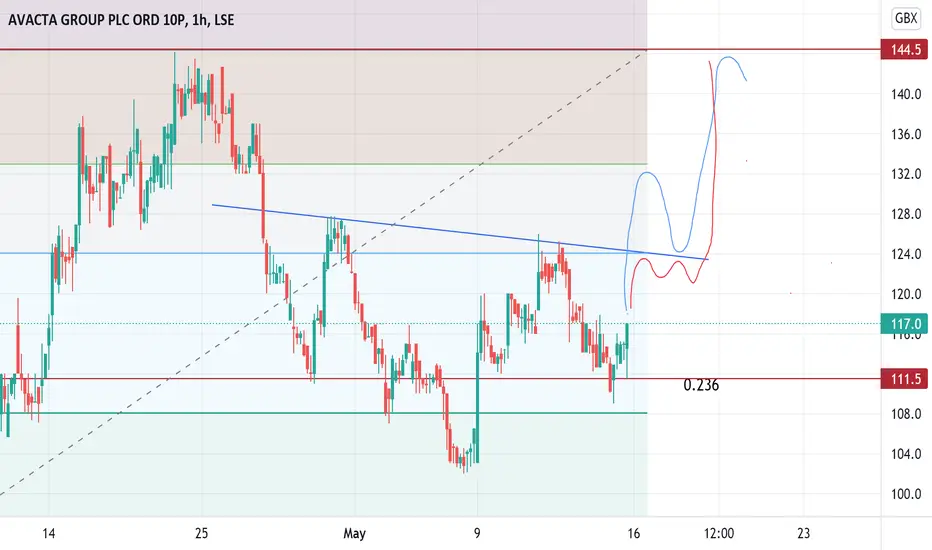
AVACTA ih&sAVACTA forming a nice inverse head and shoulders pattern on the 1hour.
Formed during the correction. We have made a lower high and the candle patterns are giving us confirmation. Also confluence of the fib level.
Looks promising.
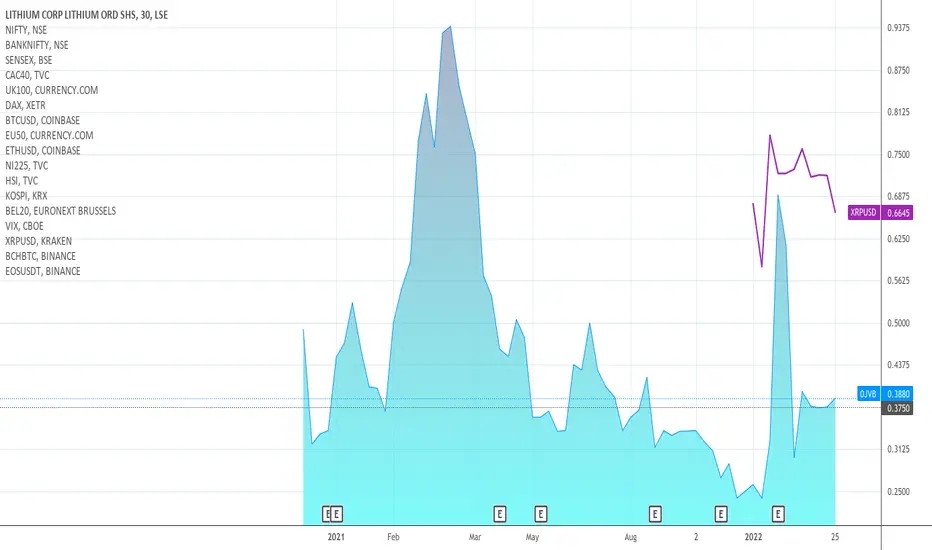
Lithenium Commodity UKSun Storm Investment Trading Desk & NexGen Wealth Management Service Present's: SSITD & NexGen Portfolio of the Week Series
Focus: Worldwide
By Sun Storm Investment Research & NexGen Wealth Management Service
A Profit & Solutions Strategy & Research
Trading | Investment | Stocks | ETF | Mutual Funds | Crypto | Bonds | Options | Dividend | Futures |
USA | Canada | UK | Germany | France | Italy | Rest of Europe | Mexico | India
Disclaimer: Sun Storm Investment and NexGen are not registered financial advisors, so please do your own research before trading & investing anything. This is information is for only research purposes not for actual trading & investing decision.
#debadipb #profitsolutions
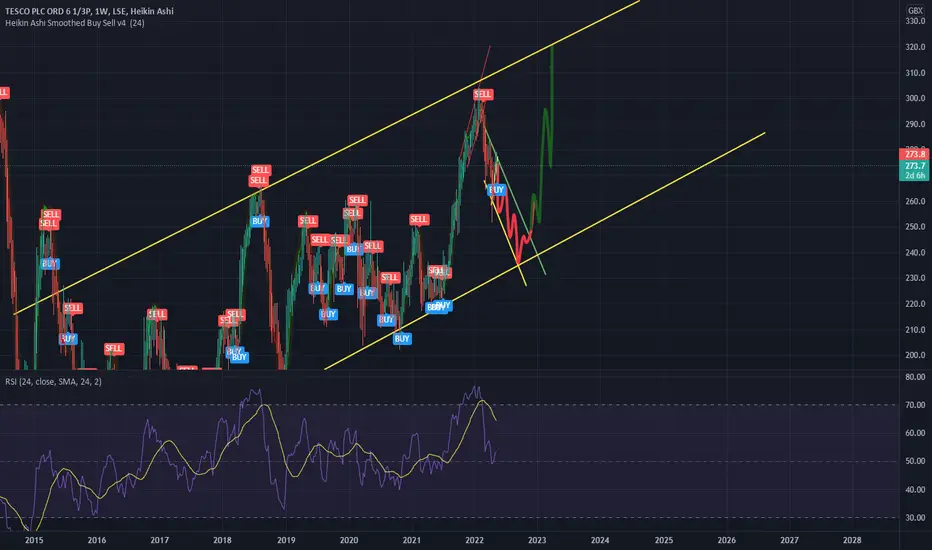
Tesco's Cycles...Tescos has been quite overly strong on the RSI for a goo while, but this smaller cycle should hit 243 and go back up. A good buying point!
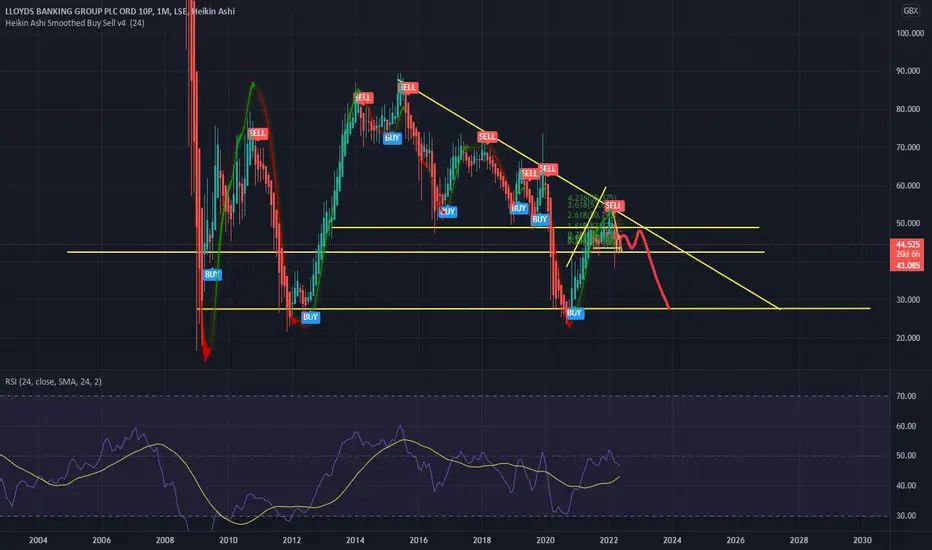
A bear prediction for LLoyds?With the economic predictions ahead, I can only see one thing happening! It's been stuck in this trend since 2012!
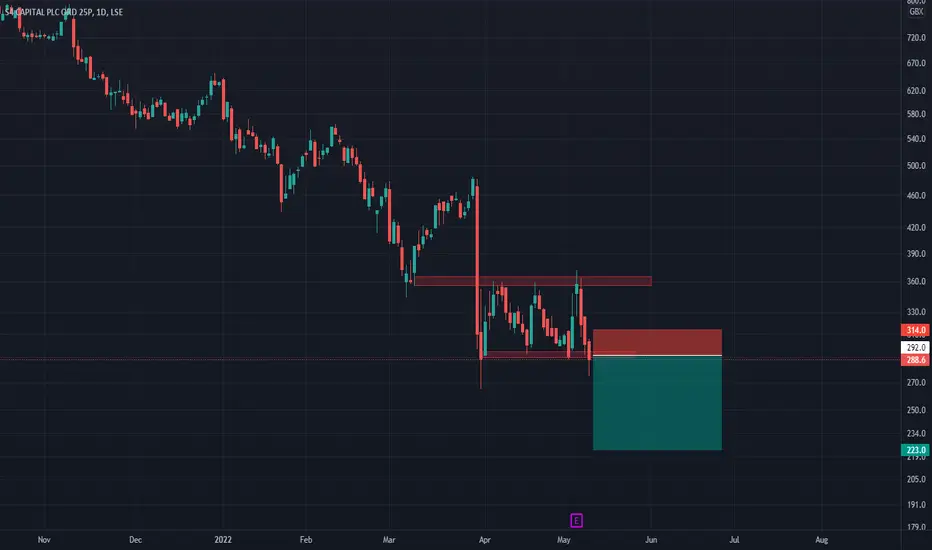
S4 heading 4 lower prices? S4 Capital
Short Term - We look to Sell at 292 (stop at 314)
We look to sell rallies. Broken out of the channel formation to the downside. The medium term bias remains bearish. There is scope for mild buying at the open but gains should be limited.
Our profit targets will be 223 and 210
Resistance: 290 / 350 / 500
Support: 250 / 200 / 150
Disclaimer – Saxo Bank Group. Please be reminded – you alone are responsible for your trading – both gains and losses. There is a very high degree of risk involved in trading. The technical analysis, like any and all indicators, strategies, columns, articles and other features accessible on/though this site (including those from Signal Centre) are for informational purposes only and should not be construed as investment advice by you. Such technical analysis are believed to be obtained from sources believed to be reliable, but not warrant their respective completeness or accuracy, or warrant any results from the use of the information. Your use of the technical analysis, as would also your use of any and all mentioned indicators, strategies, columns, articles and all other features, is entirely at your own risk and it is your sole responsibility to evaluate the accuracy, completeness and usefulness (including suitability) of the information. You should assess the risk of any trade with your financial adviser and make your own independent decision(s) regarding any tradable products which may be the subject matter of the technical analysis or any of the said indicators, strategies, columns, articles and all other features.
Please also be reminded that if despite the above, any of the said technical analysis (or any of the said indicators, strategies, columns, articles and other features accessible on/through this site) is found to be advisory or a recommendation; and not merely informational in nature, the same is in any event provided with the intention of being for general circulation and availability only. As such it is not intended to and does not form part of any offer or recommendation directed at you specifically, or have any regard to the investment objectives, financial situation or needs of yourself or any other specific person. Before committing to a trade or investment therefore, please seek advice from a financial or other professional adviser regarding the suitability of the product for you and (where available) read the relevant product offer/description documents, including the risk disclosures. If you do not wish to seek such financial advice, please still exercise your mind and consider carefully whether the product is suitable for you because you alone remain responsible for your trading – both gains and losses.
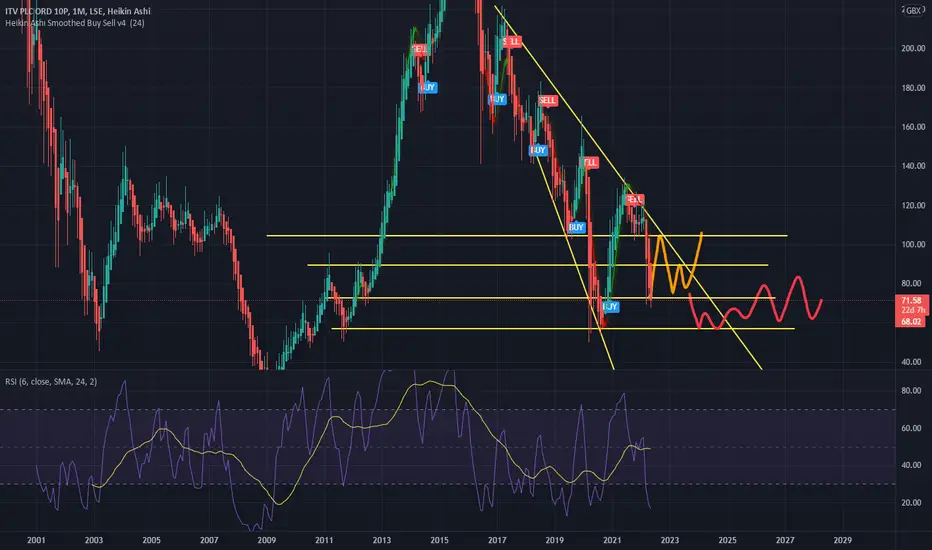
ITV... Where now for the SP?I think a drop to the lower yellow line is unlikely, but who really knows, the short positions are rising!
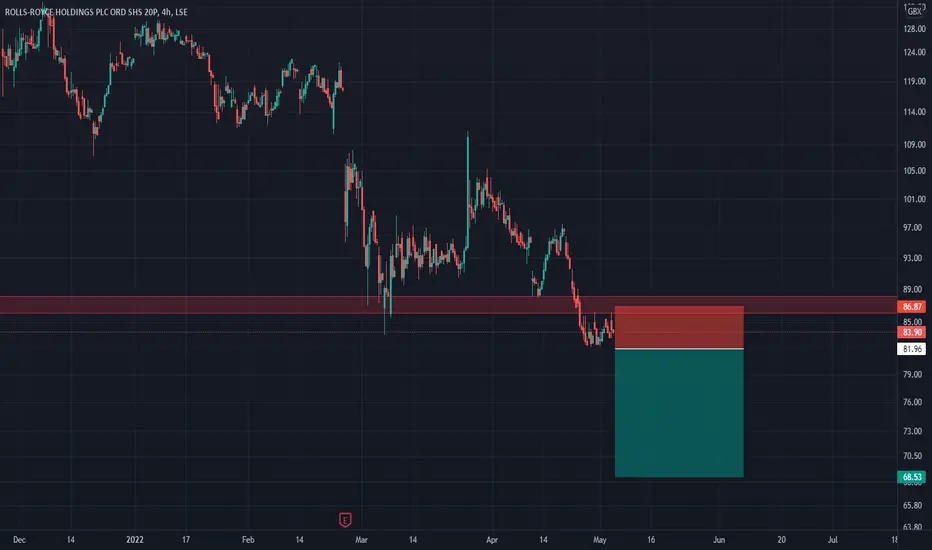
Rolls Royce: driving to further losses?Rolls Royce
Short Term - We look to Sell a break of 81.96 (stop at 86.87)
Bias is mildly bearish today but we need to see a break of 81.96 to confirm the downward pressure. The medium term bias remains bearish. The bias is still for lower levels and we look for any gains to be limited. We look for losses to be extended today.
Our profit targets will be 68.53 and 61.30
Resistance: 86.00 / 100.00 / 110.00
Support: 82.00 / 70.00 / 50.00
Disclaimer – Saxo Bank Group. Please be reminded – you alone are responsible for your trading – both gains and losses. There is a very high degree of risk involved in trading. The technical analysis, like any and all indicators, strategies, columns, articles and other features accessible on/though this site (including those from Signal Centre) are for informational purposes only and should not be construed as investment advice by you. Such technical analysis are believed to be obtained from sources believed to be reliable, but not warrant their respective completeness or accuracy, or warrant any results from the use of the information. Your use of the technical analysis, as would also your use of any and all mentioned indicators, strategies, columns, articles and all other features, is entirely at your own risk and it is your sole responsibility to evaluate the accuracy, completeness and usefulness (including suitability) of the information. You should assess the risk of any trade with your financial adviser and make your own independent decision(s) regarding any tradable products which may be the subject matter of the technical analysis or any of the said indicators, strategies, columns, articles and all other features.
Please also be reminded that if despite the above, any of the said technical analysis (or any of the said indicators, strategies, columns, articles and other features accessible on/through this site) is found to be advisory or a recommendation; and not merely informational in nature, the same is in any event provided with the intention of being for general circulation and availability only. As such it is not intended to and does not form part of any offer or recommendation directed at you specifically, or have any regard to the investment objectives, financial situation or needs of yourself or any other specific person. Before committing to a trade or investment therefore, please seek advice from a financial or other professional adviser regarding the suitability of the product for you and (where available) read the relevant product offer/description documents, including the risk disclosures. If you do not wish to seek such financial advice, please still exercise your mind and consider carefully whether the product is suitable for you because you alone remain responsible for your trading – both gains and losses.
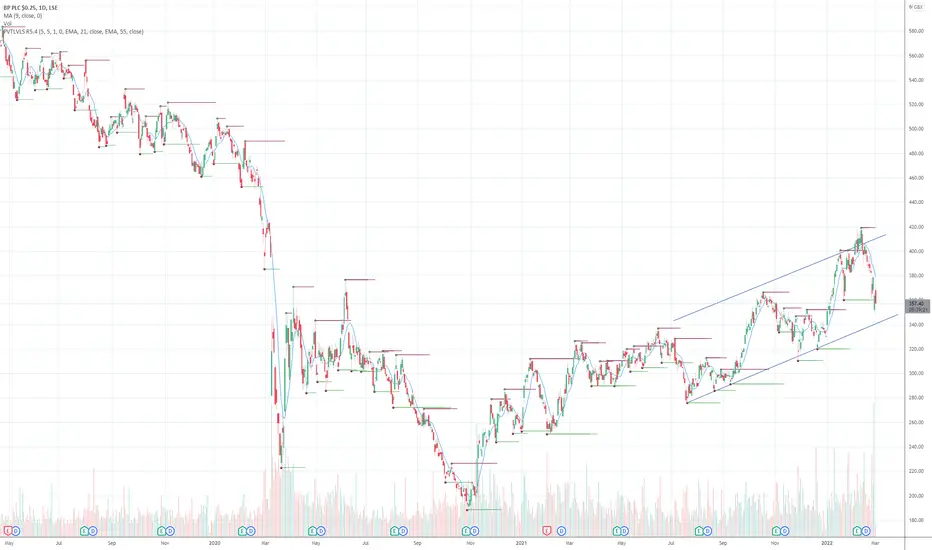
BP longBP: This is approaching the bottom of the channel. It's a good risk-reward trade. A buy-in my opinion
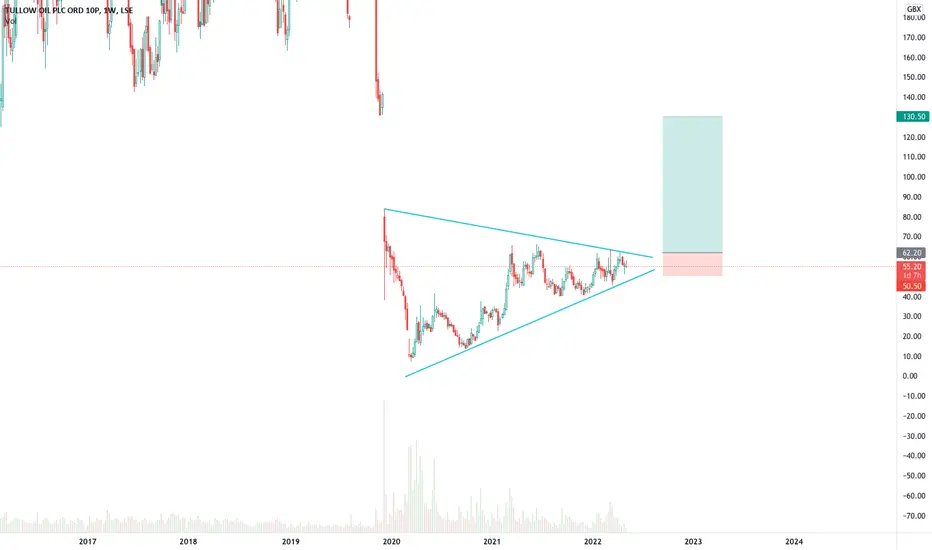
Tullow Oil (FTSE) - make or break?The weekly chart has formed a symmetrical triangle and is approaching the moment of truth. I think a long could be worth contemplating with a massive gap fill in mind dating back to the end of 2019. With Russian oil being phased out, the R/R could be worth a managed trade.
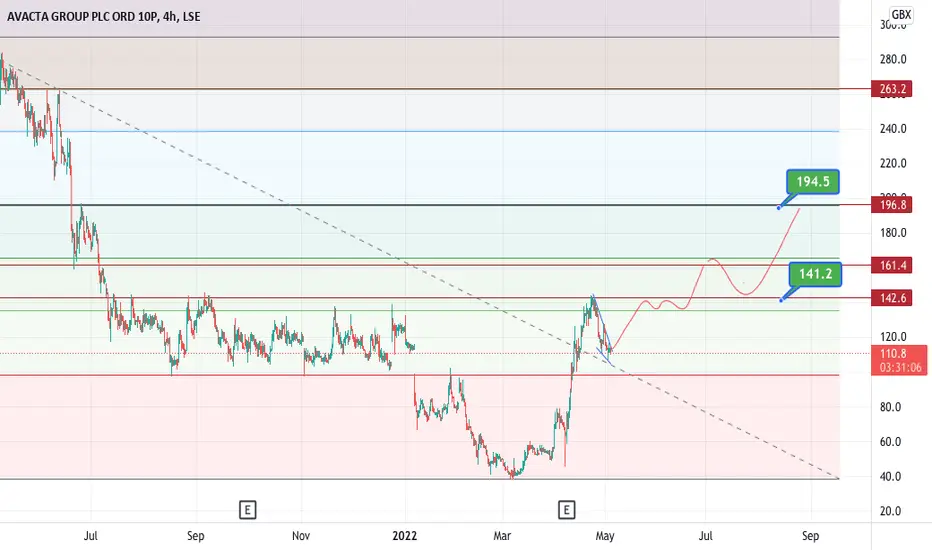
A plan for AVACTAAvacta has had a rally up. It has formed a falling wedge / bull flag which could serve as a continuation pattern.
First target could reasonably be the top or start of the falling wedge ~141p.
Targets after that we are looking at the fib retracement of the previous macro down trend and/or the previous price action (there is some confluence between the two).
Good Long OpportunityDefensive stocks in the world have so far outperformed the market. This one however hasn't due to the situation in Ukraine. What changed is that Earnings were posted as expected after all, and analysts are upgrading.