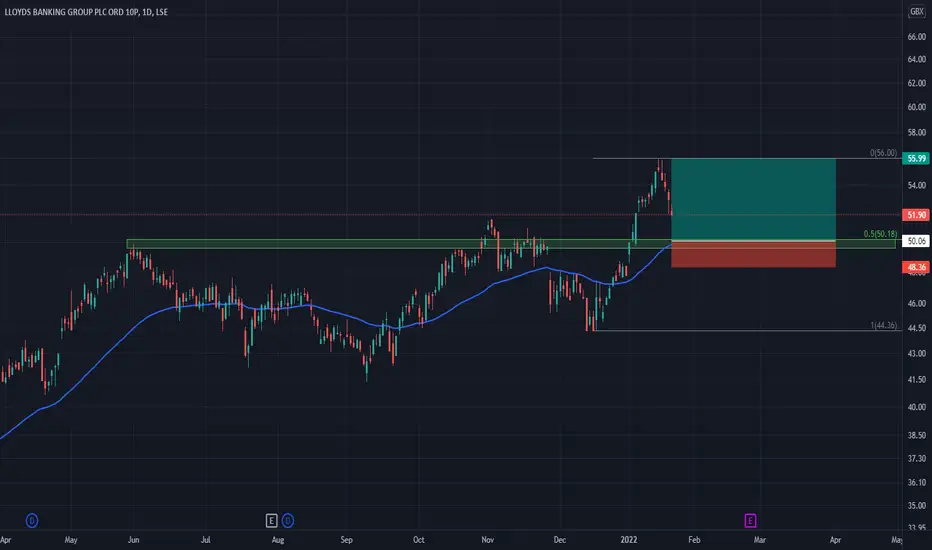
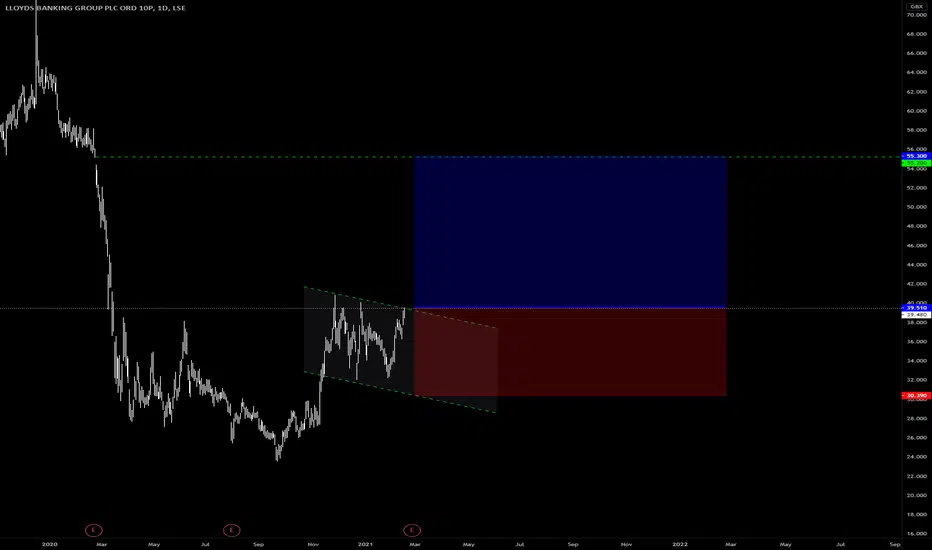
Lloyds Bank: Buying the DipLloyds Bank - Short Term - We look to Buy at 50.06 (stop at 48.36)
Preferred trade is to buy on dips. Previous resistance, now becomes support at 50.00. 50 1day EMA is at 49.80. The 50% Fibonacci retracement is located at 50.18 from 44.36 to 56.00. This move is expected to continue and we look to set longs at good risk/reward levels.
Our profit targets will be 55.99 and 57.95
Resistance: 56.00 / 60.00 / 65.00
Support: 50.00 / 47.50 / 45.00
Disclaimer – Saxo Bank Group. Please be reminded – you alone are responsible for your trading – both gains and losses. There is a very high degree of risk involved in trading. The technical analysis, like any and all indicators, strategies, columns, articles and other features accessible on/though this site (including those from Signal Centre) are for informational purposes only and should not be construed as investment advice by you. Such technical analysis are believed to be obtained from sources believed to be reliable, but not warrant their respective completeness or accuracy, or warrant any results from the use of the information. Your use of the technical analysis, as would also your use of any and all mentioned indicators, strategies, columns, articles and all other features, is entirely at your own risk and it is your sole responsibility to evaluate the accuracy, completeness and usefulness (including suitability) of the information. You should assess the risk of any trade with your financial adviser and make your own independent decision(s) regarding any tradable products which may be the subject matter of the technical analysis or any of the said indicators, strategies, columns, articles and all other features.
Please also be reminded that if despite the above, any of the said technical analysis (or any of the said indicators, strategies, columns, articles and other features accessible on/through this site) is found to be advisory or a recommendation; and not merely informational in nature, the same is in any event provided with the intention of being for general circulation and availability only. As such it is not intended to and does not form part of any offer or recommendation directed at you specifically, or have any regard to the investment objectives, financial situation or needs of yourself or any other specific person. Before committing to a trade or investment therefore, please seek advice from a financial or other professional adviser regarding the suitability of the product for you and (where available) read the relevant product offer/description documents, including the risk disclosures. If you do not wish to seek such financial advice, please still exercise your mind and consider carefully whether the product is suitable for you because you alone remain responsible for your trading – both gains and losses.
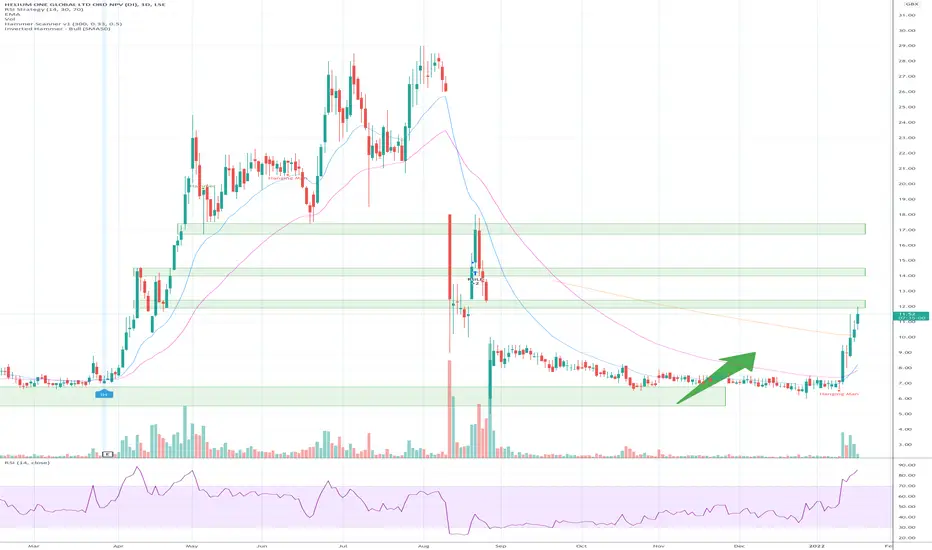
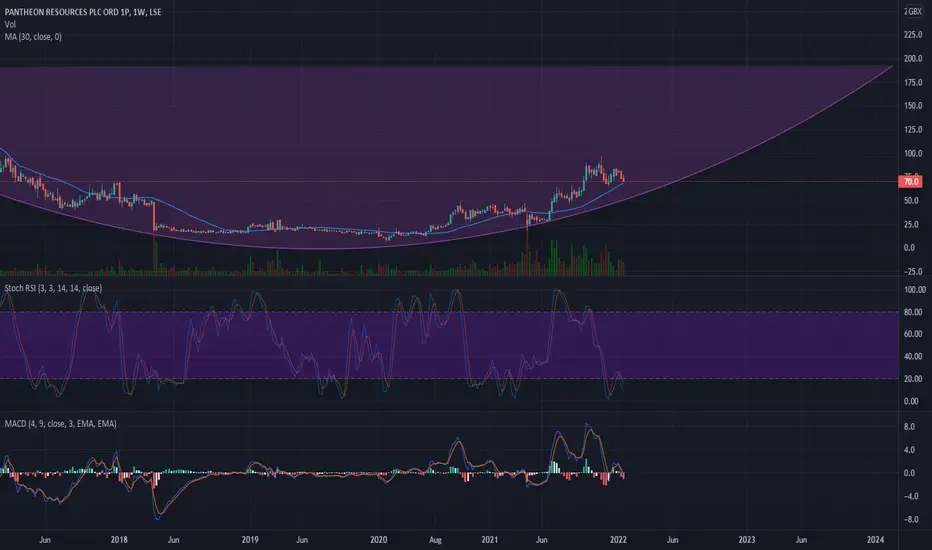
#HE1 - Long term hold#HE1 - worth a re-tweet
Helium is all part of the shift to net zero... it may stutter in coming months with inflation and rate hikes, but if you were in back in Nov, stay in for long term hold.
Remember to take some profits at these levels
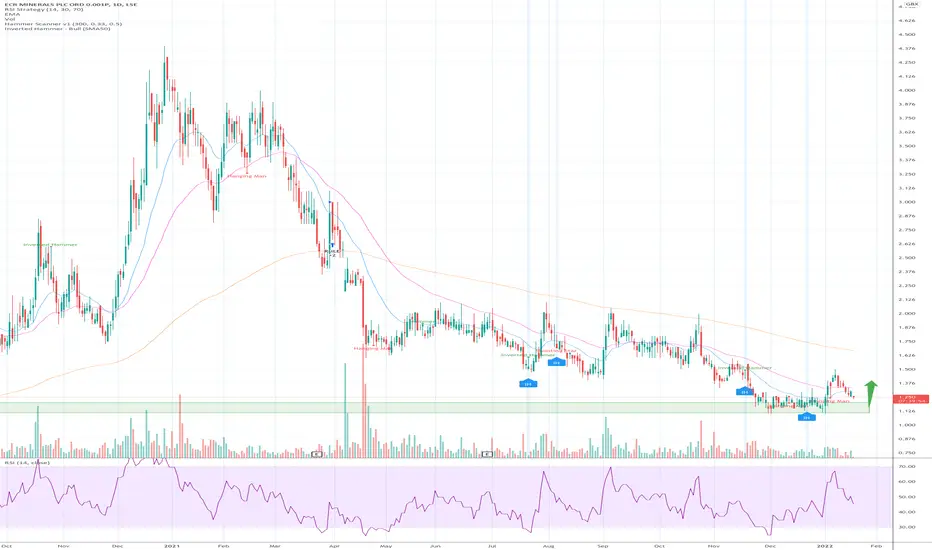
#ECR #ecrminerals - Entering area sig area of support againEntering area sig area of support again awaiting:
- Announcement of new CEO
- Drilling commencing at Creswick and other sites
News imminent, once it breaks, get ready for 2p+
Any thoughts on opening a position now ?The 2 DEMA'S are above signal line
RVI is above signal line
MACD is above signal line and histogram is greater than 0
I'm a beginner so not sure if downtrend is over yet? Any thoughts?
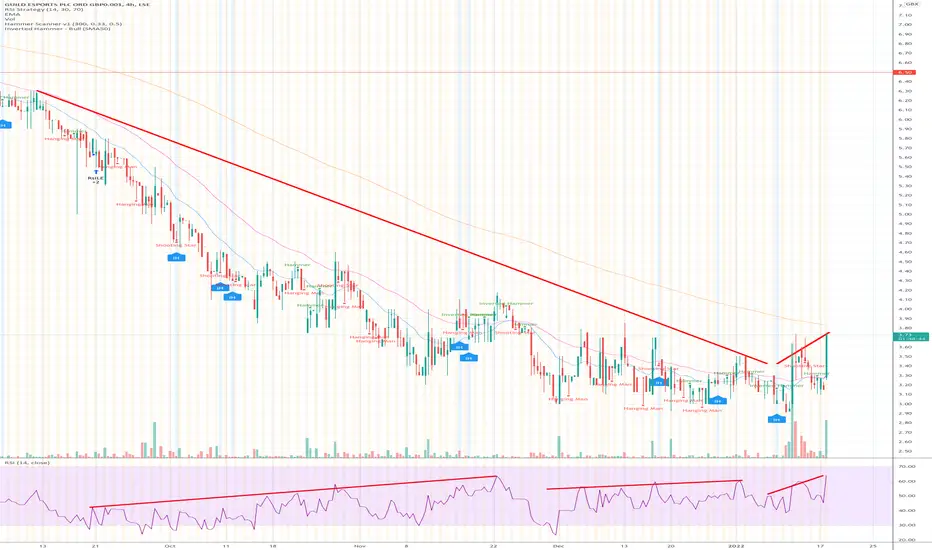
#GILD - Momentum finally beginning to follow price swingWith strong support seemingly found around 3p mark... great sponsor announced, #bitstamp... we will now see this climb back up towards 8p+. Will need a steady stream of positive sponsor and content news to ensure this steady growth to where it belongs... stay strong, hold onto this stock, it will fly when ready.
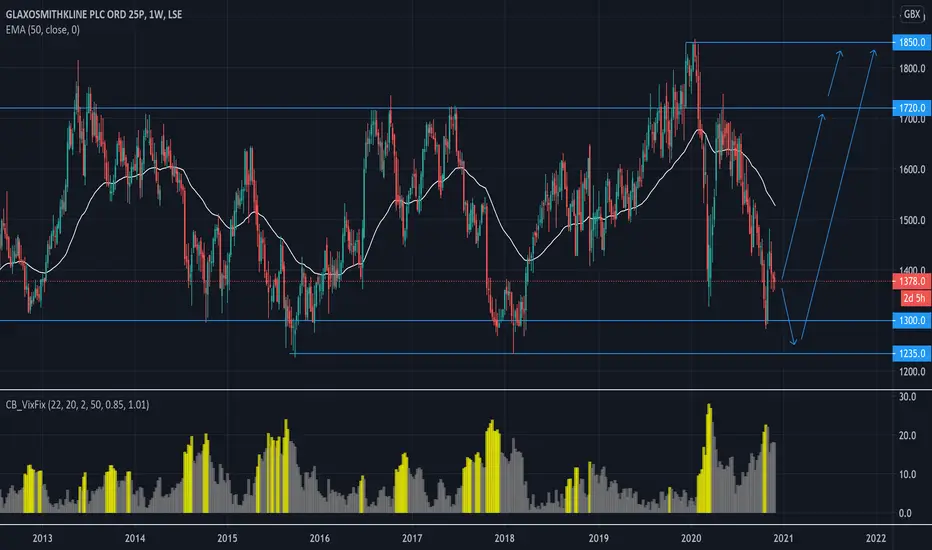
GSK Glaxo Smith Kline - Multi Year Lows, A Bargain To Be Bought?GSK is trading around the multi year lows having bounced off of the long term support zone at 1300. I think this is a relative bargain at these levels with GSK being one of the Big Pharma Companies that is still trading way below the starting price for the year.
Pfizer, Johnson & Johnson and Roche are all either positive or around net zero YTD. Novartis is trading slightly lower and so is Merck and Co but not to the extent of GSK making it a bargain in the big Pharma world.
Dividend Yield is current around 5.3% which is high enough to warrant it being a good income stock even if the share price was to remain flat for the next 5 years.
Upside targets are at 1720 which is the next major price resistance zone and and 1850 which is the 18 year highs (formed in 2019).
There is a chance that price could fall back down to 1300 or even the multi year lows at 1235 which would make for a real bargain. But even at the current price of 1378.00 I think over the next 5 years this is a good stock to hold.
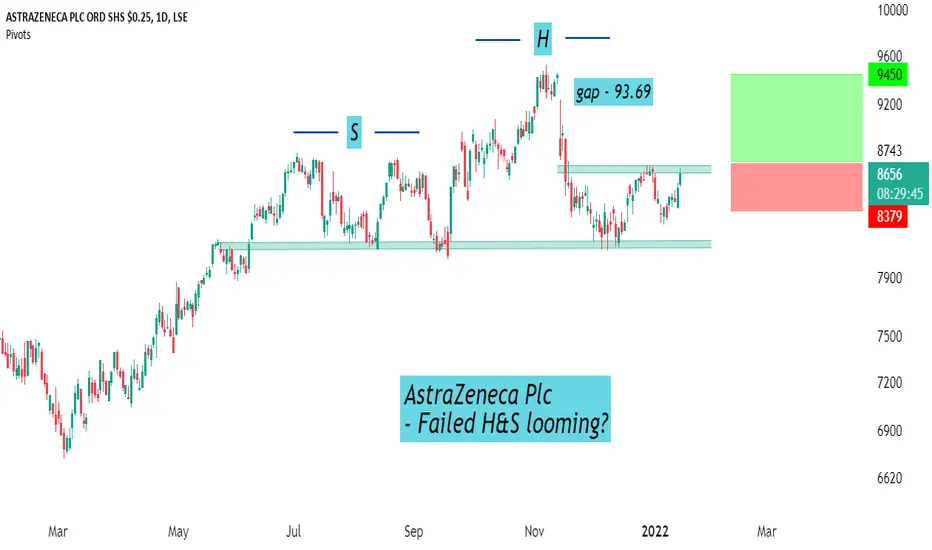
Trade Idea: Buy AstraZeneca Plc Failed head and shoulders have offered great opportunities in recent times.
Idea Buy AstraZeneca Plc on a clearing of the right shoulder.
Now: 86.53
Long +87.30 (right shoulder high zone)
Stop: 83.79
Target: 94.50
For more real-time insights and trade ideas, get in touch today.
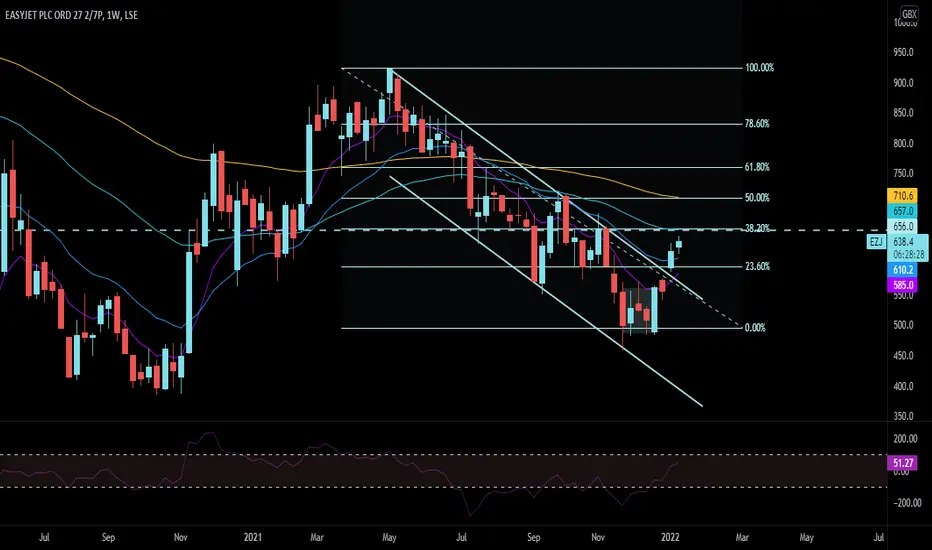
EZJ (Easyjet) - BUYTrade breakdown from a recent trade we took in Dec-21; mark-ups and Wyckoff schematics above.
Cheers!

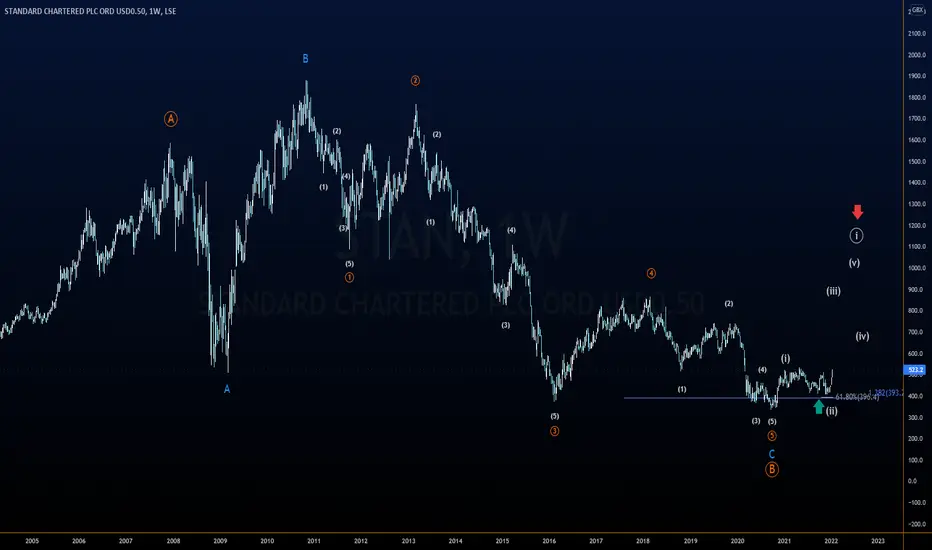
Bullish on $STAN$STAN making higher high and confirming the bullish thesis.
From an EW standpoint, we have a 1-2 of a lower degree likely starting wave C
EasyJet - Probable ReversalA potential reversal on the weekly time frame to be confirmed by a weekly close above 657 resistance that corresponds to the 38.2% Fibonacci retracement level, and the 50 EMA as well.
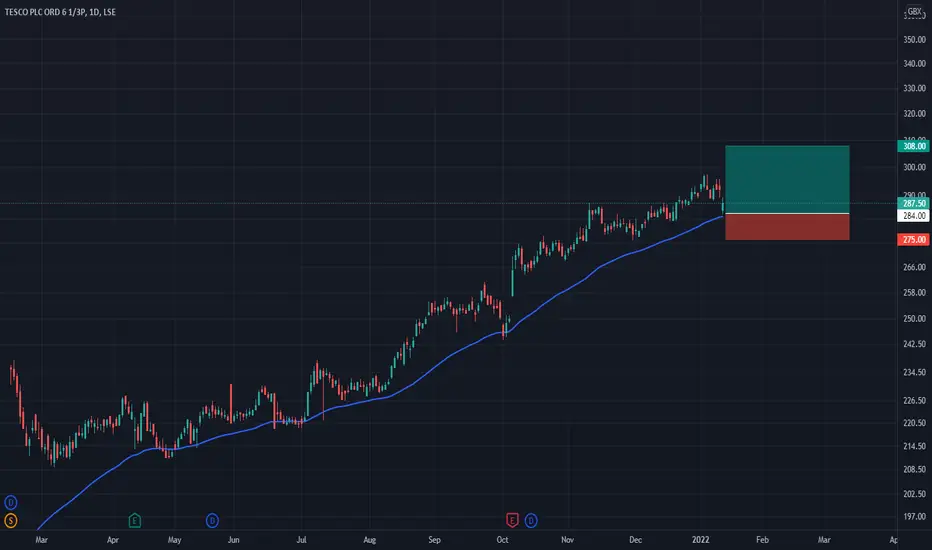
Tesco to Go Higher? Tesco - Short Term - We look to Buy at 284.00 (stop at 275.00)
Preferred trade is to buy on dips. 50 1day EMA is at 282.00. The bias is still for higher levels and we look for any dips to be limited. Daily signals are bullish. Dip buying offers good risk/reward.
Our profit targets will be 308.00 and 320.00
Resistance: 300.00 / 310.00 / 320.00
Support: 280.00 / 275.00 / 270.00
Disclaimer – Saxo Bank Group. Please be reminded – you alone are responsible for your trading – both gains and losses. There is a very high degree of risk involved in trading. The technical analysis, like any and all indicators, strategies, columns, articles and other features accessible on/though this site (including those from Signal Centre) are for informational purposes only and should not be construed as investment advice by you. Such technical analysis are believed to be obtained from sources believed to be reliable, but not warrant their respective completeness or accuracy, or warrant any results from the use of the information. Your use of the technical analysis, as would also your use of any and all mentioned indicators, strategies, columns, articles and all other features, is entirely at your own risk and it is your sole responsibility to evaluate the accuracy, completeness and usefulness (including suitability) of the information. You should assess the risk of any trade with your financial adviser and make your own independent decision(s) regarding any tradable products which may be the subject matter of the technical analysis or any of the said indicators, strategies, columns, articles and all other features.
Please also be reminded that if despite the above, any of the said technical analysis (or any of the said indicators, strategies, columns, articles and other features accessible on/through this site) is found to be advisory or a recommendation; and not merely informational in nature, the same is in any event provided with the intention of being for general circulation and availability only. As such it is not intended to and does not form part of any offer or recommendation directed at you specifically, or have any regard to the investment objectives, financial situation or needs of yourself or any other specific person. Before committing to a trade or investment therefore, please seek advice from a financial or other professional adviser regarding the suitability of the product for you and (where available) read the relevant product offer/description documents, including the risk disclosures. If you do not wish to seek such financial advice, please still exercise your mind and consider carefully whether the product is suitable for you because you alone remain responsible for your trading – both gains and losses.
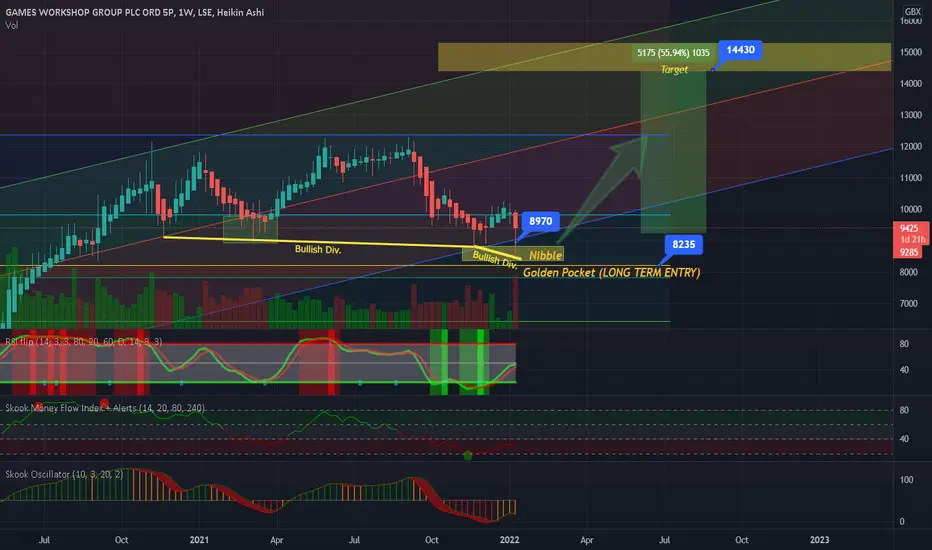
Games Workshop opportunity (LONG)Bullish Divergence across multiple indicators, low money-flow, oversold on macro. Good long-term potential technically and fundamentally.
** NOT TRADING OR FINANCIAL ADVICE**
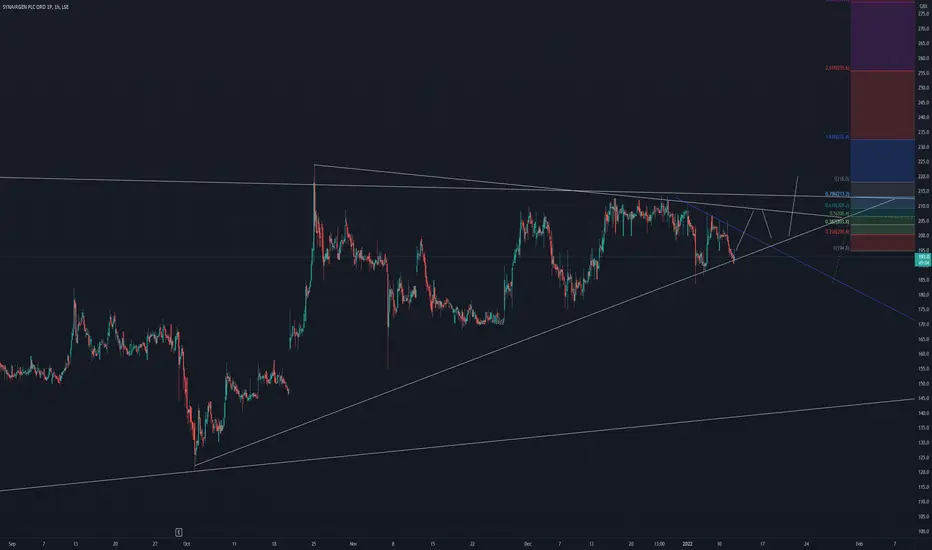
Trying that Synairgen TrendTrying that Synairgen Trend line.
Let's see if this breaks above or below.
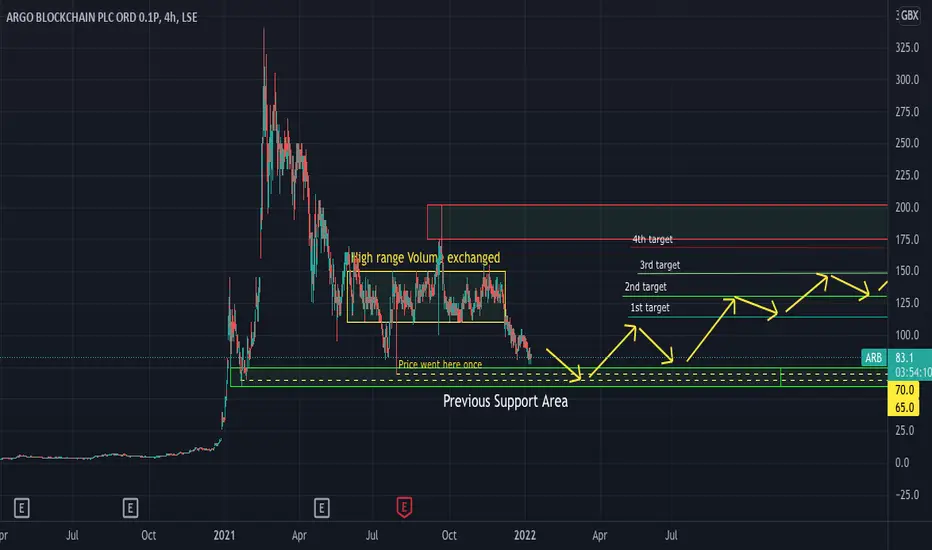
ARB , Argo Blockchain , Lse , Update Hi all I hope you had a great Christmas with your family and here we are back to the charts! =)
I'd like to share my opinion on Argo and give an update to my ideas.
I used here a 4h chart (you can use the weekly and monthly one too) just because I noticed that the share price went down to 70 on the 29th of July and up to 202 on the 22nd of September and with bigger timeframe we cannot see it and this episodes gave me the idea of today.
For more than 6 months the share price has been exchanged between the range (110-150) as per the fixed range volume profile that shows where has been exchanged most. ( as per the yellow triangle)
For this reason I think that the price will definitely come back to the yellow area once find out where is the possible bottom.
It seems that the price is attracted now to the previous support area at 60-75.
I'd wait to open a long position for a swing trade now just because the Cryptomarket and the Stockmarket are both experiencing an uncertain period and I'd wait for confirmations .
If you are IN for long term it's great for some accumulation to average the price down a bit.
( for those that are interested on updates and looking on what Argo is doing , on YouTube Argo Ceo regularly updates videos where He talks about the company and the period in general and answers to questions made by Investors , super interesting check it out)
As per chart to figure out some targets prices I used the Trend-based Fibonacci extension.
Let me know what you think !
Comment are always Welcome.
Cheers.
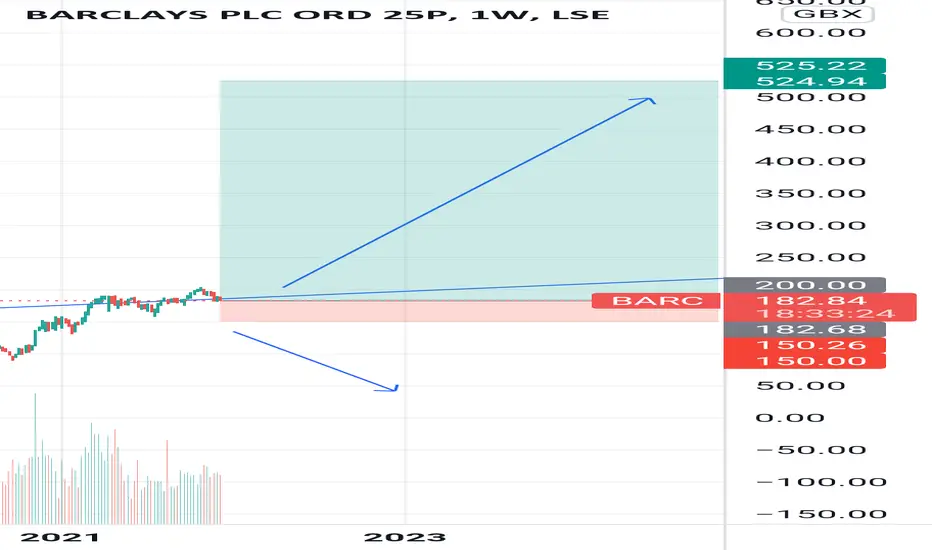
BOOM 💥 Barclays bank after cyper attacks showing some recovery
I would like to buy now , but why don't we wait 200 and buy there some good lot size shares 👈✔✔✔
Enjoy smart money 💰 🤑💸
Follow, share , like 👍
What a start to ’22, financials are the smart play hereWhat a start to ’22, financials are the smart play here, if you were in back in Nov when I last posted, you are up nearly 40%! #HSBC will continue to go from strength to strength in coming weeks
Hedge against inflation and rate hikes
Great fundamentals – ERs coming soon look set for beating proj
Dividends – Ex-date Feb 22nd, payments March – funds all piling in now
#hsba #inflation #valuestocks #lloyds #jpmorgan #boa #goldman

GGP is the it ? all comments welcomeis GGP converging in the mother of all triangles?
not advice but maybe at 13 is breaks out significantly???

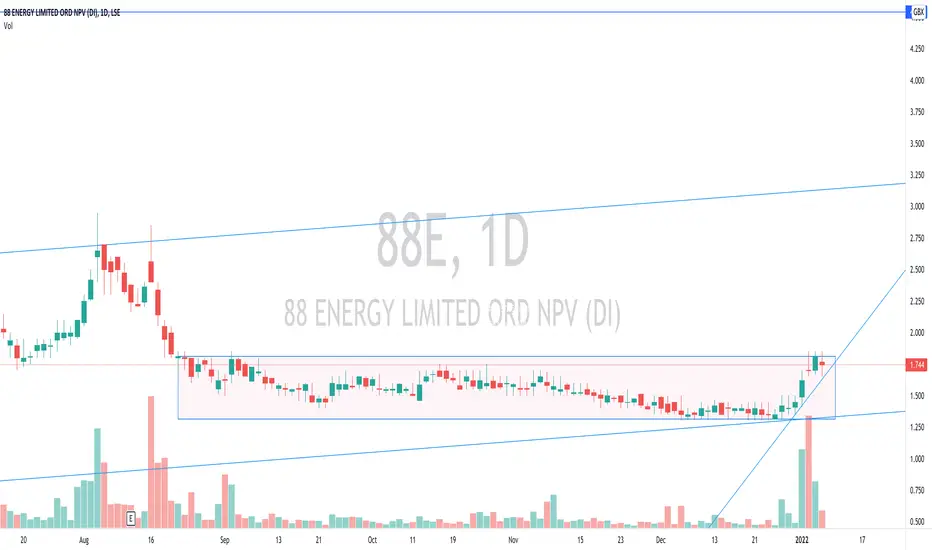
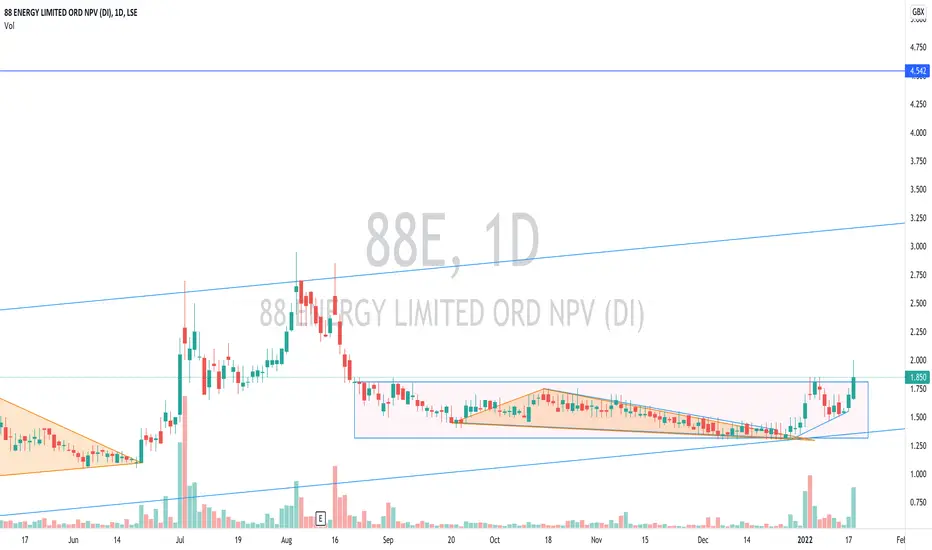
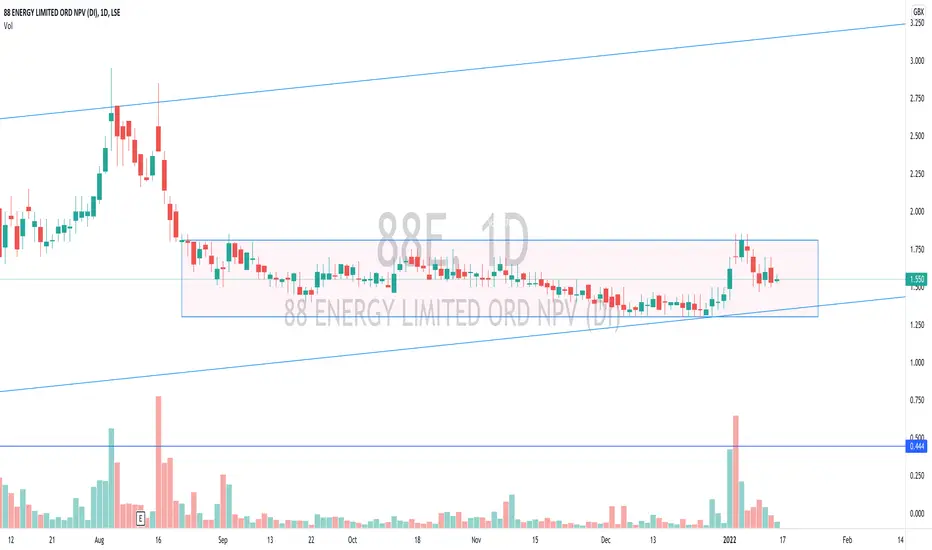
88e bullish but needs to break 1.81 on a closeno advice given looks ready to go to me
breaking consolidation no advice given
plenty of headroom