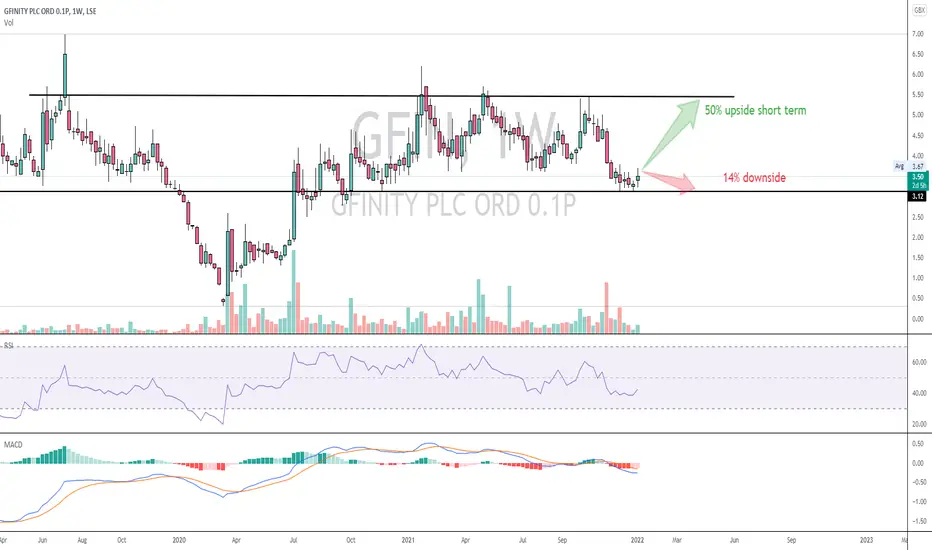
#GFIN #ESPORTS Chart good Reward/Risk ratioPositive trading update anticipated end January. All warrants now exercised which have caused a drag on share price. Revenues surpassing expectations, records being broke for monthly active users. MACD divergence still in play on daily timeframe. Broker target 9.5p and expecting compound annual growth of 43%. Huge upside from here!
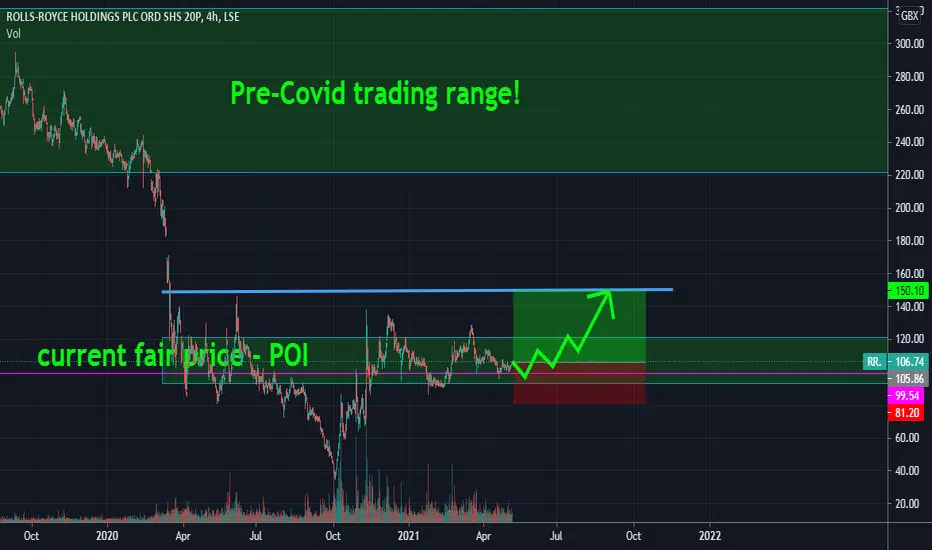
Trading Idea - Rolls-Royce HoldingsBUY
ENTRY: 106.50 GBX*
TARGET: 150 GBX
STOP: 80.30 GBX
*GBX = Pence Sterling
Rolls-Royce specializes in the development, manufacture and marketing of engines for the aviation, marine and energy sectors.
1.) I see a strong support at 90.00 GBX which will resist against further corrections. Probability to go up is higher than to drop below the 90.00 GBX level!
2.) Rolls-Royce is not allowed to sell Bergen Engines to Russia
3.) As expected, the results in 2020 were poor. The company hit by the aviation crisis should have the worst behind it. The cash flow should start to recover from next year.
4.) 2021 will be a year of recovery. The process may last until the end of 2022.
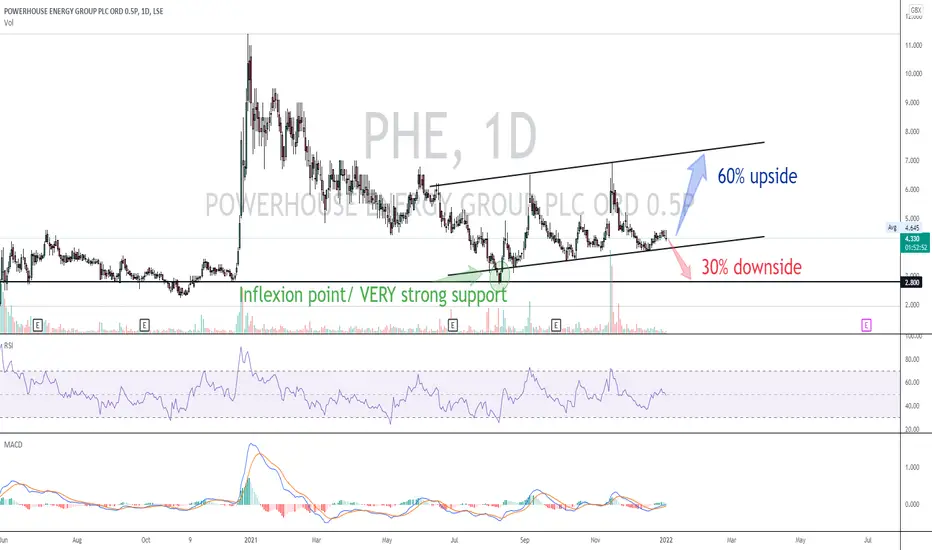
Powerhouse energy Reward to risk ratioThink we will find support at the bottom of the rising trend channel which gives a downside risk of approximately 10% but worse case it could see a 30% downside if price were to drop below this support. Upside in short term is at least 60% meaning this has a minimum RR of 2 to 1 but most likely is a RR of 6 to 1.
News due which could propel SP upward to top of rising trend channel or even beyond includes announcement of new CEO, Financial close of the SPV at Protos, development partners receiving £18m loan from the local fund in Poland, PEEL exercising options for 371m shares giving £10m to PHE. Approval of planning permission for 2nd UK site in Scotland or any announcements from either Asia or Australia where PHE are active.
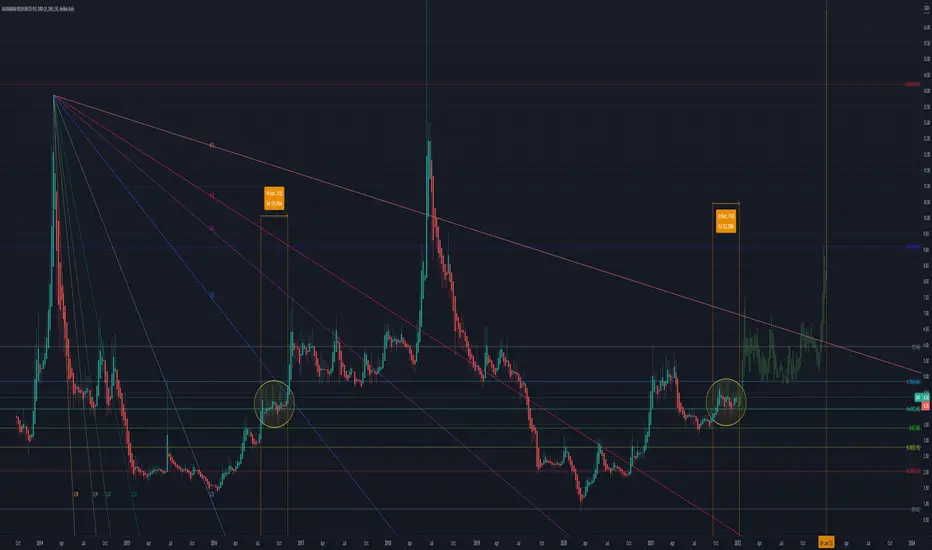
Savannah Longterm LookSav seems to repeating a pattern from July 16th 2016 .
1. Price resistance at 0.786
2. Consolidation above 0.618
If the pattern is playing out then we should get a breakout soon but find resistance at 8/1 Gann. Next major impulsive wave is January 2023. If this impulsive wave does happen January 2023 to the upside targets would range from 9-24.
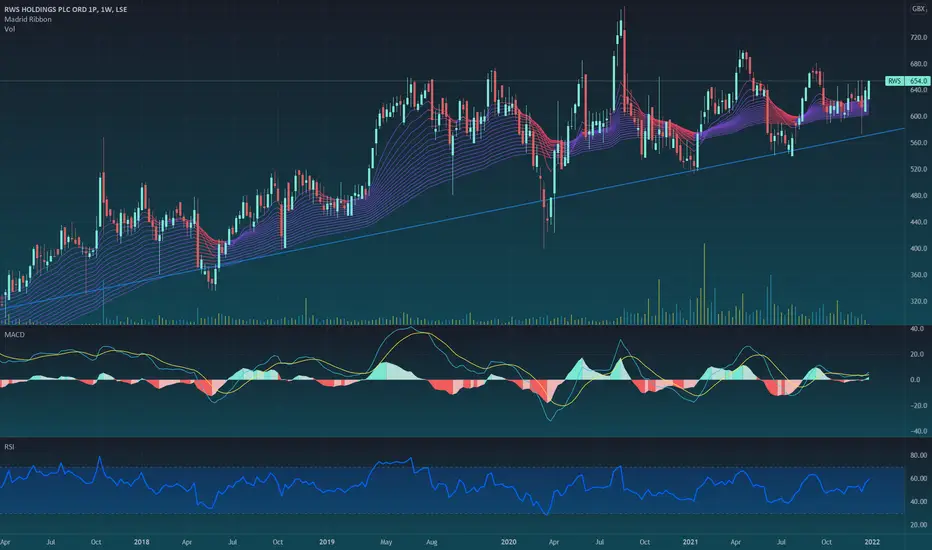
RWS: Weekly uptrend remains stableAlthough RWS can be a volatile stock, we've seen the weekly support level is a strong one to add more positions. We sold SDL after the takeover announcement by RWS and then we bought it when it finished its correction in January 2021. It's a good one for the long-term not only by technical but also fundamentals, as translation software is growing in importance everyday and it has a good dividend yield.
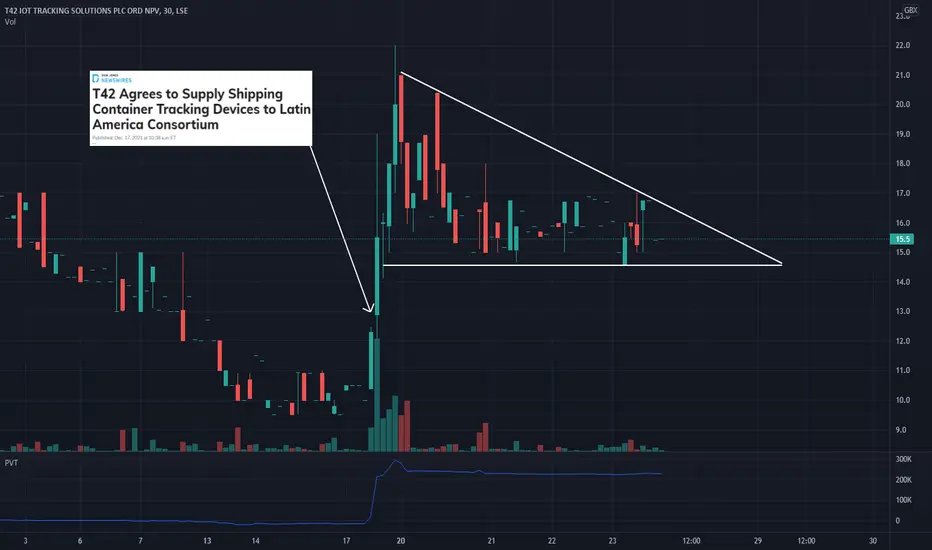
TRAC.L Tracking a Descending Triangt42 (LSE: TRAC) specializes in the development of wireless solutions for remote tracking, monitoring, and protection of assets and people, particularly in the context of the global maritime shipping industry. They executed a reverse split back in November that brought share price from pennystock range to 18GBP, after which the ticker pulled back sharply as it sought to establish a new support, sinking to <10GBP by late November. A huge PR on 12/7 announcing t42's signing of an agreement with a consortium of LatAm shipping entities led to a 100% jump in share price, indicating a serious uptick in bullish sentiment. In the three weeks since, TRAC has assumed a descending triangle pattern as trade volume slows in the holiday season and global indices have expirienced their fair share of volatility over Omicron. I'm optimistic for a bullish breakout here, I think t42 is seriously undervalued and is at the beginning of a new journey. Their recent rebrand, reverse stock split, and now latest deals are all bullish signals in my book.
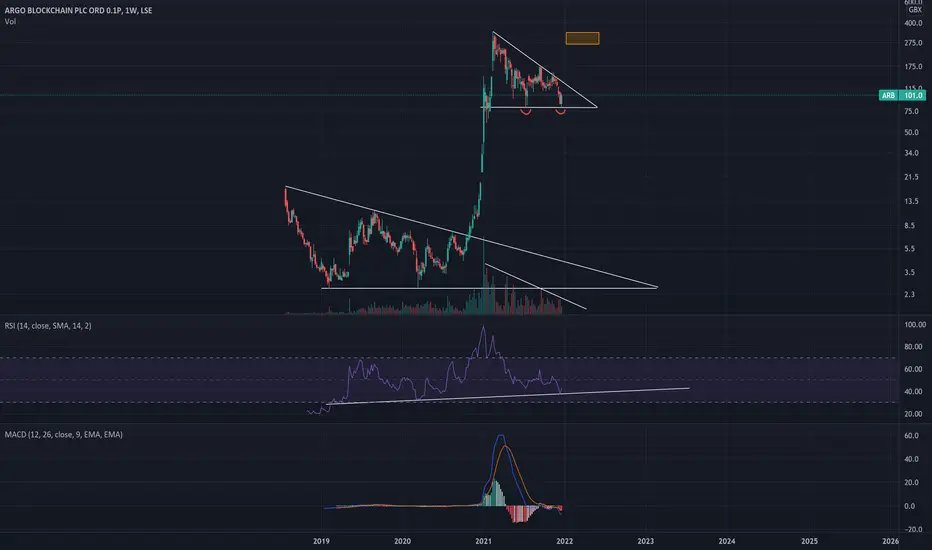
ARGO blockchain rally off of Bitcoins final leg up?- Argo's 5 year RSI support has been hit three times now and has already begun to reverse suggesting a reversal fairly soon.
- There's a double bottom on it as well which suggests a PT of £2.60.
- Furthermore, declining volume suggests a breakout of this triangle is likely to occur soon.
Wishing you all a great Christmas and a successful start to the new year trading.
See you on the moon
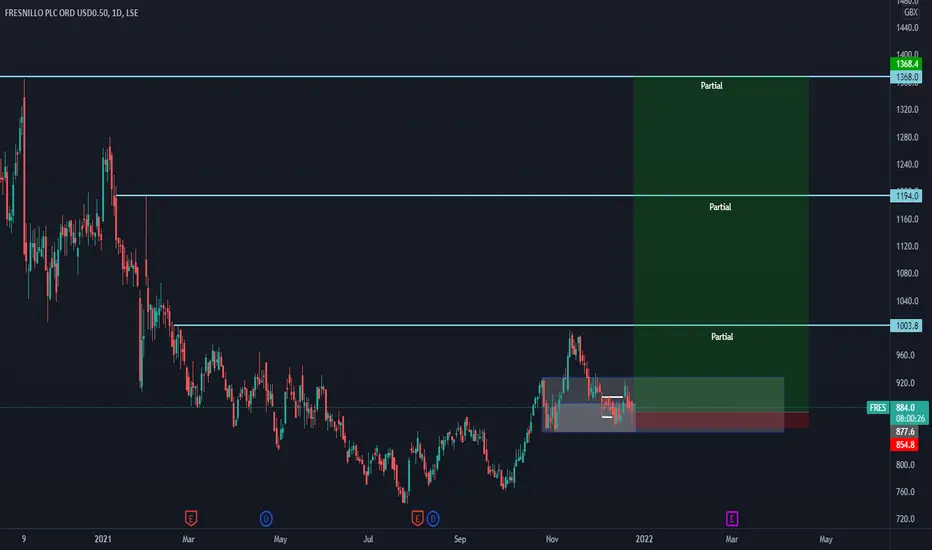
FRESLong term idea
Purely technical
Weekly order block refind down to a daily order block
Wyckoff accumulation condirmed. Wait for a pull back to enter.
Partial out position on way up
*Just an idea I MAY trade - I do not give out any financial advice*
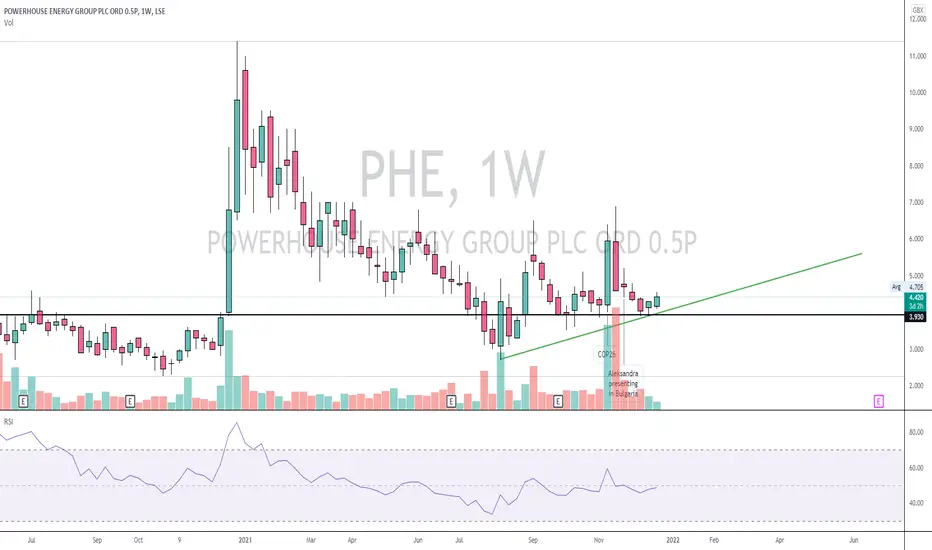
Powerhouse energy weekly chartPHE weekly chart. Big seller has artificially held back the price advance which would have been caused by the LINDE announcement at COP26. Don't think it'll be too long now before we're retesting 12m highs. Lots of news due. Energy from waste.
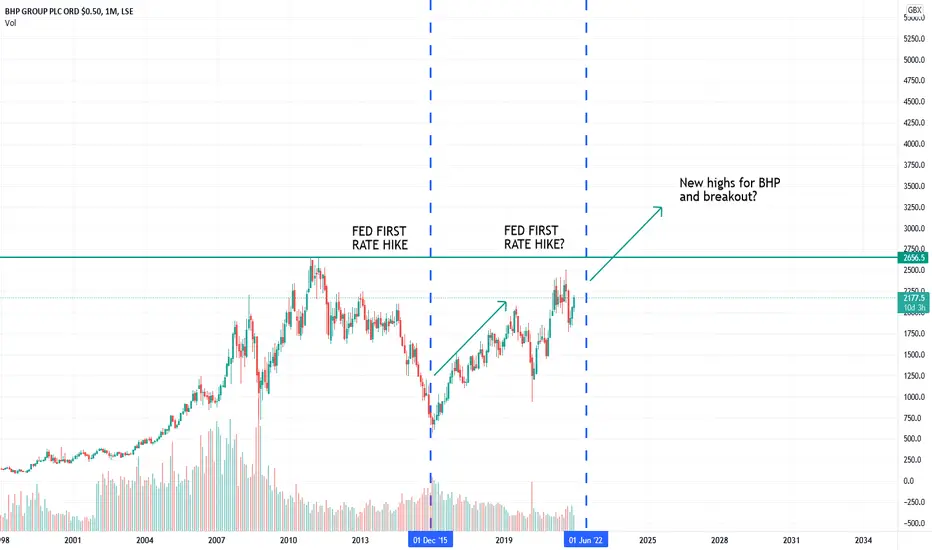
BHP - Will a fed rate hike lead to a breakout in the SP?History says it will.
I expect next years rate hike will lead to a rally in PM's and commodities, as it did back in early 2016.
Capita: 5R Long SetupCapita - Short Term - We look to Buy at 33.70 (stop at 31.08)
We look to buy dips. We are trading at oversold extremes. Price action moved lower but found support at 34.00. We look for a temporary move higher. A higher correction is expected. Risk/reward is ample to call a buy trade.
Our profit targets will be 48.89 and 55.00
Resistance: 45.00 / 50.00 / 55.00
Support: 34.00 / 31.00 / 25.00
Disclaimer – Saxo Bank Group. Please be reminded – you alone are responsible for your trading – both gains and losses. There is a very high degree of risk involved in trading. The technical analysis, like any and all indicators, strategies, columns, articles and other features accessible on/though this site (including those from Signal Centre) are for informational purposes only and should not be construed as investment advice by you. Such technical analysis are believed to be obtained from sources believed to be reliable, but not warrant their respective completeness or accuracy, or warrant any results from the use of the information. Your use of the technical analysis, as would also your use of any and all mentioned indicators, strategies, columns, articles and all other features, is entirely at your own risk and it is your sole responsibility to evaluate the accuracy, completeness and usefulness (including suitability) of the information. You should assess the risk of any trade with your financial adviser and make your own independent decision(s) regarding any tradable products which may be the subject matter of the technical analysis or any of the said indicators, strategies, columns, articles and all other features.
Please also be reminded that if despite the above, any of the said technical analysis (or any of the said indicators, strategies, columns, articles and other features accessible on/through this site) is found to be advisory or a recommendation; and not merely informational in nature, the same is in any event provided with the intention of being for general circulation and availability only. As such it is not intended to and does not form part of any offer or recommendation directed at you specifically, or have any regard to the investment objectives, financial situation or needs of yourself or any other specific person. Before committing to a trade or investment therefore, please seek advice from a financial or other professional adviser regarding the suitability of the product for you and (where available) read the relevant product offer/description documents, including the risk disclosures. If you do not wish to seek such financial advice, please still exercise your mind and consider carefully whether the product is suitable for you because you alone remain responsible for your trading – both gains and losses.

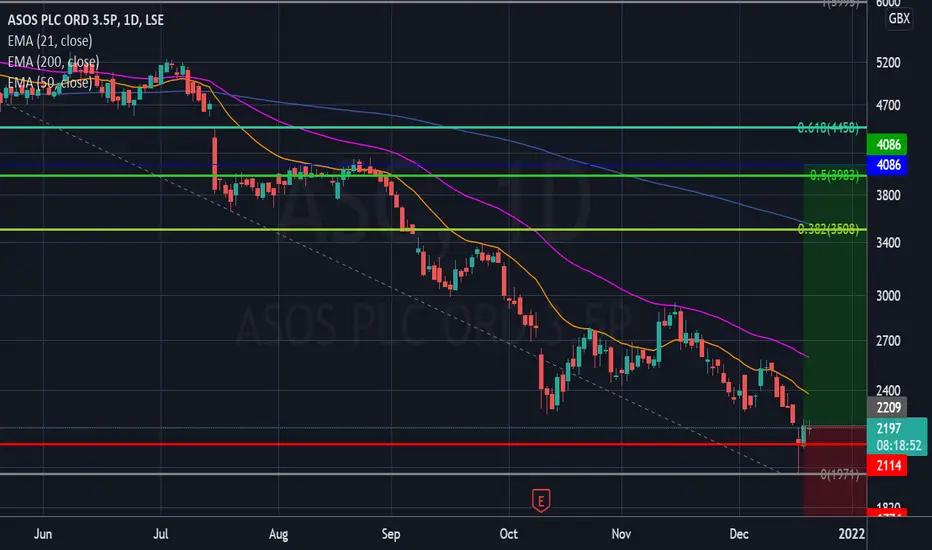
ASOS - Long term long tradePrice hasnt been at these lows since the pre-pandemic crash last March. It is a significant historic low which is also a monthly support level. Its a good price for a stock that will certainly do well in the longer term. For a swing trade, getting in now and targeting range-bound resistance (confluence with 50% fib retracement zone) looks a solid, low-risk play.
Argo long4.5x in next few months? With btc likely going to 100k this next quarter , will argo follow suit? This triangle suggests a major breakout up or down now its hit support and resistance 3 times each. Declining volume suggests breakout soon

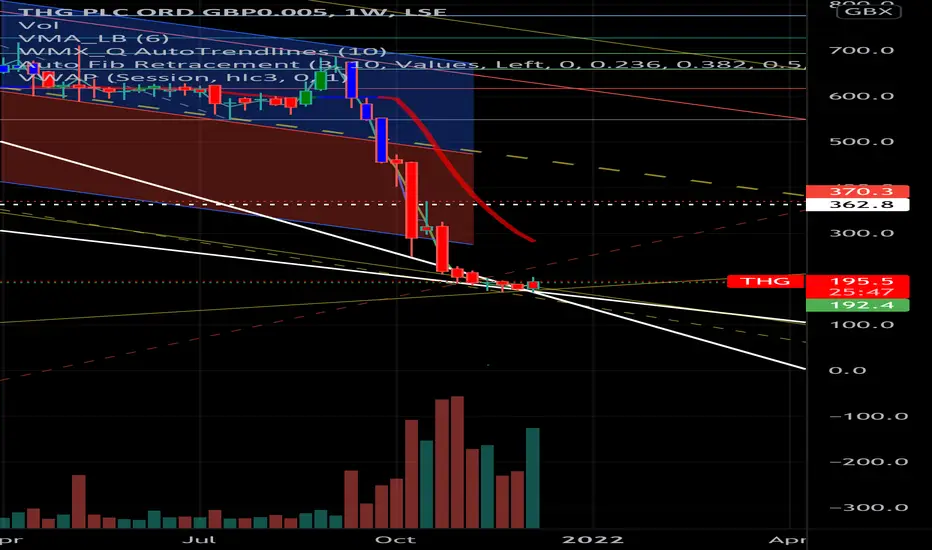
Sequence Launch.Rocket is about to take off. Look at this weekly volume and candlestick in relation to recent history.
This share is way oversold. IPOd at 500p and lost over 70% of its value from ATH due to untrue and inflated press reports.
The business is doing brilliantly
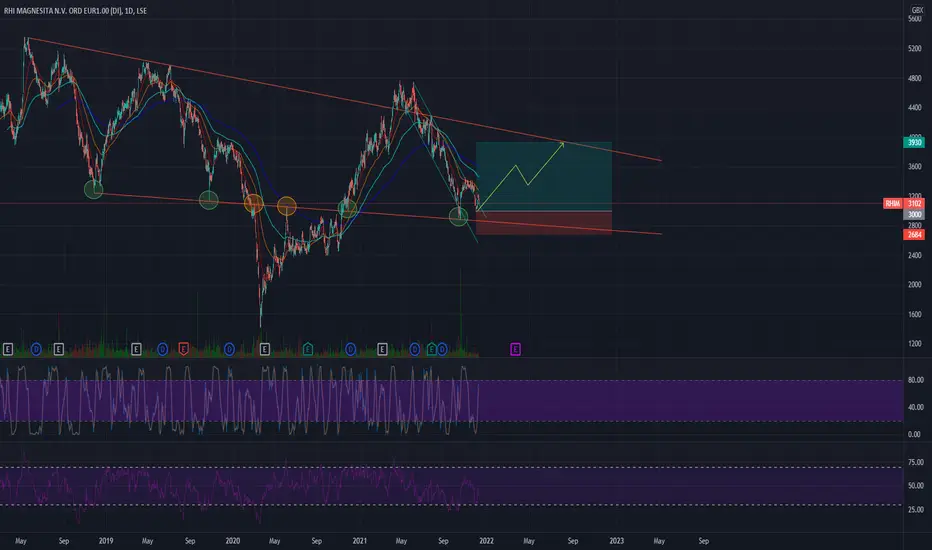
RHIM LongPlatinum will increase in value so their books I'm sure will look better as a result too.
Technical approve!
I've highlighted resistance/support with the colourful bubbles.
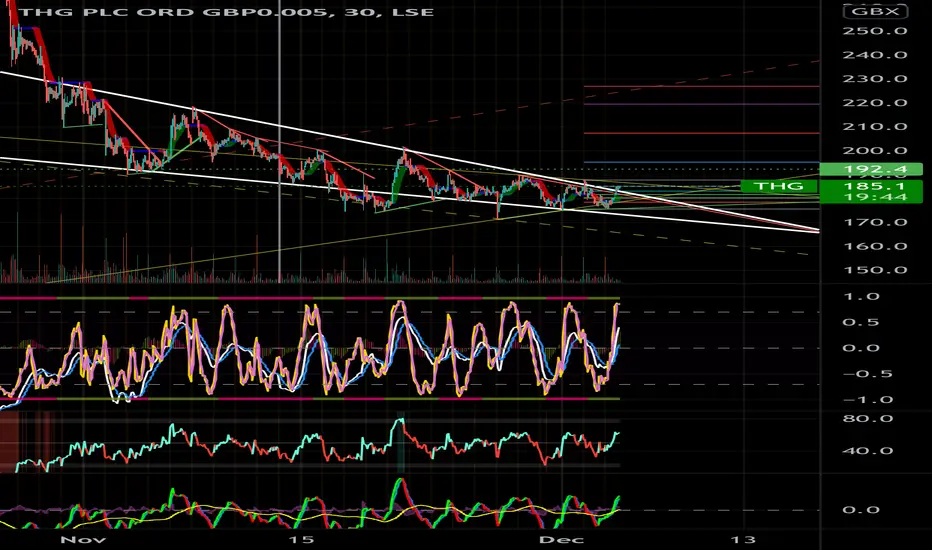
THG - 2nd Falling Wedge. Will it break to the upsideIts very close breaking to upside, if it out of here at close today then its a great signal for more upside
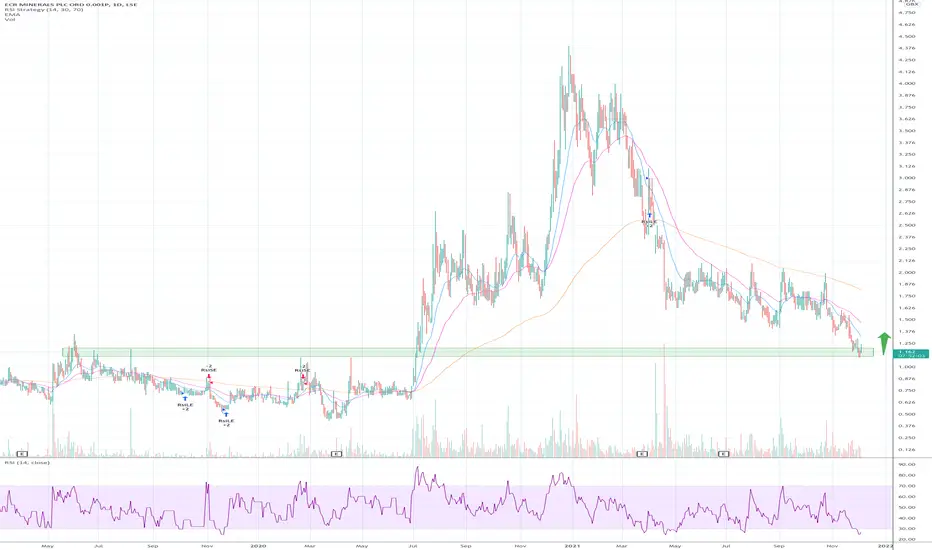
#ECR #ecrminerals – has it found the bottom?Finally some positive news post since Craig Brown stepped down
25% stake in Cordillera Tiger finally formalised after 5 year delay
Up 6% today, push for a run up to ’22 now with liquidity finally coming back to AIM
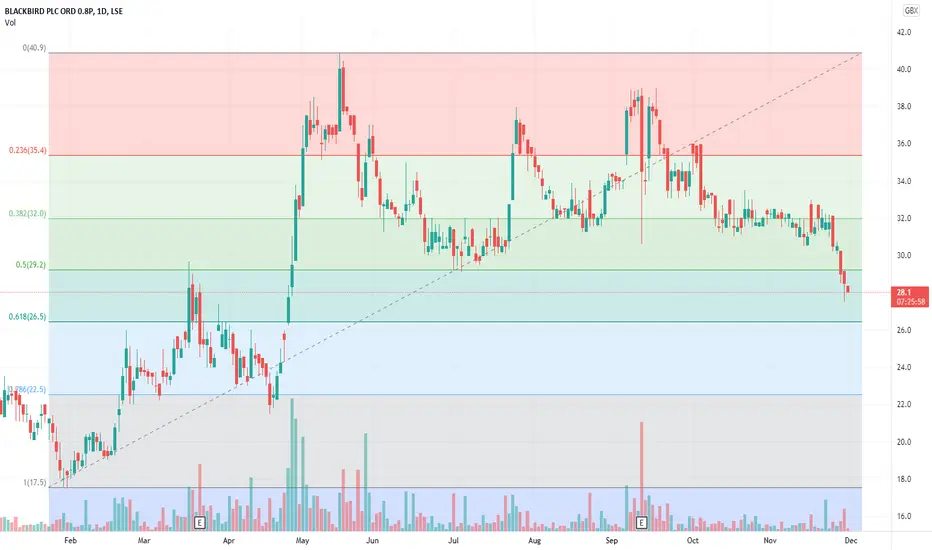
Where to next for blackbirdResistance at 29
Support at 26
My guess, touch 26 and then back above 29p
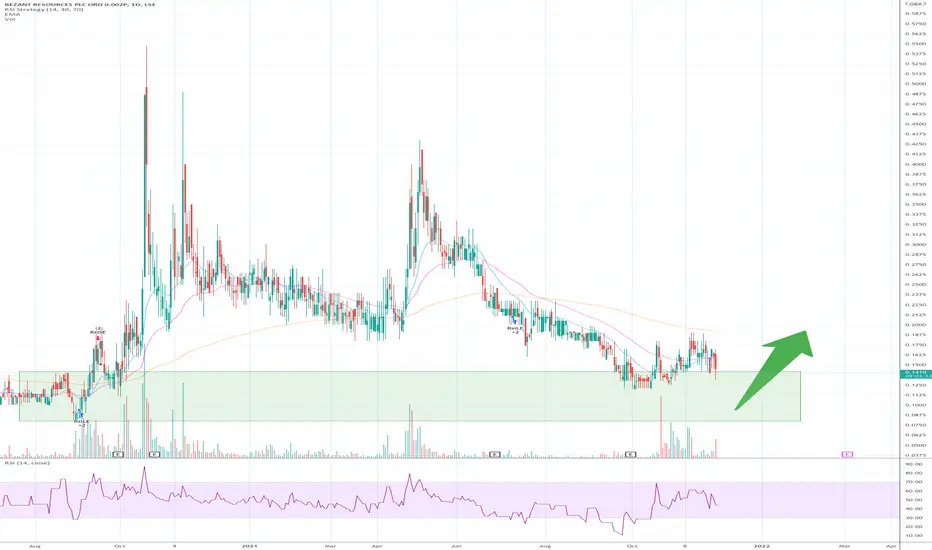
#BZT – Sitting in range of 52 wk low – ready to break-outGreat news this morning, A drill rig has been mobilised to undertake at least 2,000m of diamond drilling to test a number of new airborne EM conductors
Expect to bounce off the news as we get closer to approval for a new mining licence in the area…
#BMK – Consolidating nicely at IPO launch price#BMK – Consolidating nicely at IPO launch price
New funding complete
Results very positive this morning, expected growth in seafood markets huge in 2022
Made strong move to this level and looks set to break-out if announcement of listing Norwegian exchange happens soon, Norway being the biggest fishing market in the world

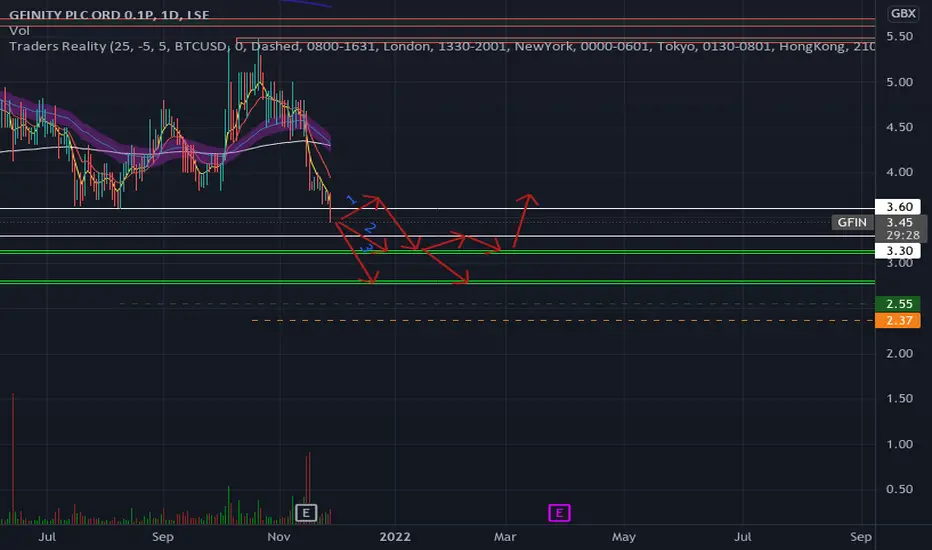
GFIN , not a great time.. Since the 15th of November the price of Gfinity started testing all the supports that have consolidated for the last couple of months. Unfortunately even if still receiving high average volume the news of the ADJUSTED EBITDA LOSS of -2.3 MILLION and the operating loss of 50 % to -2.7 million had hit the price.
As per chart: the price seems to go to test the area of £3.10 (where there has been a previous support area) if broken the price can even go further to £2.80. I've drawn 3 different scenarios that are possible in my opinion.
The next earning are on the 29th of March 2022.
Let me know in the comment what you think and if you like my ideas leave a LIKE tu support me !
Peace =)
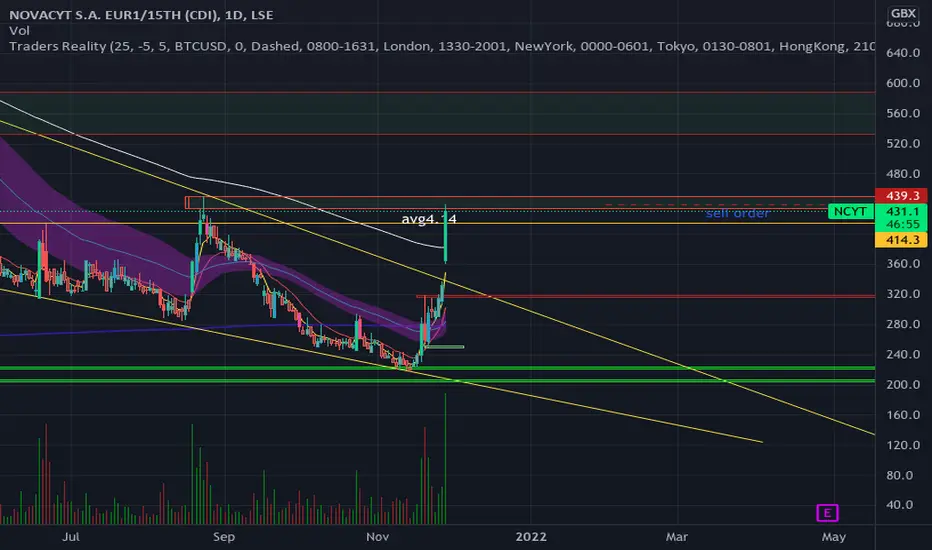
Novacyt NCTY what a pump !As you can see from the chart Novacyt had a massive volume inflow in the last 2 days even because of the very good news regarding the uk gov that accepted different NCTY covid tests and even because of the news of the new covid variant.
If you check my previous analysis I was waiting for a reversal pattern for quite a while and here we are .
Be careful if you intend to enter long now because a +30% in one day in stock definitely need a sort of retracement down and than a push up again.
Leave a like or a comment if you want to support me
Thanks !