$AAL ANGLO AMERICAN: ROCK SOLID OR CRACKING UNDER PRESSURE?💥 ANGLO AMERICAN: ROCK SOLID OR CRACKING UNDER PRESSURE?
Is Anglo American ( LSE:AAL ) a hidden gem 💎 or just another miner struggling with the weight of falling revenues and shaky markets? Let’s break it down with real data and fresh insight! 👇
1/ Revenue collapse? Yep.
FY 2024 revenue plummeted 📉 12.72% from £35.12B to £30.65B.
Net income: Crashed 93.73%, from £4.51B to a measly £283M. 💸
EPS tanked 93.70%, but Q4 production of copper and iron ore beat expectations. 📊
2/ What’s Anglo’s Plan? 🤔
They're reshaping their portfolio with a $4.9B growth strategy.
Restructuring, asset sales, and potential Amplats spinoffs are on the table.
The big question: Can these moves revive profitability? 🔄
3/ Undervalued or just stuck in the mud? 💲
Price today: 2,548.00p
Analyst target: 2,629.29p—modest upside, but deeper models say 32% undervaluation based on recovery potential. 📈
What would you do? Buy the dip, or wait it out? 🤔
4/ How’s it doing vs. competitors? 🏆
Compared to BHP, Rio Tinto, and Glencore:
Anglo shows mixed performance—some production wins, but revenue and earnings are lagging.
Competitors have been quicker to capitalize on demand for metals like iron ore and copper.
5/ The Risk Factor ☠️:
Commodity price swings: When metals drop, so does Anglo. 💣
Operational risks: Labor shortages and regulatory headaches, especially in South Africa 🇿🇦 and Brazil 🇧🇷.
Environmental scrutiny: Mining faces rising costs tied to sustainability 🌱 and compliance.
6/ SWOT Analysis 💡
Strengths:
✅ Diversified portfolio (metals crucial to green tech)
✅ Global reach and strong infrastructure
Weaknesses:
⚠️ Earnings decline, revenue underperformance
⚠️ Vulnerability to commodity volatility
7/ Opportunities vs. Threats:
Opportunities:
🚀 Metals demand will grow with green energy transitions—think electric vehicles and renewables.
🚀 Strategic asset divestitures could unlock value.
Threats:
🌍 Political instability in major regions
🌍 Tightening environmental regulations (higher costs ahead)
8/ Investment Thesis:
Anglo is in a tough spot. Undervalued? Maybe. But recovery depends on commodity prices and restructuring success. 🛠️
If they nail their strategy, there’s upside potential—but risk is high in today’s market. 📉
9/ What’s next? 🔮
Keep an eye on restructuring news—asset sales could shift market sentiment.
Monitor production trends in copper and iron ore.
Look out for green tech demand driving metals growth over the long term. 🌱
10/ What do YOU think?
📈 Bullish: It’s gonna recover.
🔄 Hold: Let’s wait for more signs.
🚫 Bearish: Nope, this one’s toast.

USD/CAD got absolutely 'hammered' on MondayTrump's trade negotiations provided USD/CAD with its most volatile daily range since the height of the Pandemic. Yet the surprise announcement that Trump is pausing Canada's tariffs for 30 days saw prices reverse sharply lower, to close the day with an elongated bearish hammer.
Does that pave the way for an immediate reversal lower? Not necessarily. Using price action and market position, I explain why.
Matt Simpson, Market Analyst at City Index and Forex.com

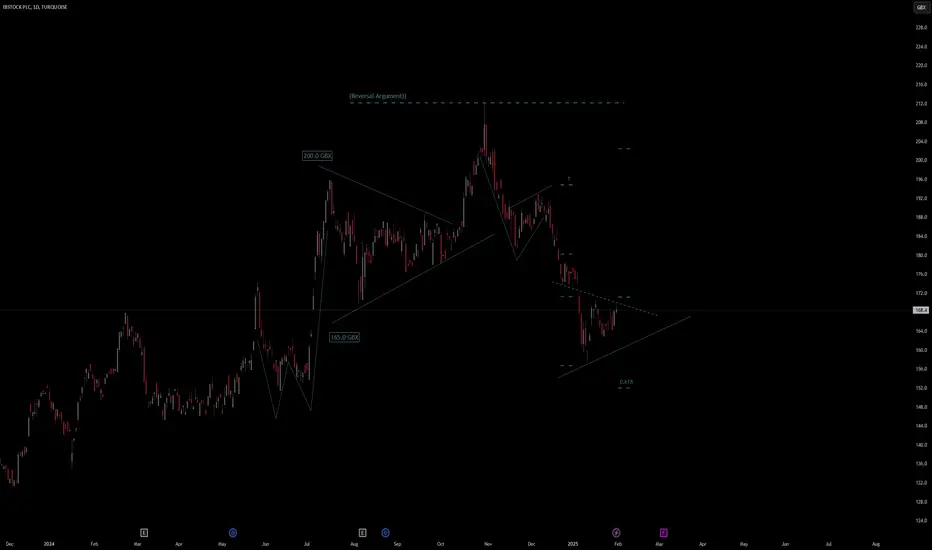
IBSTOCK PLC Stock Quote | Chart & Forecast SummaryKey Indicators On Trade Set Up In General
1. Push Set Up
2. Range Set up
3. Break & Retest Set Up
Notes On Session
# IBSTOCK PLC Stock Quote
- Double Formation
* 165.00 GBX | Area Of Value | Subdivision 1
* (Reversal Argument)) | Resistance Measurement
- Triple Formation
* 1st Numbered Retracement | Entry Area | Subdivision 2
* 2nd Numbered Retracement | Neutral Feature | Subdivision 3
* Daily Time Frame | Trend Settings Condition
Active Sessions On Relevant Range & Elemented Probabilities;
European Session(Upwards) - US-Session(Downwards) - Asian Session(Ranging)
Conclusion | Trade Plan Execution & Risk Management On Demand;
Overall Consensus | Neutral
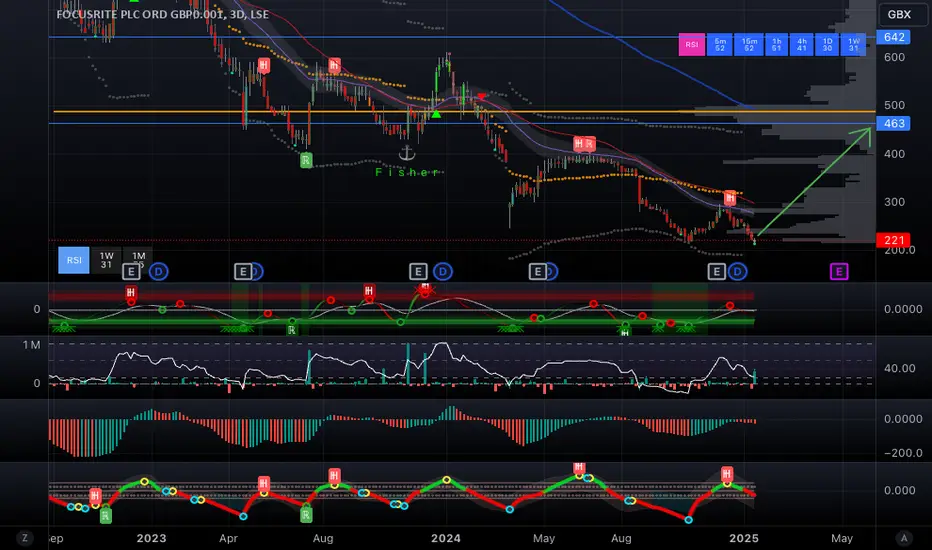
Focusrite (TUNE) to rally into mid-2025Beaten down, but fundamentally still a good business and my research is telling me that sales have picked up meaningfully since last earnings. Chart has a nice RSI divergence and daily reversal candle signifying a bottom has just been made on Friday 17th Jan.
Ballsy to pick an exact bottom? Yes... But sometimes a setup comes along that you have high confidence on and this is one of those for me ;)
800% extension for Pharos Energy?** risky, small market cap **
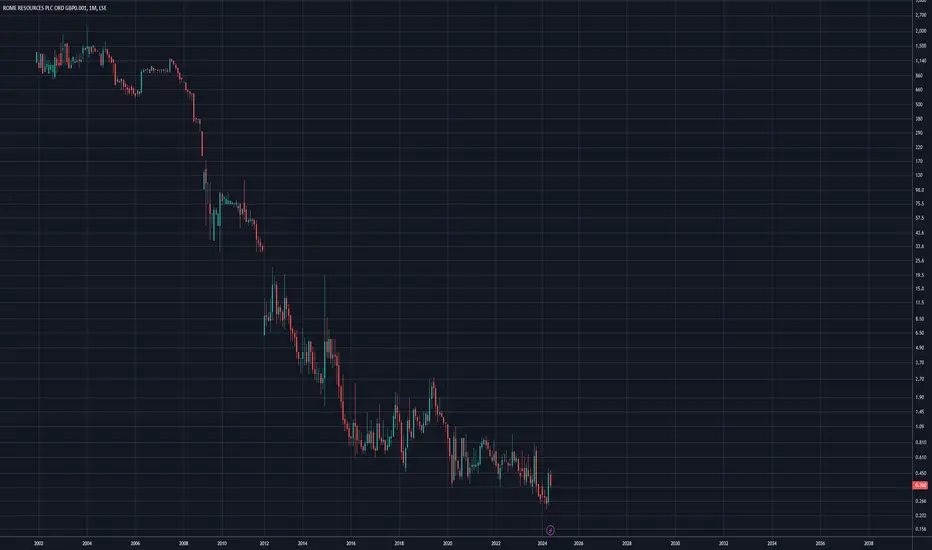
On the above 6 week chart price action has corrected 98% since 2007. A number of reasons now exist for a bullish outlook, they include:
1) Price action and RSI resistance breakouts.
2) Support on past resistance following a 4 year accumulation period.
3) No stock splits since 330.
4) Market resistance sits between 100 and 180.
Is it possible price action falls further? Sure.
Is it probable? No.
Ww
Type: trade
Risk: Seriously small position size
Timeframe for long: This week
Return: 3-7x
Stoploss: N/A
Nano market cap RC365 Holding to explode 10,000% / 100x ???** high risk, tiny market cap **
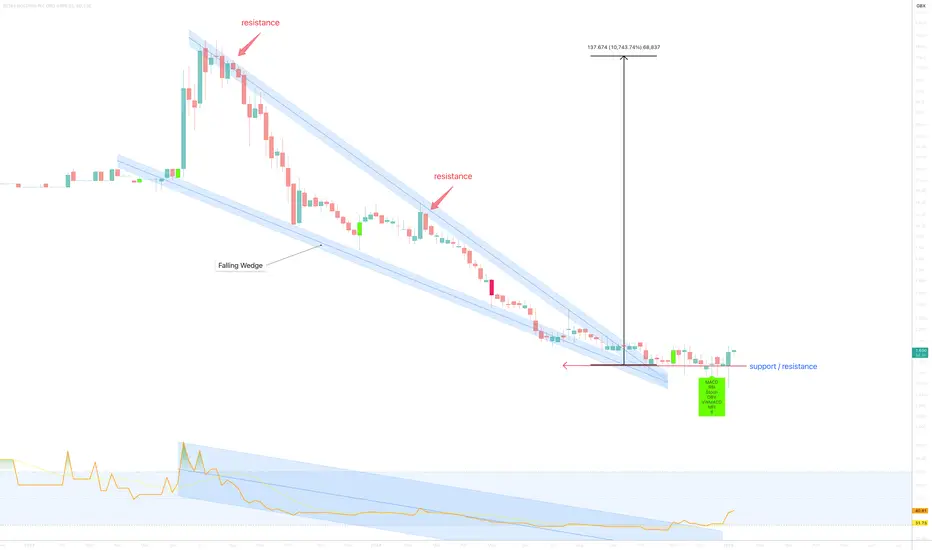
On the above 4 day chart price action has corrected 99% since mid 2023. A number of reasons now exist for a bullish outlook, they include:
1) Price action and RSI resistance breakouts.
2) Support on past resistance since October last.
3) Strong positive divergence. Multiple oscillators print positive divergence with price action.
4) Should the monthly candle close as is (below), then a rapid move to the 20 Pounds area followed by a move to 126 should be observed.
5) The forecast to 140 is taken from the top and lower wedge touch points.
Is it possible price action falls further? Sure.
Is it probable? No.
Ww
Type: trade
Risk: Seriously small position size
Timeframe for long: This month
Return: 100x
Stoploss: N/A
Monthly chart
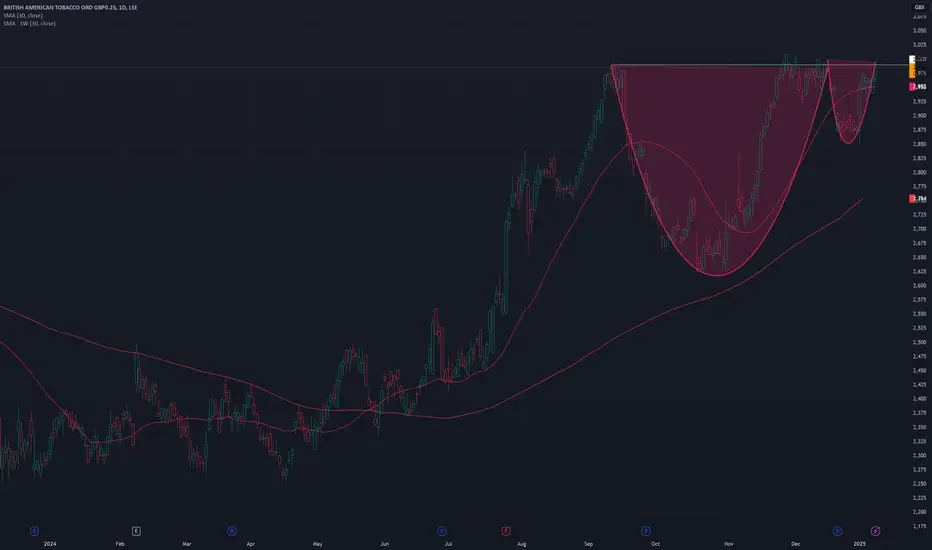
Cup and handle pattern on BATSNice looking bullish cup and pattern on this chart of tobacco producer BATS. Could be a long opportunity.
JD LSE Bullish Divergence on dailyStrong decline, now while ending the decline it's pulling a bullish divergence on the daily, weekly turning up as well
TP 102,5
E 95,44
SL 91,95
Trade #00007
3 trades still open
trade 1 to 3 are closed: hitrate 100%

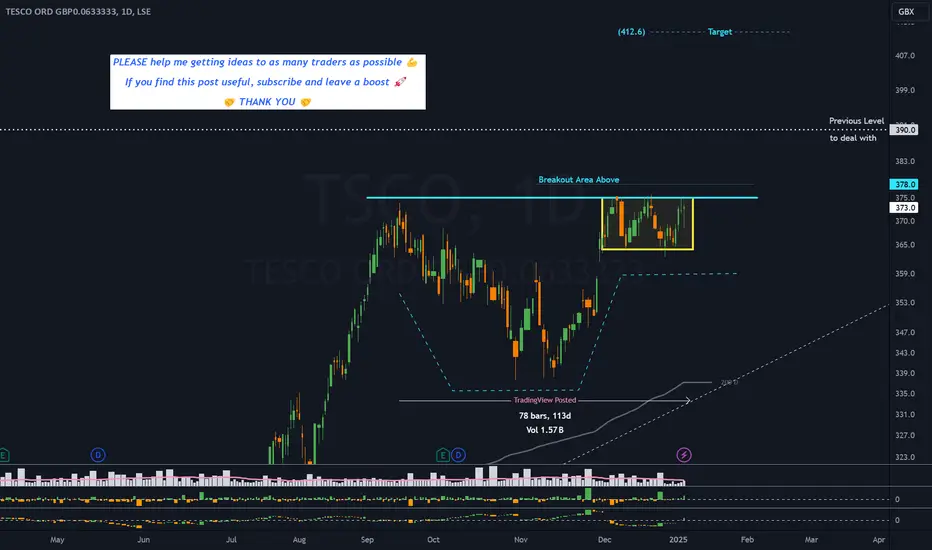
TSCO - 4 months CUP & HANDLE══════════════════════════════
Since 2014, my markets approach is to spot
trading opportunities based solely on the
development of
CLASSICAL CHART PATTERNS
🤝Let’s learn and grow together 🤝
══════════════════════════════
Hello Traders ✌
After a careful consideration I came to the conclusion that:
- it is crucial to be quick in alerting you with all the opportunities I spot and often I don't post a good pattern because I don't have the opportunity to write down a proper didactical comment;
- since my parameters to identify a Classical Pattern and its scenario are very well defined, many of my comments were and would be redundant;
- the information that I think is important is very simple and can easily be understood just by looking at charts;
For these reasons and hoping to give you a better help, I decided to write comments only when something very specific or interesting shows up, otherwise all the information is shown on the chart.
Thank you all for your support
🔎🔎🔎 ALWAYS REMEMBER
"A pattern IS NOT a Pattern until the breakout is completed. Before that moment it is just a bunch of colorful candlesticks on a chart of your watchlist"
═════════════════════════════
⚠ DISCLAIMER ⚠
Breakout Area, Target, Levels, each line drawn on this chart and any other content represent just The Art Of Charting’s personal opinion and it is posted purely for educational purposes. Therefore it must not be taken as a direct or indirect investing recommendations or advices. Entry Point, Initial Stop Loss and Targets depend on your personal and unique Trading Plan Tactics and Money Management rules, Any action taken upon these information is at your own risk.
═════════════════════════════
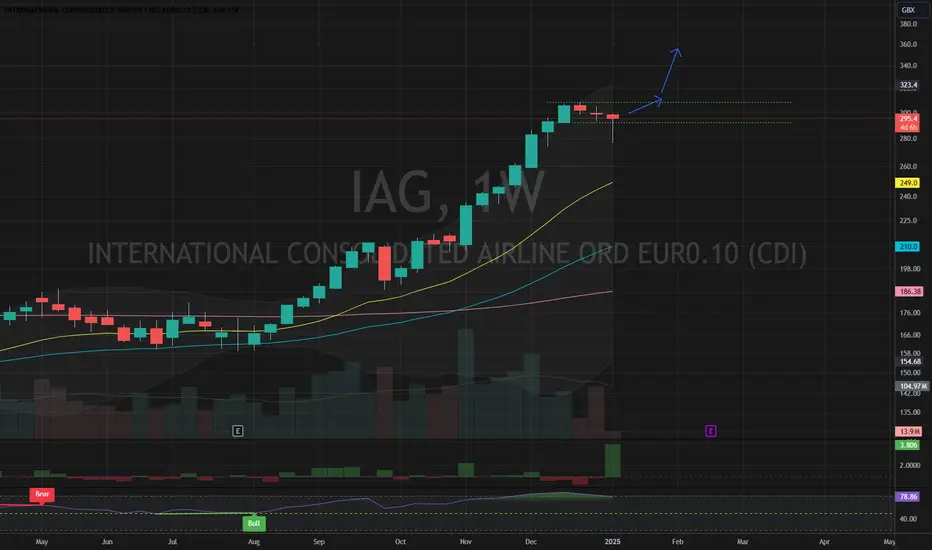
IAG base developing - potential upside moveConsolidation and base is developing for IAG on the weekly charge. Let the RSI cooldown and BB tighten and then a break of the channel high in the next couple of weeks could lead to further upside move?
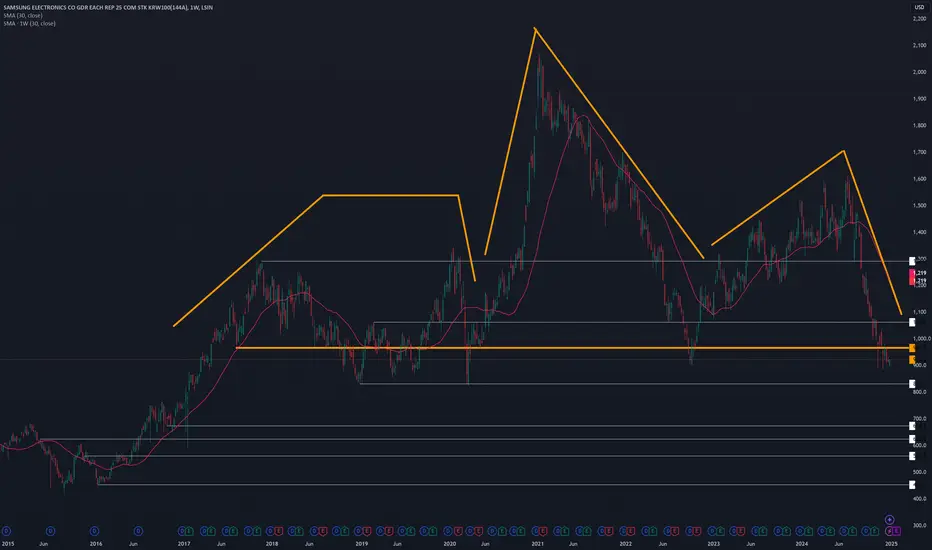
Samsung Head and shouldersVery long term pattern of head and shoulders has emerged on Samsung. This is the UK traded stock. Whether you can short it or not I don't know but extreme caution on going long is probably a good idea.
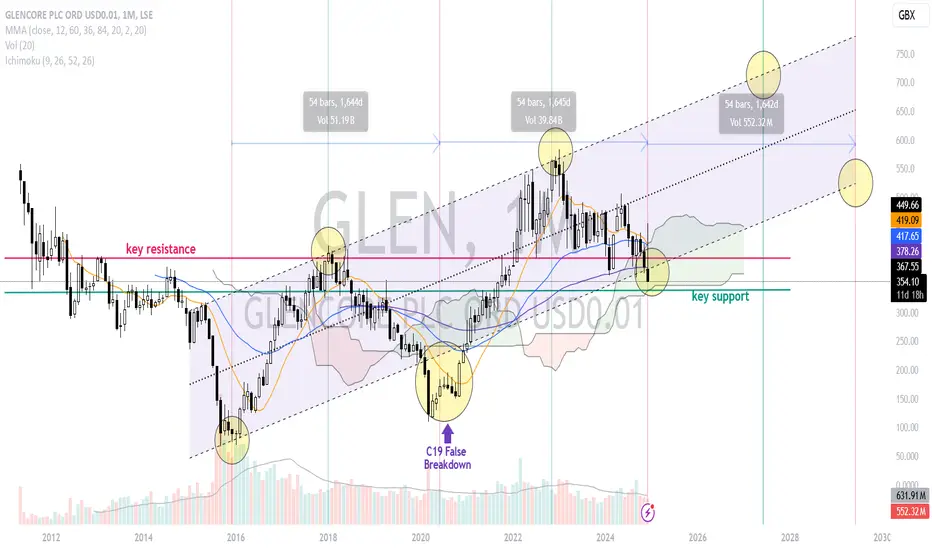
$GLEN ( Glencore ) Good entry or falling knife? idea shown above.. falling out of the channel and possibly further downside risk
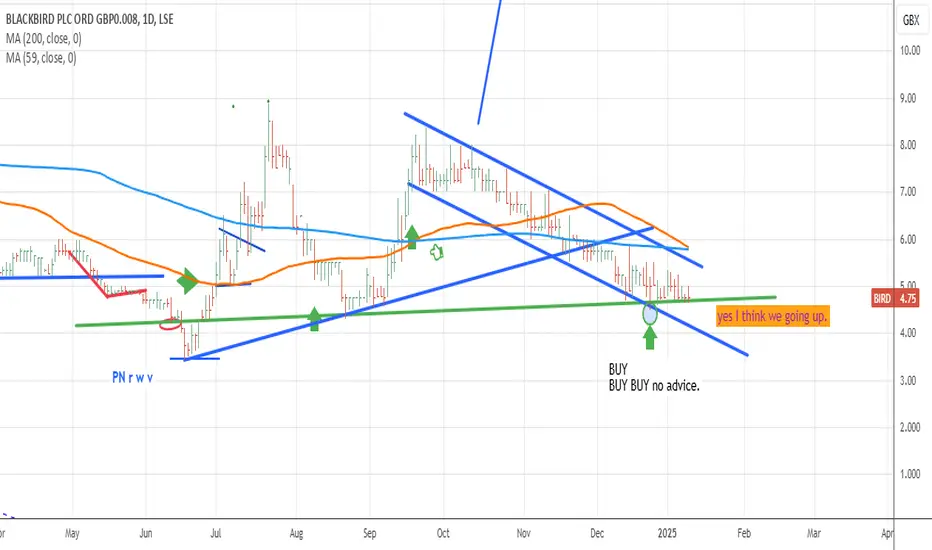
I do think BIRD will be one of my best investments of all time.
Innovative Technology: Blackbird operates in the cloud-native video editing and publishing software market with its platform named Blackbird. This platform allows for frame-accurate navigation, playback, viewing, and editing in the cloud, which is particularly beneficial for video professionals in various sectors including news, sports, and entertainment. The technology's ability to handle video in a cloud-based environment offers significant advantages like cost savings, reduced hardware requirements, and scalability, which are increasingly important in the digital content era.
Market Growth and User Adoption: The company has shown growth in user adoption with its product elevate.io, which has reached 40,000 users across 120 countries shortly after its launch. This indicates a potential for further expansion in the SaaS and cloud video markets, where Blackbird operates.
Strategic Developments: Blackbird has been active in enhancing its product offerings, with recent announcements about new features and the appointment of new directors to support the rollout of elevate.io, suggesting a strategic push to strengthen its market position.
Financial Considerations: While Blackbird's latest annual financials show a net loss, the company's revenue from its innovative technology, even if not yet profitable, indicates potential for future growth. The interest from both insiders through share purchases and from external investors might suggest confidence in future profitability or a strategic acquisition. However, the negative price-to-earnings ratio implies that the company is not currently profitable, which investors should consider alongside growth potential.
Investment Sentiment: There's a mix of optimism and caution among investors based on discussions on platforms like ADVFN, where some see potential in the rapid user growth of elevate.io, while others express concerns over monetization and user retention. This duality in investor sentiment could mean there's room for significant upside if the company manages to successfully navigate these challenges.
However, investing in Blackbird plc also comes with risks:
Volatility: The stock has shown significant volatility, which might not suit all investors, particularly those with a low risk tolerance.
Profitability: The company is currently reporting losses, which could be a concern for investors focusing on immediate returns.
Market Competition: The cloud video editing market is competitive, and Blackbird's ability to maintain or grow market share will depend on continuous innovation and effective marketing.
In conclusion, buying Blackbird plc shares could be considered if you believe in the long-term growth of cloud-based video solutions and are willing to accept the risks associated with a company that is still working towards profitability. As with any investment, it's crucial to conduct thorough due diligence, consider your investment strategy, and possibly consult with a financial advisor.
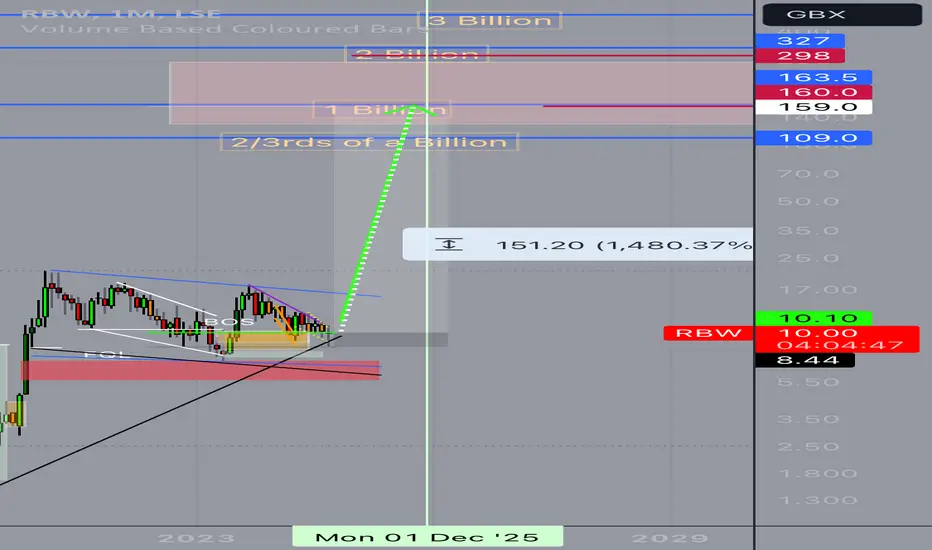
90R Trade + 1500% move on RBWA company with exceptional fundamentals.
Expecting the next major move up to have started now after a multi-year consolidation phase.
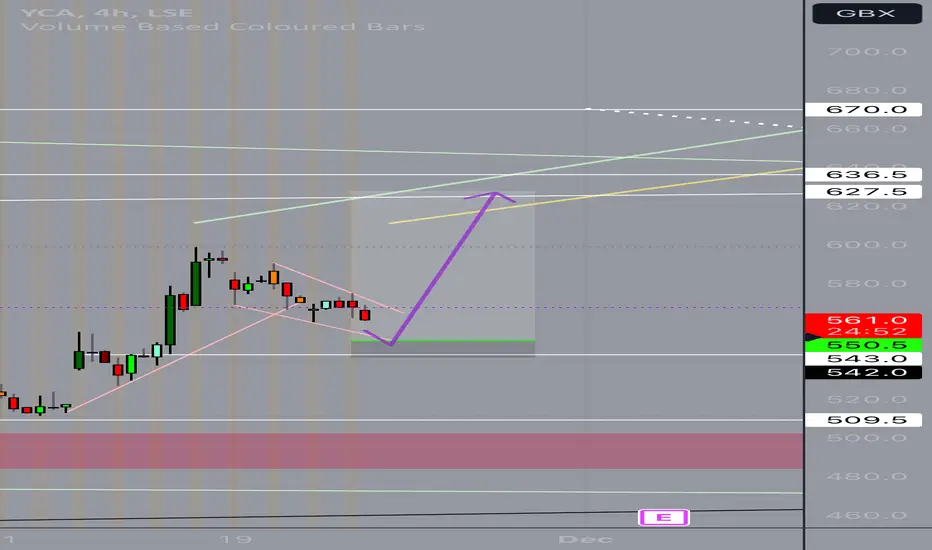
Yellow Cake9R trade.
Expecting a move up here. Medium risk trade. 40% chance of success.
Only take the trade if it falls in more or less exactly as shown.
It has to look symmetrical with the third tap almost equidistant relative to the first two of the lower trendline.
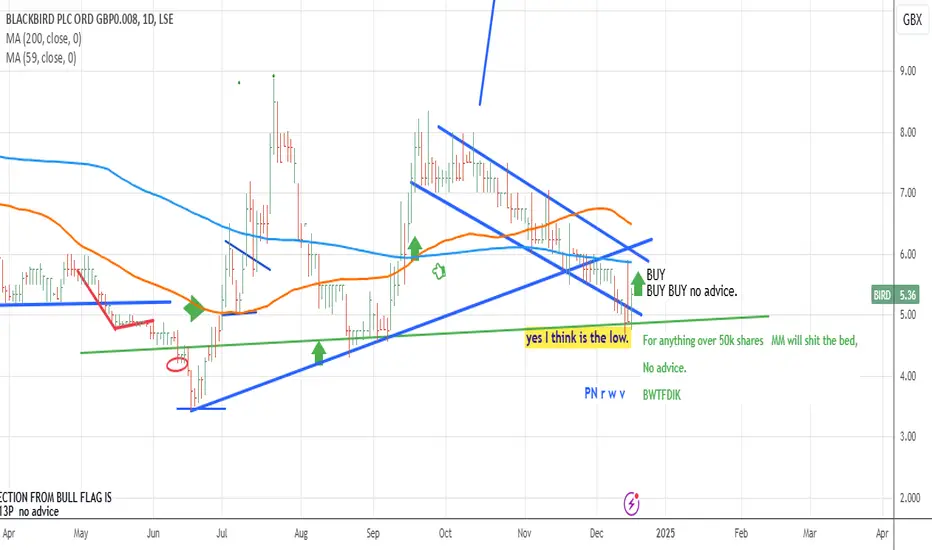
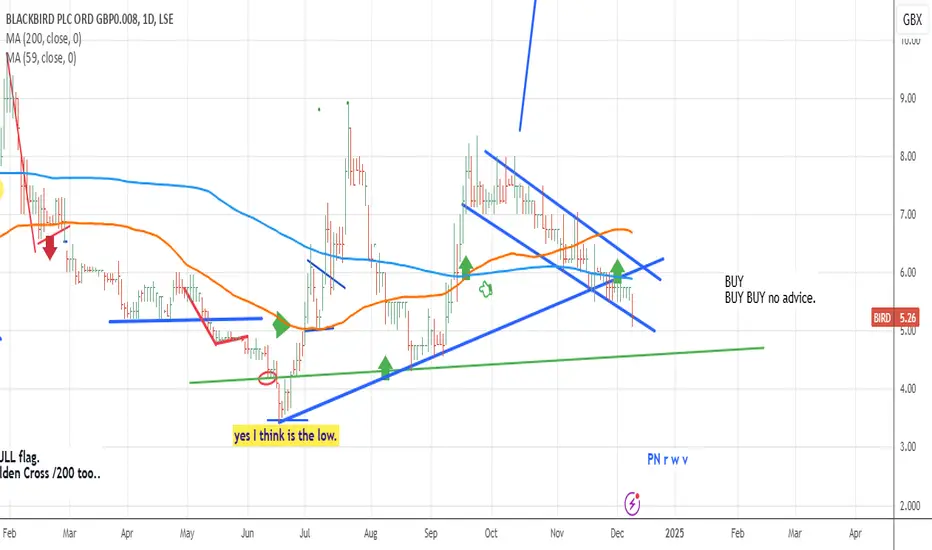
"BIRD" BUY "BIRD NO ADVICEBlackbird plc has behaved a I thought, I think BIRD is looking for buyers..
No advice
BWTFDIK
SSB
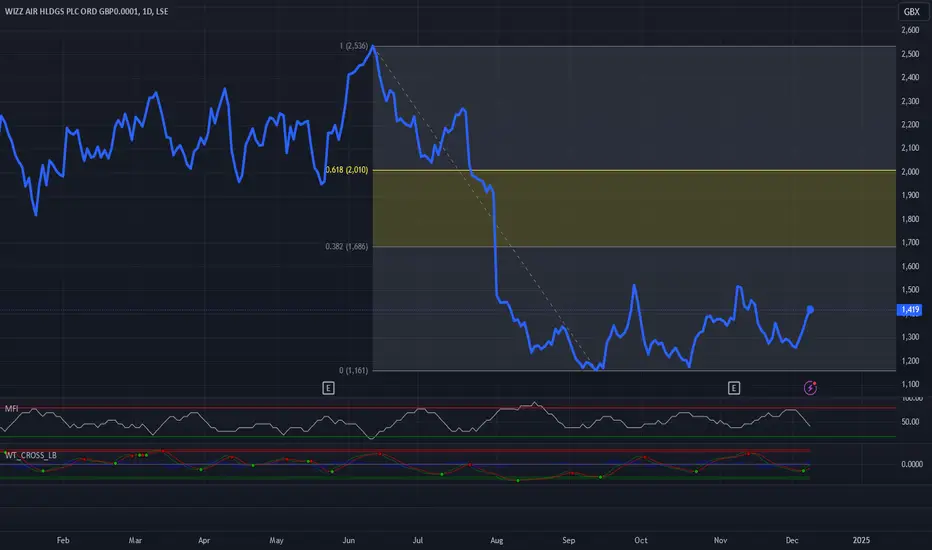
WIZZ Wizz has reported positive earnings and continues to show growth. As its brand recognition increases in the coming periods, the profit margin is expected to rise further. The current price is attractive, and I have set target levels at 1500 and 2300.
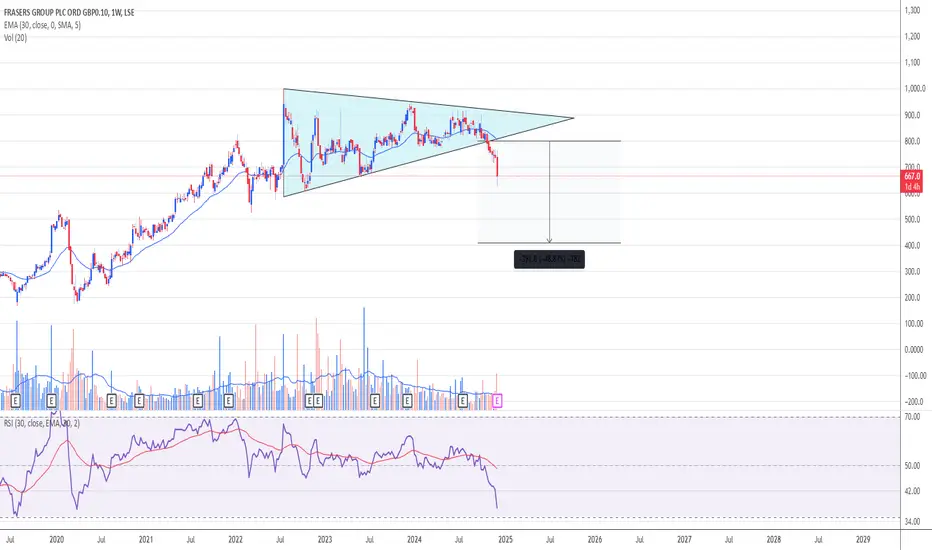
Fraser's Group - negative From the bottom of the pandemic they went from 180 to 995.
In Oct 24 they broke to the downside after forming a triangle pattern from July 22 to Oct 24.
There was no indication that the price would break out to the upside from that pattern.
In technical analysis, the target for Shorters would be 409.
GLA and DYOR. This is not a solicitation to hold or trade.
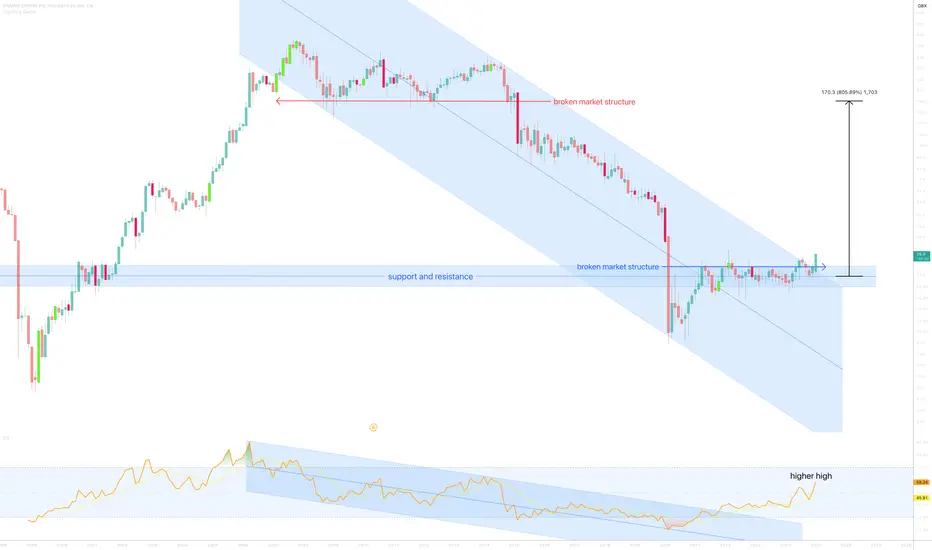
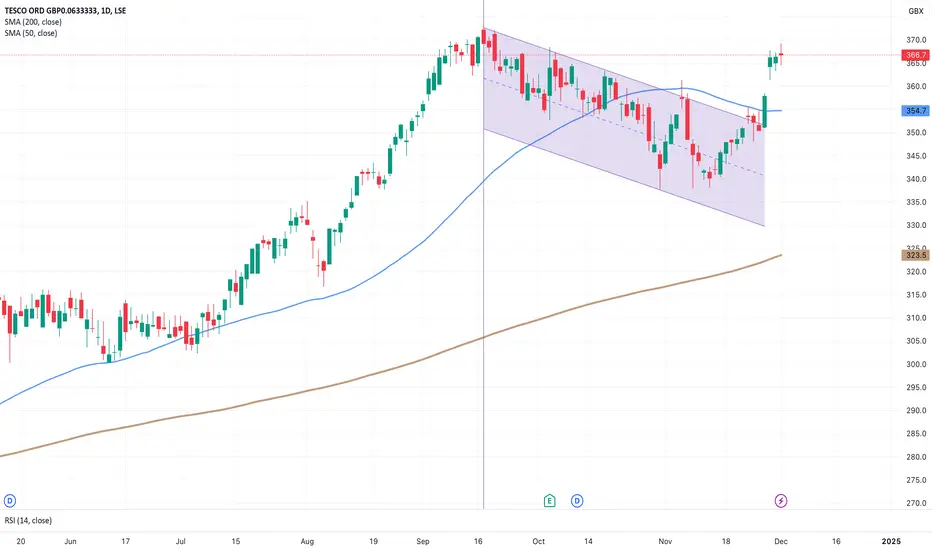
Tesco’s Loyalty Boost Sparks Channel BreakoutTesco's share price has come alive, breaking out of its recent lull just in time for the critical holiday season. With a long-term uptrend intact and a timely nod from the UK regulator on its loyalty schemes, the supermarket giant is flexing its retail muscles once again.
A Year of Growth, Loyalty, and Market Leadership
Tesco’s share price has been locked in a strong uptrend this year, supported by the 50-day simple moving average (SMA) consistently trading above the upward-sloping 200-day SMA. This sustained bullish momentum reflects the company’s strong performance, bolstered by robust earnings and strategic initiatives.
In its most recent half-year results for 2024, Tesco delivered a 7.4% rise in group sales to £30.2 billion and operating profit growth of 13.5% to £1.5 billion, highlighting resilience in a challenging retail environment. Its market-leading Clubcard scheme continues to drive customer engagement, contributing to a 3.7% increase in like-for-like sales in the UK and Ireland.
In September, Tesco surged to fresh highs, before entering a period of mean reversion. Prices pulled back within a broad descending channel as they consolidated around the 50SMA, offering a classic technical setup that hinted at a potential resurgence.
That resurgence materialised last week following a report from the Competition and Markets Authority (CMA) confirming that supermarket loyalty schemes, including Tesco’s Clubcard Prices, offer genuine savings for consumers. The CMA’s review of 50,000 grocery products revealed average savings of 17-25% for loyalty scheme members, dispelling scepticism about misleading promotions. This endorsement not only reassures shoppers but strengthens Tesco's position as a leader in customer value. With 70% of UK households using Tesco's Clubcard, this affirmation solidifies its competitive edge during the critical holiday shopping period.
The breakout from the descending channel has realigned short-term momentum with Tesco's broader uptrend. With the festive season approaching, Tesco appears well-positioned to capitalise on increased consumer spending. If current trends hold, the shares could retest September highs and potentially aim for fresh peaks, making this a stock to watch through year-end.
Tesco (TSCO) Daily Candle Chart
Past performance is not a reliable indicator of future results
Disclaimer: This is for information and learning purposes only. The information provided does not constitute investment advice nor take into account the individual financial circumstances or objectives of any investor. Any information that may be provided relating to past performance is not a reliable indicator of future results or performance. Social media channels are not relevant for UK residents.
Spread bets and CFDs are complex instruments and come with a high risk of losing money rapidly due to leverage. 82.67% of retail investor accounts lose money when trading spread bets and CFDs with this provider. You should consider whether you understand how spread bets and CFDs work and whether you can afford to take the high risk of losing your money.
When is a stock too high to buy? (Example: IHG)How do you know when you’ve missed the boat?
A stock has already gone up a tonne, so bascally you are too late!
Sometimes, you just have to let go, right?
Sometimes yes, but not always - let’s look at an example.
International Hotels Group (IHG)
Back in 2020, LSE:IHG IHG shares were trading down at ~2000 GBX, now they are a hairs breadth from 10,000 - that’s 5X in about 4 years. Not bad.
Can you really even think about buying shares at 10,000 that were 2,000 only 4 years ago. 🤔
We’re saying YES.. if you follow some guidelines.
Clearly this is not a value investment - this is a momentum trade.
To be buying IHG shares up here, one is basically arguing that the price at new highs indicates and buyers are in charge and the price is going to keep going up for the time being.
This helps define the trade risk very well.
If the trade is that IHG has broken out over the previous peak at ~8,800. We don’t want to be owning shares below this level - if they’re back below 8,800 the momentum has stalled and we need to be out.
To put it another way, we are not buying just under 10,000 and willing to hold the shares all the way back down to 2,000 again - no. We want to ride the momentum up - not down !
From here there’s a pretty good chance that momentum takes the price up to the 10,000 level. As a big round number, there is also a good chance that profit taking takes place here too.
That creates our buy zone between 8,800 and the current market price (9,750).
So what might a trading strategy look like to capture this situation?
The following is a way to have:
An intial risk of £1000 to test the waters
A total risk £3000 if/when the trade starts working
A 2X profit potential (with the opportunity to capture more)
Spread Betting Strategy: Target £6000+ Profit with £1000 Initial Risk
Entry Points and Stops
9000 GBX Entry:
Stop Loss: 8600 GBX.
Bet Size: £2.50 per point.
Risk: £1000.
9200 GBX Entry:
Stop Loss: 8800 GBX.
Bet Size: £2.50 per point.
Risk: £1000.
9400 GBX Entry:
Stop Loss: Trailing 400 points.
Bet Size: £2.50 per point.
Initial Risk: £1000.
Profit Targets
First Position (9000):
Gain: 1000 points.
Profit: £2500.
Second Position (9200):
Gain: 800 points.
Profit: £2000.
Third Position (9400):
Trailing Stop Profit Example:
10,400 GBX: Profit = £2500.
11,000 GBX: Profit = £4000 or more.
Summary
Total Risk: £3000.
Fixed Profit (First Two Positions): £4500.
Potential Profit (Third Position): Variable, based on trailing stop.
Reward-to-Risk Ratio: 2:1 or higher, depending on trend continuation.

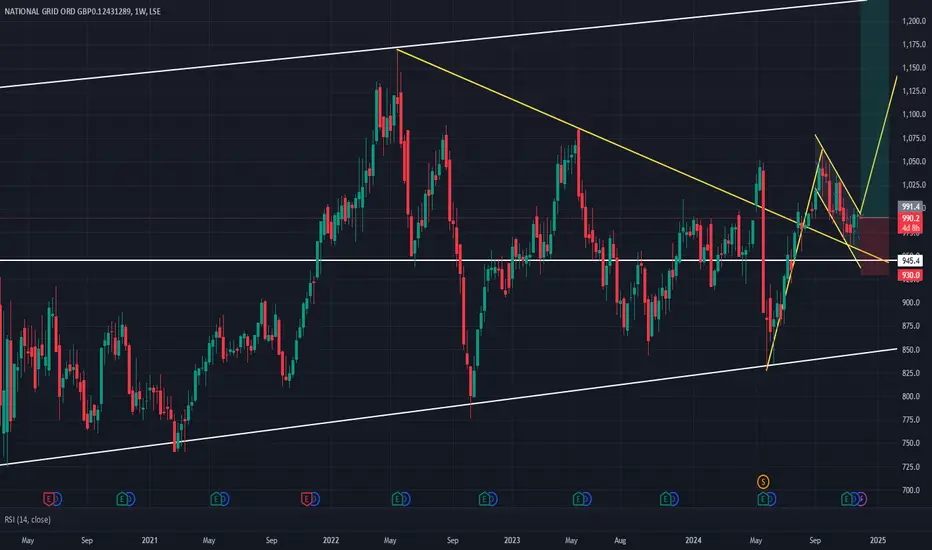
NG. - Long: bull flag breakout NG. has formed a bull flag with a falling parallel channel and is about to breakout. Bull flag is a continuation pattern so woith complete formation of bull flag, expected price target is 1230 which 24% profit from current price.
If we connect two highest points on a weekly point, they coincide with the same price target of 1230, completing formation of a bull flag.
Price is also above SMA200.
If price retraces back to lower parallel channel trendline, this would be a good add level as there is strong support zone in Weekly timeframe
Enter: Current Market Price
SL: 930
TP: 1230
R/R: 1:3.89
Rome Resources Bullish Potential for large move to the upside due to strong fundamentals. Long term horizon.