$LLOY : Lloyds Banks UKIn volatile markets, traders can benefit from large jumps in asset prices, if they can be turned into opportunities. Gaps are areas on a chart where the price of a stock (or another financial instrument) moves sharply up or down, with little or no trading in between. As a result, the asset's chart shows a gap in the normal price pattern. The enterprising trader can interpret and exploit these gaps for profit. This article will help you understand how and why gaps occur, and how you can use them to make profitable trades.
Gap Basics
Gaps occur because of underlying fundamental or technical factors. For example, if a company's earnings are much higher than expected, the company's stock may gap up the next day. This means the stock price opened higher than it closed the day before, thereby leaving a gap. In the forex market, it is not uncommon for a report to generate so much buzz that it widens the bid and ask spread to a point where a significant gap can be seen. Similarly, a stock breaking a new high in the current session may open higher in the next session, thus gapping up for technical reasons.
Gaps can be classified into four groups:
Breakaway gaps occur at the end of a price pattern and signal the beginning of a new trend.
Exhaustion gaps occur near the end of a price pattern and signal a final attempt to hit new highs or lows.
Common gaps cannot be placed in a price pattern—they simply represent an area where the price has gapped.
Continuation gaps, also known as runaway gaps, occur in the middle of a price pattern and signal a rush of buyers or sellers who share a common belief in the underlying stock's future direction.
To Fill or Not to Fill
When someone says a gap has been filled, that means the price has moved back to the original pre-gap level. These fills are quite common and occur because of the following:
Irrational exuberance: The initial spike may have been overly optimistic or pessimistic, therefore inviting a correction.
Technical resistance: When a price moves up or down sharply, it doesn't leave behind any support or resistance.
Price Pattern: Price patterns are used to classify gaps and can tell you if a gap will be filled or not. Exhaustion gaps are typically the most likely to be filled because they signal the end of a price trend, while continuation and breakaway gaps are significantly less likely to be filled since they are used to confirm the direction of the current trend.
When gaps are filled within the same trading day on which they occur, this is referred to as fading. For example, let's say a company announces great earnings per share for this quarter and it gaps up at the open (meaning it opened significantly higher than its previous close). Now let's say, as the day progresses, people realize that the cash flow statement shows some weaknesses, so they start selling. Eventually, the price hits yesterday's close, and the gap is filled. Many day traders use this strategy during earnings season or at other times when irrational exuberance is at a high.

Update the chart this time without errorUpdate the chart this time without error
The worst possible situation occurred and dropped to the range of 420
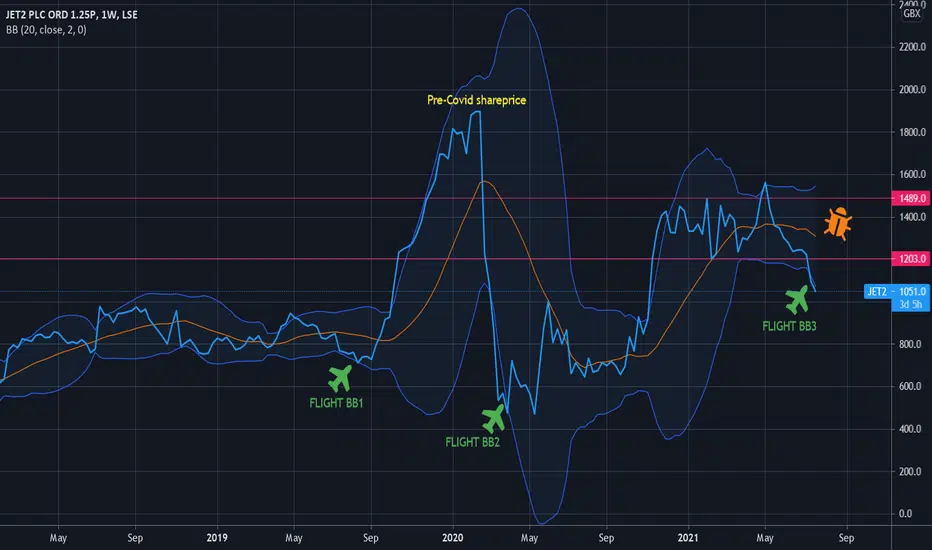
JET2 - Take flight BB3 returning to MeanJET2 seems to react nicely to double kiss of the lower BB line. It's happened twice recently followed by nice rise. Goldybug is watching current JET2 activity as price has now double kissed the lower BB line for a third time. Could it be set to rise again. Goldybug likes drinking Bollinger and is expectingJET2 price to return to mean. Good Luck. Goldybug opinion only.
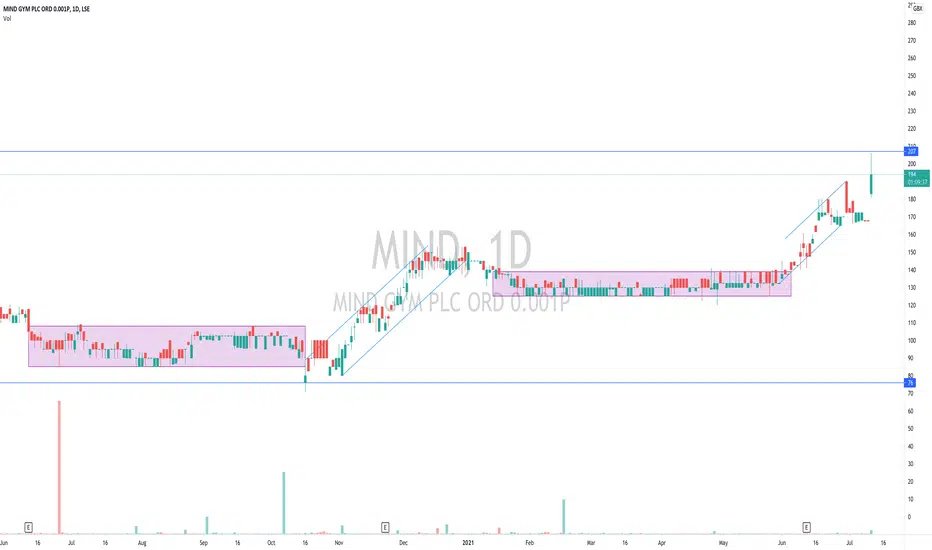
Closing in on a buying opportunity ?Possible Zig Zag looking to complete around the 50 to 60 region.

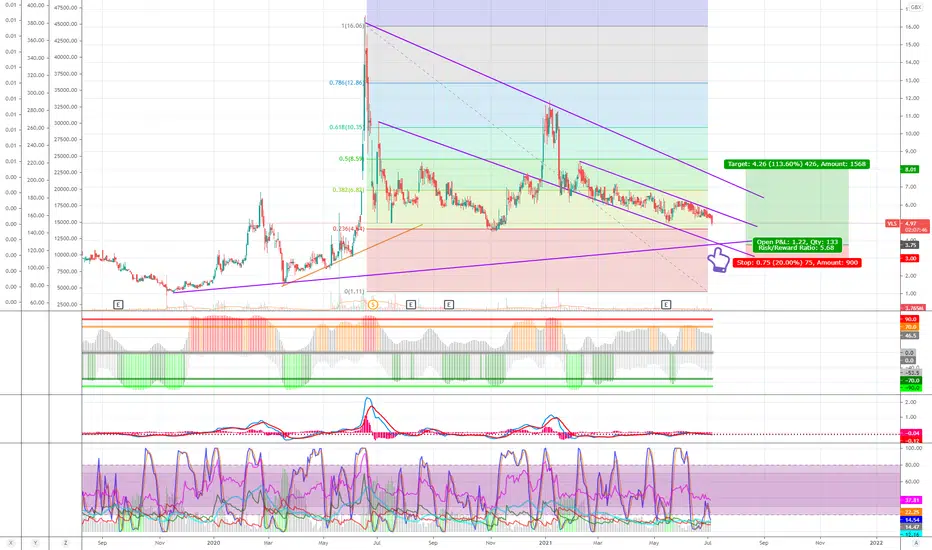
LSE:VLS could be just about done retracing hereFollowing on from my published Jan 2020 idea (also VLS) and taking profits 6 months later at 12p (almost 6x gains) I'd say it looks like VLS could be just about done retracing here.....
..... time to re-enter and start scaling back in from 5p downwards.
My 'gut' says we could dip as low as 3.75p (pointed out on the chart) by the end July - maybe with a spike past that before continuing any significant upwards movement September onwards.
8.5p looks like a solid resistance line to TP, but we need to break above the midline (for those who'd rather wait for reversal confirmation) to cancel the down trend - After 8.5p going to free roll - moving stops up as we go - this could be an epic journey - much the same as 1.2 to 16 was in Q4 '19 to Q2 20 - even with the global pandemic crash.
So for now - I've bought back the shares I sold at 12p and will be adding both DCA and ladder buying in increasing sizes to 3p
For those not in the know - this is BIG news !!
Sustainable aviation fuel (SAF) produced by the Company's proprietary technology using woody biomass residue feedstock has been used in a commercial flight by Japan Airlines (JAL).
Japan Airlines flight (JAL #515) from Tokyo to Sapporo was completed on 17 June 2021.
(Don't forget to thumbs up if you agree / like my idea)
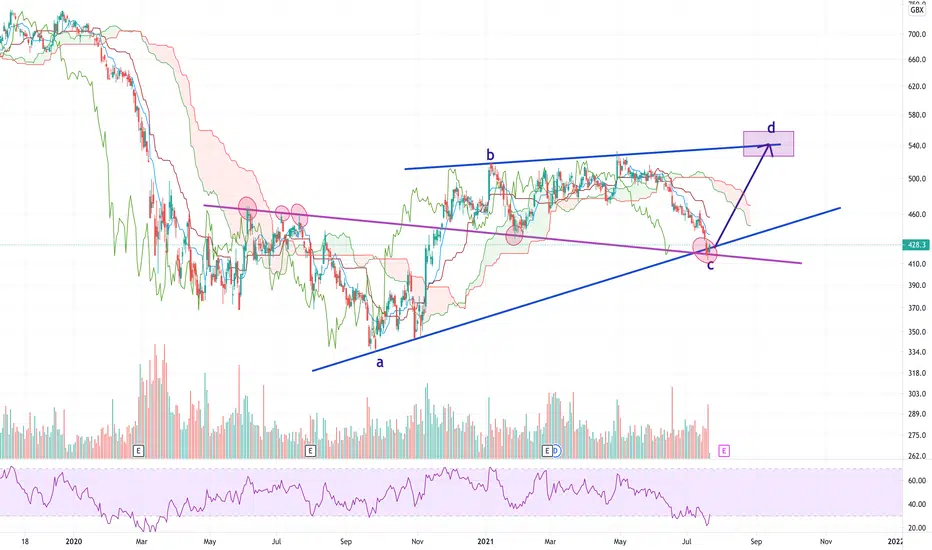
Trading Idea - #CeresPower short-termBUY
ENTRY: 1206 GBX
TARGET: 1021 GBX (+ 18% profit)
STOP: 910 GBX
Ceres Power Holdings is a UK based company active in the field of fuel cell technology and engineering.
1.) Current support at 986.0 GBX appears to hold. That enables a buying opportunity.
2.) The profit expectations have been revised downwards significantly in recent months. Therefore, I only see a short-term buying opportunity.

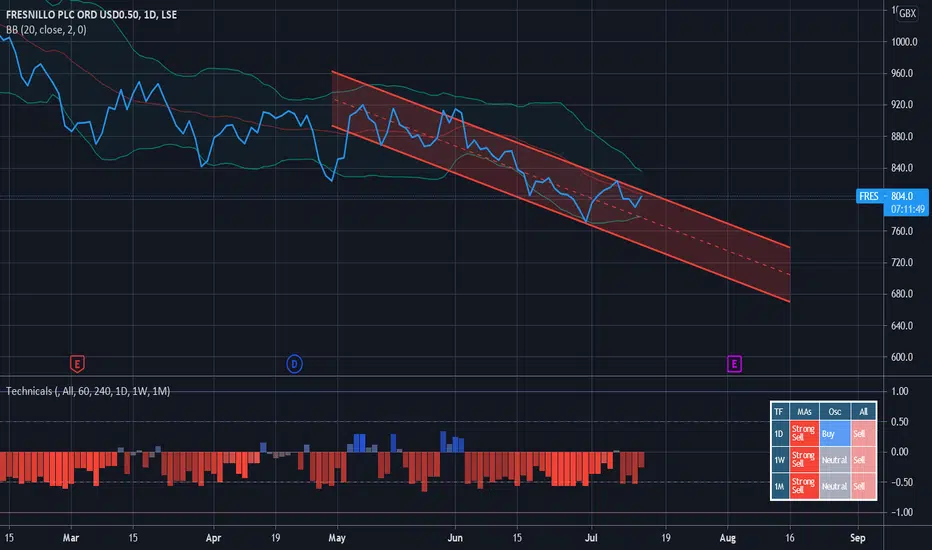
FRES - Descending Channel and BB testingSince May FRES has been descending in a fairly well defined channel. I anticipate this to continue dropping beyond earnings report on 3 Aug. Furthermore, share price is not testing the upper Bollinger Band and hardly testnig the mid line. My target for entry or top up is sub 700p where it will be exceptional value. From that level expect a long and protracted rise into Q3. If you agree please give me a thumbs up. Good Luck. Posting is my opinion only.
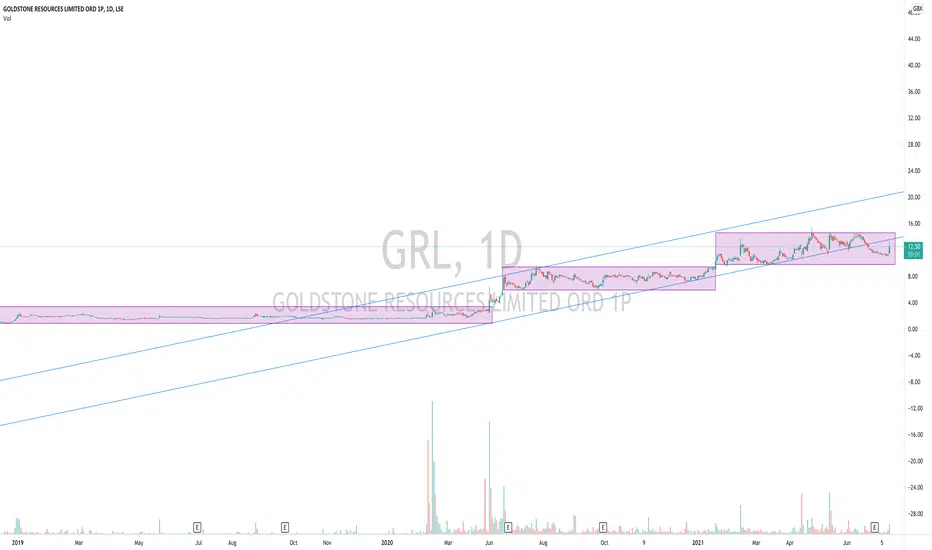
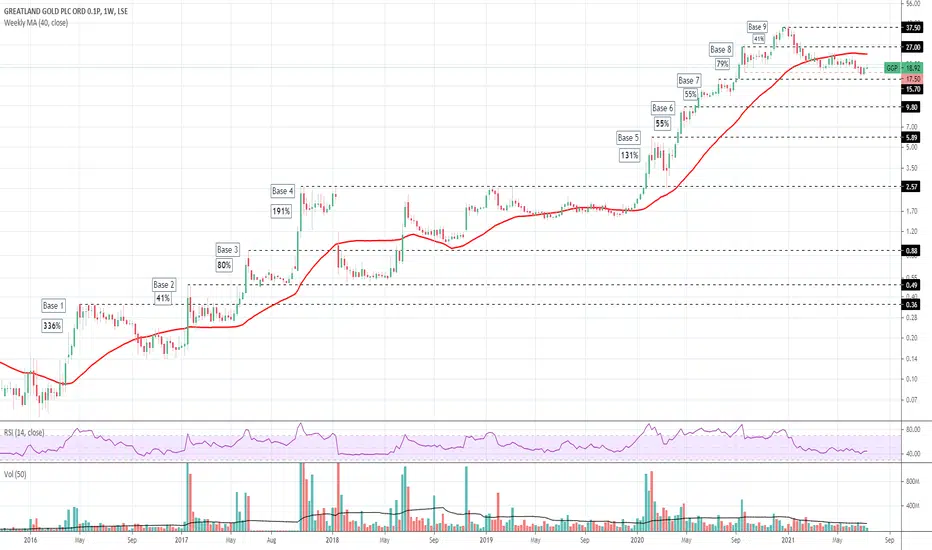
GRL GRL generally seems in an ascending channel but repeatedly enters consolidation zones with good support - what next ? will buyers take it higher?
no advice given