Future PLC: A Compelling Buy with a Bright OutlookIn the ever-evolving landscape of digital publishing and price comparison, LSE:FUTR Future PLC stands out as a beacon of robust growth and potential. Founded in 1985 and headquartered in Bath, the United Kingdom, Future PLC has carved a niche for itself by publishing and distributing content across a spectrum of sectors including games, entertainment, technology, sports, and more. With its shares currently priced at an attractively low point, there’s a strong case to be made for considering Future PLC as a buy trade, with a current buy-in at 700 and ambitious targets of 1,400 and 2,100.
Encouraging Performance and Strategic Growth
Future PLC's recent first-half trading update has been met with optimism, described by analysts as "encouraging" and "broadly reassuring". The company has demonstrated a return to organic revenue growth, a testament to the effectiveness of its diversified business model that spans Media and Magazine segments. This rebound is particularly notable in its operations such as Go.Compare, B2B, and Magazines, despite the headwinds faced in affiliate products and digital advertising amid macroeconomic uncertainties.
The stabilisation in website user trends and the initial progress of the Growth Acceleration Strategy (GAS) underscore the company's adaptive and forward-looking management approach. Analyst Jessica Pok from Panmure Gordon remarked on these developments as positive signs, highlighting the stock's attractive valuation at just 5 times FY25E PE.
Valuation and Market Position
One cannot overlook the compelling valuation metrics that underscore Future PLC's investment appeal. Currently trading at a PE ratio of just 6.9, the company is significantly undervalued when compared to the peer average of 11.8. This discrepancy not only points to the stock’s anomalously low price but also signals substantial upside potential. Should Future PLC’s PE ratio align with the sector average, the implications for its share price could be profound, elevating it well beyond its current level of 700.
Moreover, based on a discounted cash flow model, Future PLC's fair value is estimated at 2,597, suggesting that the shares are currently 73.7% undervalued. This valuation presents a compelling case for the stock as a buy, with the current price offering a substantial margin of safety and an attractive entry point for investors seeking both growth and value.
Looking Ahead
As Future PLC continues to implement its strategic initiatives under the GAS, there is a keen anticipation of improved performance in affiliate and digital advertising revenues. This improvement, as broker Roddy Davidson at Shore Capital suggests, will be pivotal for a meaningful recovery in share price and for gaining traction across its growth strategies.
The digital publishing and price comparison sectors are replete with challenges but also abundant with opportunities. Future PLC, with its diversified portfolio, strategic growth initiatives, and currently undervalued shares, presents an enticing prospect for investors looking to capitalise on these opportunities. Its low PE ratio, compared to peers, and the significant undervaluation based on fair value, all point to Future PLC not just as a stock to watch, but as a compelling buy in today's market.
For investors and traders alike, the current valuation of Future PLC offers a rare convergence of growth prospects and value, making it a standout choice in the dynamic and competitive landscape of digital media and financial services.

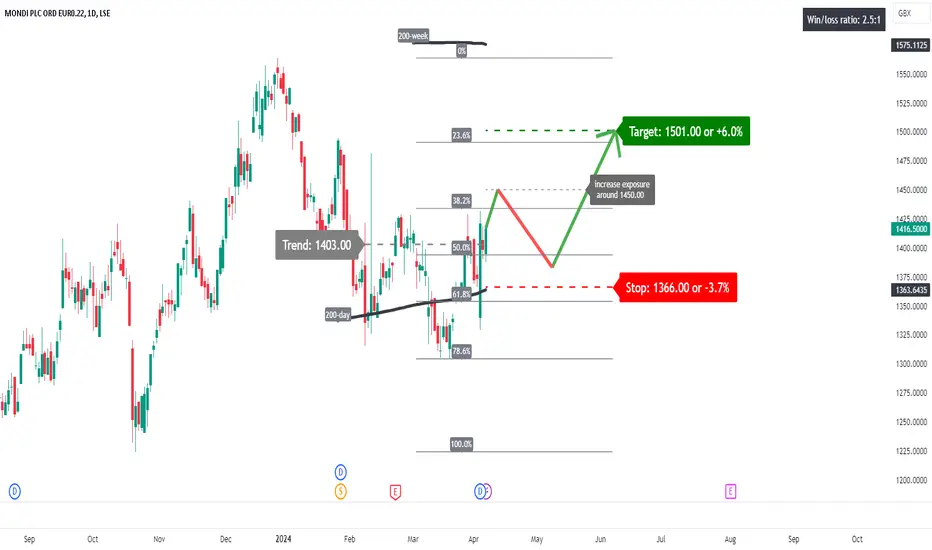
MNDI: building a base?A price action above 1403 supports a bullish trend direction.
The 200-day simple moving average might act as major support.
Increase long exposure for a break above 1450.
The target price is set at 1501 (just above its 23.6% Fibonacci retracement level).
The stop-loss price is set at 1366 (its 200-day simple moving average).
Remains a risky trade.
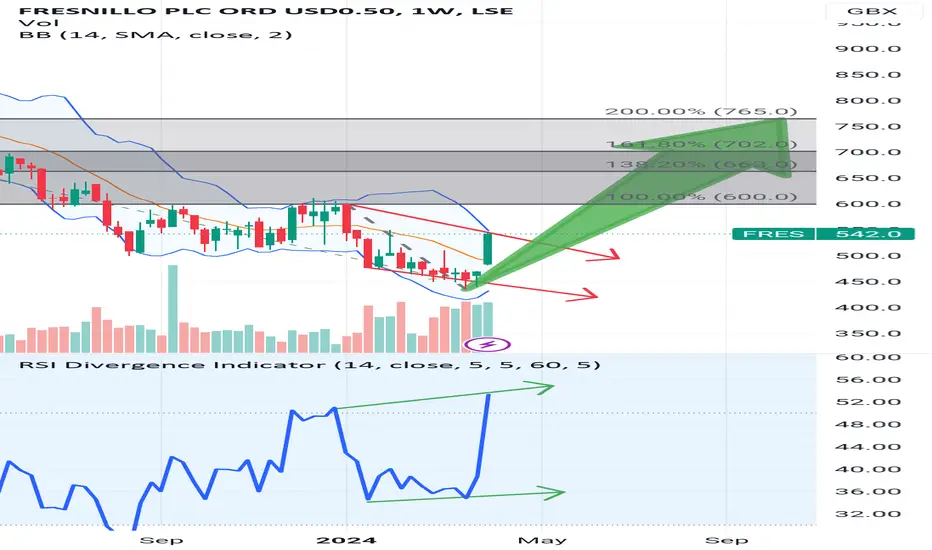
FRES Strong Buy...Swift rerate to short term target 765p Strong buy... Silver equivalent sales up circa 25% the decline in earnings has bottomed and FRES is now coming out the other side with the potential of some serious cash accruals.
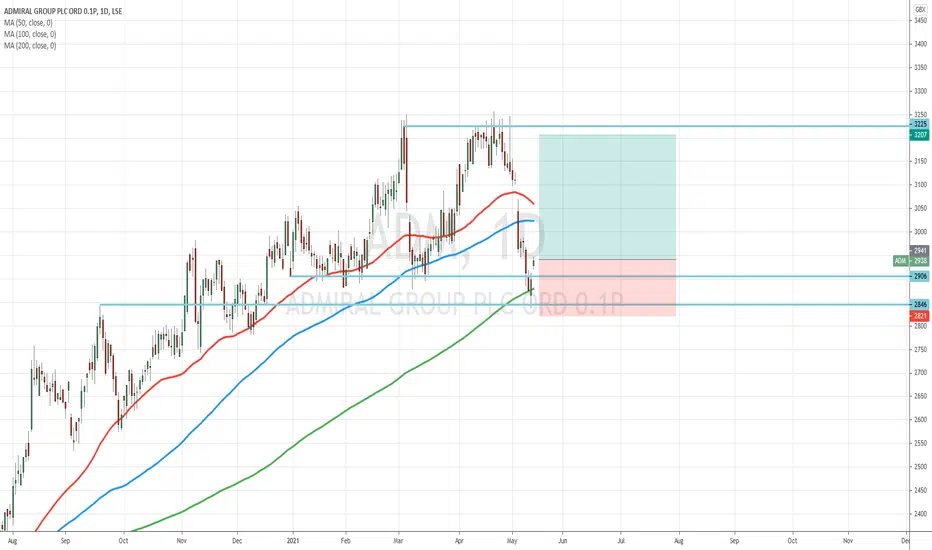
ADMIRAL GROUP PLC Long from Support / 200 MA lineLooks to me like a healthy correction, now bounced of support of the 200 ma line and also previous top and is again above the main support. Nice R/R ration of 2.22
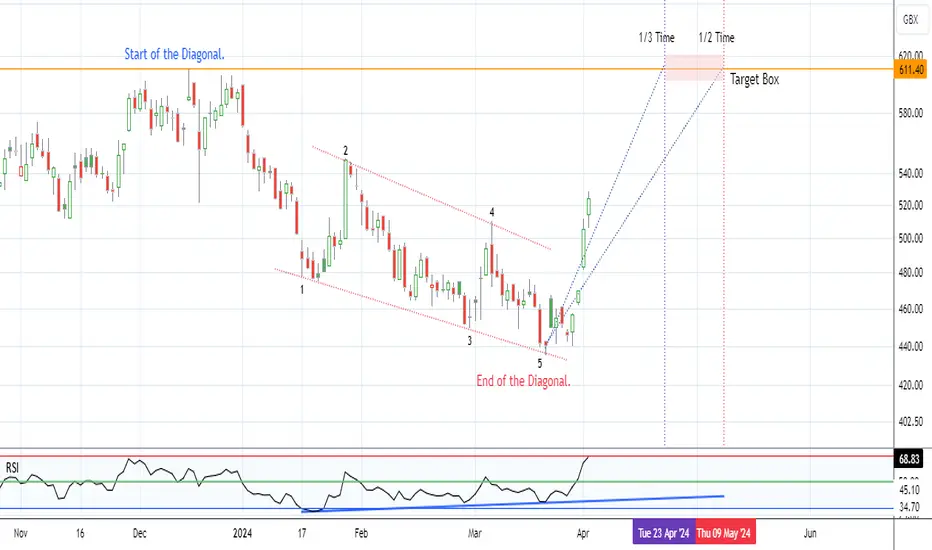
Time & price target.When a diagonal pattern completes, it can retrace the entire move in between a third of the time and half of the time it took to form.
Let's see if this happens...
Don't mind if you do I like this pattern, in other TA metrics that are mine this has triggered long a while back, Is the chart telling us that decision from the UK gooberment are going to do something? ..brown envelope ahoy ...GL ..I'm already long wish me luck..
TUI - 1 year HEAD & SHOULDERS══════════════════════════════
Since 2014, my markets approach is to spot
trading opportunities based solely on the
development of
CLASSICAL CHART PATTERNS
🤝Let’s learn and grow together 🤝
══════════════════════════════
Hello Traders ✌
After a careful consideration I came to the conclusion that:
- it is crucial to be quick in alerting you with all the opportunities I spot and often I don't post a good pattern because I don't have the opportunity to write down a proper didactical comment;
- since my parameters to identify a Classical Pattern and its scenario are very well defined, many of my comments were and would be redundant;
- the information that I think is important is very simple and can easily be understood just by looking at charts;
For these reasons and hoping to give you a better help, I decided to write comments only when something very specific or interesting shows up, otherwise all the information is shown on the chart.
Thank you all for your support
🔎🔎🔎 ALWAYS REMEMBER
"A pattern IS NOT a Pattern until the breakout is completed. Before that moment it is just a bunch of colorful candlesticks on a chart of your watchlist"
═════════════════════════════
⚠ DISCLAIMER ⚠
The content is The Art Of Charting's personal opinion and it is posted purely for educational purpose and therefore it must not be taken as a direct or indirect investing recommendations or advices. Any action taken upon these information is at your own risk.

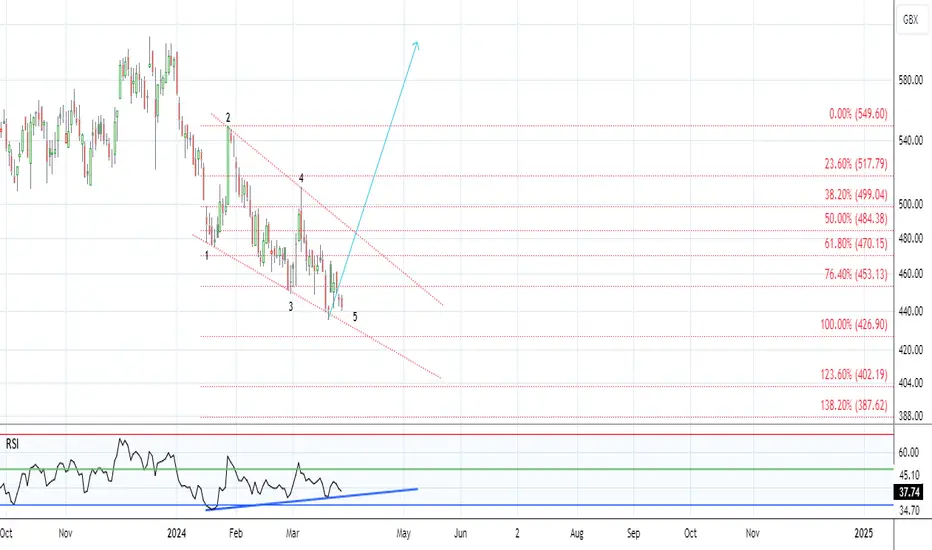
Is the ending diagnal pattern close to completion?As long as the price doesn't go lower than the £420–£415 level, then the ending diagnal pattern looks on. However, if the price breaks below that level, then another pattern could be playing out.
Lloyds Bank Analysis - Continuous, Just as the Markets !This is a Thread, so Follow for Technical Analysis performed with TrapZone Pro & UMVD Indicators.
* Trend is Based on TrapZone Color
* Bar Colors give us Momentum Green from strong Up Moves. Red Bars point to strong Down Moves.
* Red UMVD = Selling Pressure & Green UMVD = Buying Pressure. Purple is for Divergence = Battle of Supply & Demand
--------------------
1-23-2024
Strong downtrend with RED TrapZone established for days now. Price is retracing a bit with GREEN UMVD coming in now. Bunch of Trapped Buyers !

LLOY, Gap Upward after cross a resistanceAfter a formation of a double bottom, we can see the price crossing the two resistance levels.
Making a Gap on Thurdays Open.
DMI is showing some bullish strength, RSI is at an extreme of overbought. Volume is increasing right now, after decreasing on Thursdays.
WIth these factors, the price it will probably try to close the gap or even test the new support level.

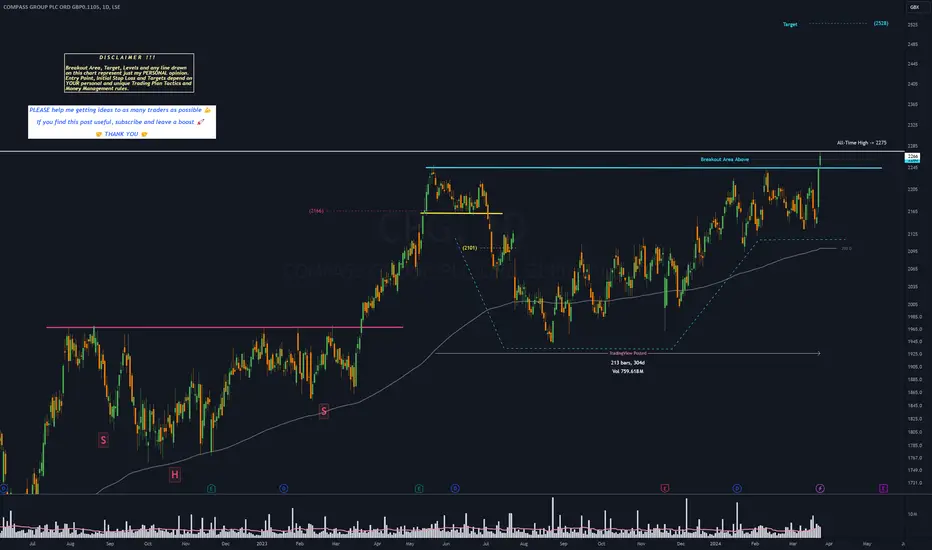
CPG - 10 months CUP & HANDLE══════════════════════════════
Since 2014, my markets approach is to spot
trading opportunities based solely on the
development of
CLASSICAL CHART PATTERNS
🤝Let’s learn and grow together 🤝
══════════════════════════════
Hello Traders ✌
After a careful consideration I came to the conclusion that:
- it is crucial to be quick in alerting you with all the opportunities I spot and often I don't post a good pattern because I don't have the opportunity to write down a proper didactical comment;
- since my parameters to identify a Classical Pattern and its scenario are very well defined, many of my comments were and would be redundant;
- the information that I think is important is very simple and can easily be understood just by looking at charts;
For these reasons and hoping to give you a better help, I decided to write comments only when something very specific or interesting shows up, otherwise all the information is shown on the chart.
Thank you all for your support
🔎🔎🔎 ALWAYS REMEMBER
"A pattern IS NOT a Pattern until the breakout is completed. Before that moment it is just a bunch of colorful candlesticks on a chart of your watchlist"
═════════════════════════════
⚠ DISCLAIMER ⚠
The content is The Art Of Charting's personal opinion and it is posted purely for educational purpose and therefore it must not be taken as a direct or indirect investing recommendations or advices. Any action taken upon these information is at your own risk.
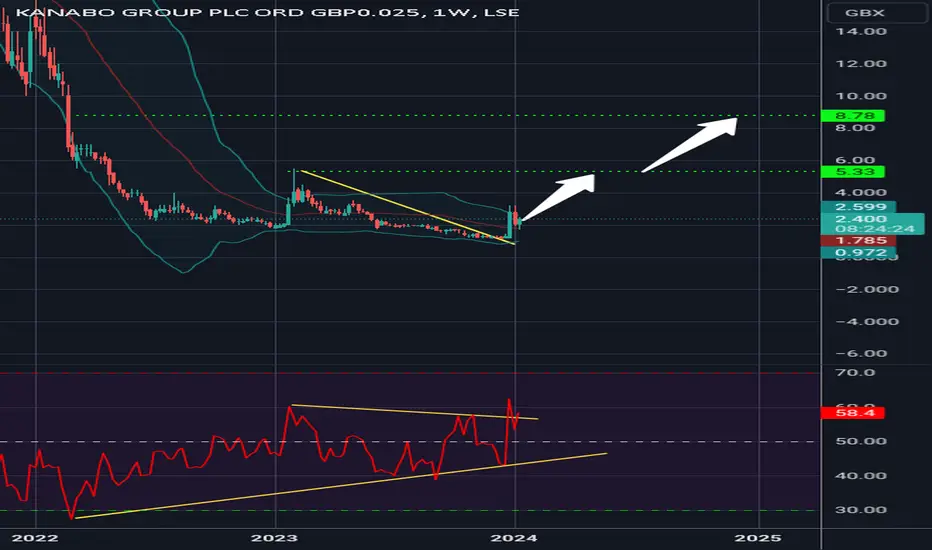
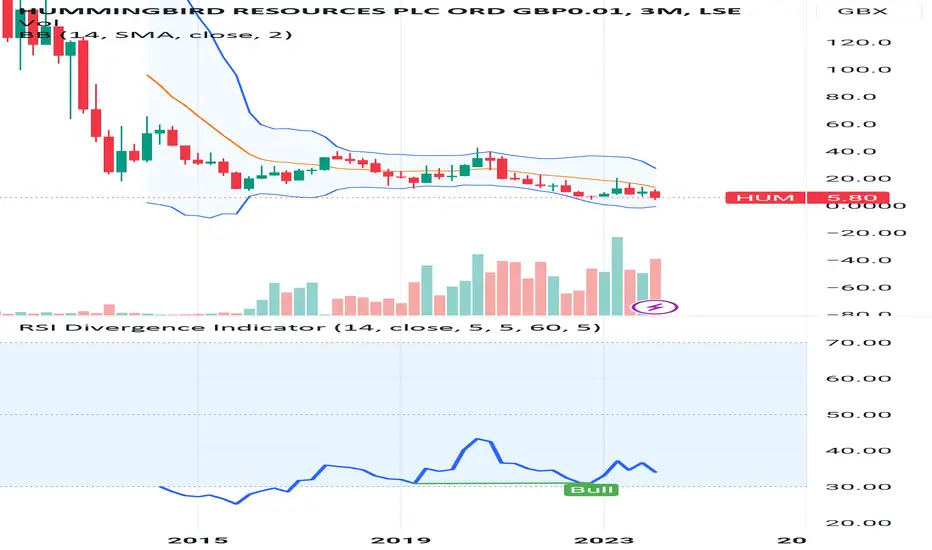
20 bags the offering...HUGE upside confirmed by 3 month chart3 month sessio might be a bit long term for alot of people but the fundamentals are also supporting this one.
Penny stock Gold Producer about to take the leap into mid tier status. Watch for news about the current contractor dispute as once resolved the DCF valuations will become the driver of the market valuation.
This is the one that could change your life.
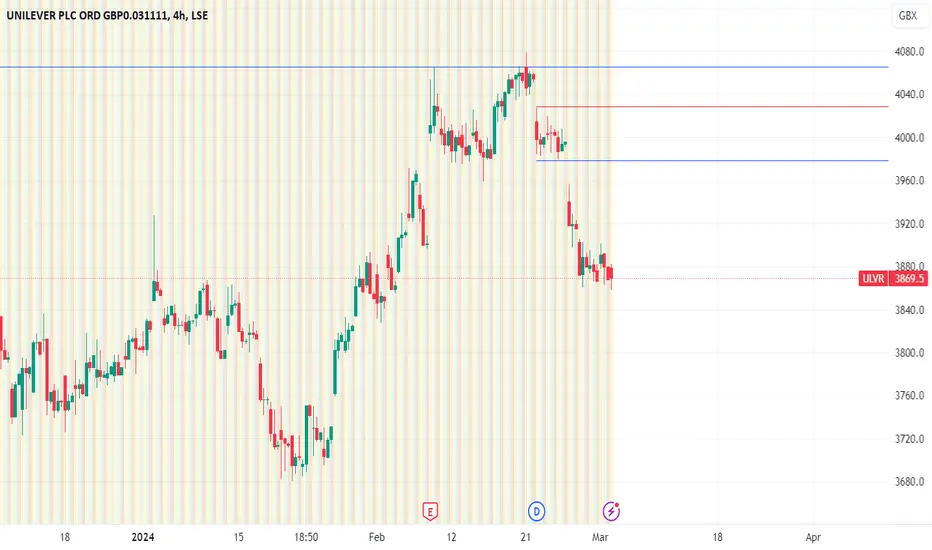
ULVR, a British stock, looking to sell.Price is dropping from Weekly Supply. This is a good Daily Supply created on the way.
LLOY Pull Back Think we see a bit of a pull back on Lloyds from here. Would be looking at least the 50% line with a bit of luck.

Rolls Royce is facing a long-term resistance lineWeekly chart, the stock is facing a long-term resistance line (started Jan 2014, dashed grey-colored line); so it needs strong bullish power to beat.
After crossing this resistance, the target will be 615
Technical indicators: MACD is positive, RSI is showing over-bought - which indicates tendency to have some correction.

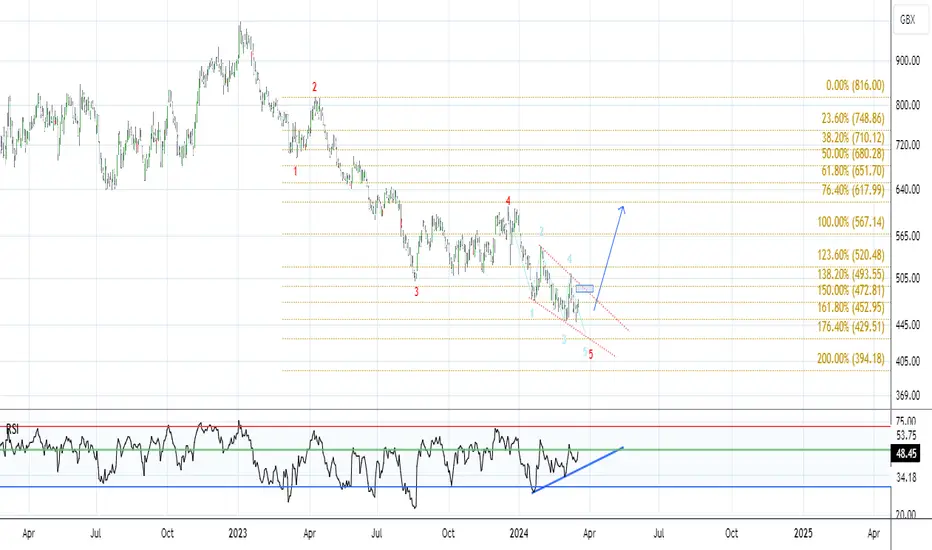
Ready for a big move. looks like it’s either completed an Ending Diagonal in a 5th wave or it needs one more move down for its completion.
Either way, with the massive negative divergence shown in the RSI, it looks ready for a big move up.
BP. - 4 months HEAD & SHOULDERS══════════════════════════════
Since 2014, my markets approach is to spot
trading opportunities based solely on the
development of
CLASSICAL CHART PATTERNS
🤝Let’s learn and grow together 🤝
══════════════════════════════
Hello Traders ✌
After a careful consideration I came to the conclusion that:
- it is crucial to be quick in alerting you with all the opportunities I spot and often I don't post a good pattern because I don't have the opportunity to write down a proper didactical comment;
- since my parameters to identify a Classical Pattern and its scenario are very well defined, many of my comments were and would be redundant;
- the information that I think is important is very simple and can easily be understood just by looking at charts;
For these reasons and hoping to give you a better help, I decided to write comments only when something very specific or interesting shows up, otherwise all the information is shown on the chart.
Thank you all for your support
🔎🔎🔎 ALWAYS REMEMBER
"A pattern IS NOT a Pattern until the breakout is completed. Before that moment it is just a bunch of colorful candlesticks on a chart of your watchlist"
═════════════════════════════
⚠ DISCLAIMER ⚠
The content is The Art Of Charting's personal opinion and it is posted purely for educational purpose and therefore it must not be taken as a direct or indirect investing recommendations or advices. Any action taken upon these information is at your own risk.

ANTO - 33 months HEAD & SHOULDERS══════════════════════════════
Since 2014, my markets approach is to spot
trading opportunities based solely on the
development of
CLASSICAL CHART PATTERNS
🤝Let’s learn and grow together 🤝
══════════════════════════════
Hello Traders ✌
After a careful consideration I came to the conclusion that:
- it is crucial to be quick in alerting you with all the opportunities I spot and often I don't post a good pattern because I don't have the opportunity to write down a proper didactical comment;
- since my parameters to identify a Classical Pattern and its scenario are very well defined, many of my comments were and would be redundant;
- the information that I think is important is very simple and can easily be understood just by looking at charts;
For these reasons and hoping to give you a better help, I decided to write comments only when something very specific or interesting shows up, otherwise all the information is shown on the chart.
Thank you all for your support
🔎🔎🔎 ALWAYS REMEMBER
"A pattern IS NOT a Pattern until the breakout is completed. Before that moment it is just a bunch of colorful candlesticks on a chart of your watchlist"
═════════════════════════════
⚠ DISCLAIMER ⚠
The content is The Art Of Charting's personal opinion and it is posted purely for educational purpose and therefore it must not be taken as a direct or indirect investing recommendations or advices. Any action taken upon these information is at your own risk.
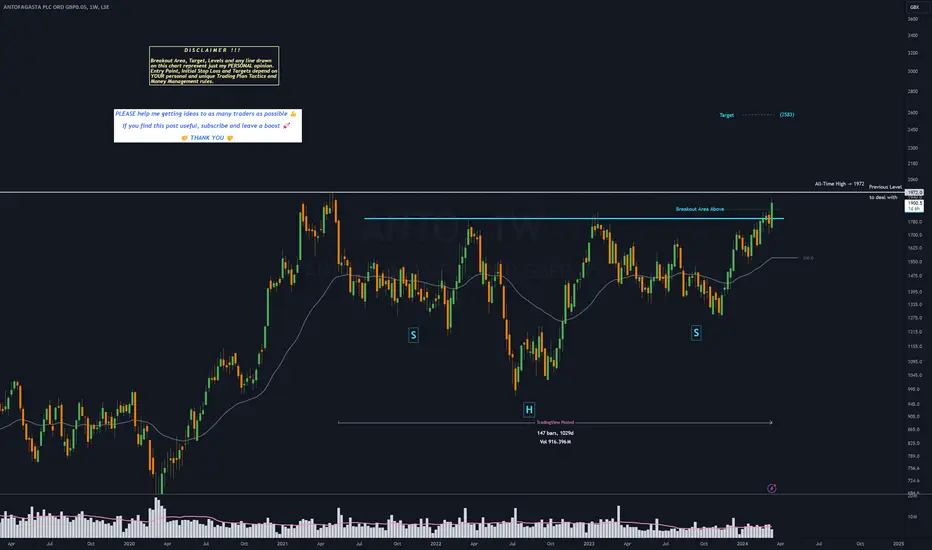
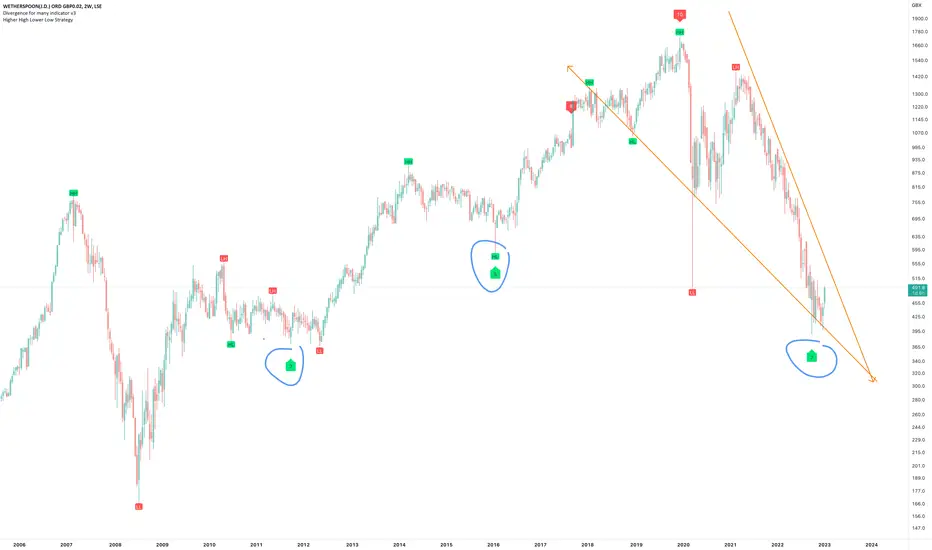
JD Wetherspoon PlcOn the above 2-week chart price action has corrected 75% since the sell signal (not shown) in October 2019 @ 1600. Now is an excellent moment for a long trade position. Why?
1) A strong buy prints (not shown).
2) Strong bullish divergence. Blue circles. Look left.
3) Falling wedge is yet to breakout however with points 1 and 2 we can be confident in the direction.
4) The UK economy is circling the drain hole, it makes sense alcohol consumption will be on the up!
Is it possible for price action to fall further? For sure.
Is it probable? No.
Ww
Type: trade. Yes trade, not investment.
Risk: <=6% of portfolio
Timeframe: Don’t know.
Return: Don’t know
Stop loss: <=$380
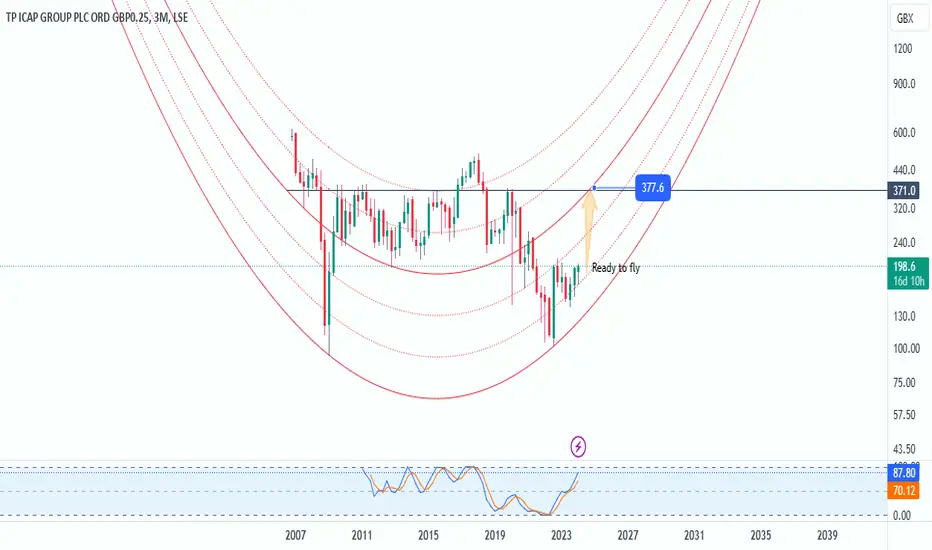
TP ICAP (TCAP.L) Potential Breakout, Eyeing $374 TargetThe stock is currently hovering around $198 and analysts are closely monitoring its potential to break through resistance levels.
Positive Revenue News Fuels Optimism:
This recent interest comes on the heels of the company's positive earnings report for fiscal year 2023. TP ICAP reported revenue of GBP 2.19 billion, indicating continued growth within the company.
Breakout Potential:
Technical analysts suggest that TCAP.L is nearing a breakout from its current resistance level of around $198. A successful breakout could lead to a significant increase in the stock price.
not be considered financial advice.
Monthly chart of Aviva - triangle still formingTriangle forming since the year 2000.
Good results today, but it's hitting overhead resistance at 470 established in 2002 and 2019.
No clear breakout yet and needs to add another 100p before it can start to consider a breakout.

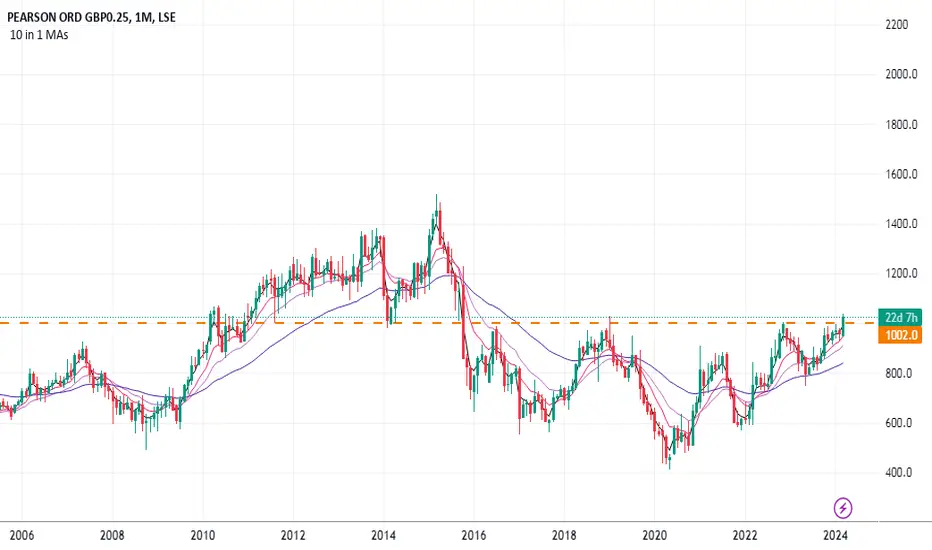
Pearson Break-OutPearson broken out of clear resistance. Target 1480, being near the high of a few years ago, a target supported by the depth of the H&S visible on the monthly chart.