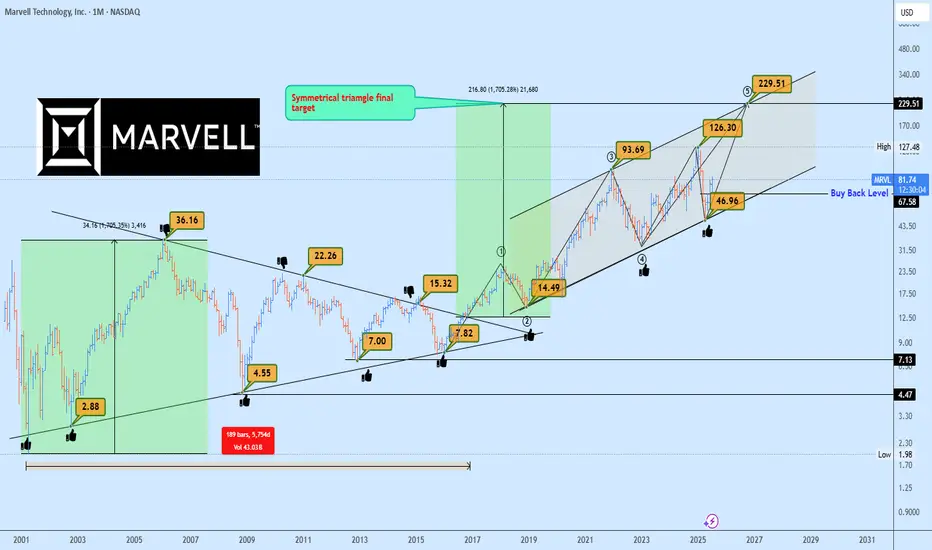
MRVL Massive 15-Years Symmetrical Breakout Targets AheadMarvell Technology (MRVL) has just completed a monumental breakout from a 15-years symmetrical triangle, a rare and powerful long-term accumulation structure. This type of macro consolidation typically precedes a major directional expansion, and in this case, the breakout confirmed bullish continuation.
Currently, MRVL is forming a rising channel structure, with price bouncing cleanly from the lower boundary confirming demand and the continuation phase of the macro move.
The 1:1 projection from the symmetrical triangle gives us a clear target trajectory, with the final leg potentially extending to $229, aligning perfectly with the upper boundary of the rising channel.
In the short to mid-term, the ideal buyback opportunity rests near $67.50, should the market retest previous breakout support or the lower boundary of the channel once more. This zone offers asymmetric risk-to-reward potential for long-term investors and swing traders alike.
Key Targets
📈 $67.50 – Buyback Opportunity Zone
📈 $229 – Rising Channel Top / 1:1 Expansion Target
A breakout this large is no coincidence, it’s backed by years of price compression and institutional positioning. Now is the time to watch closely.
📩 Drop your view in the comments and share your stock requests for quick analysis.
Only stock assets will be accepted under this post.
Apple (AAPL) Shares Jump Following Earnings ReportApple (AAPL) Shares Jump Following Earnings Report
Yesterday, after the close of the regular trading session, Apple released its earnings report, which surpassed analysts’ expectations:
→ Earnings per share: actual = $1.57, forecast = $1.43;
→ Revenue: actual = $94.04 billion, forecast = $89.35 billion.
As a result, AAPL shares surged in the post-market, rising from $207.57 to $212.51.
Media Commentary:
→ The company reported a 13% year-on-year increase in iPhone sales.
→ However, according to Tim Cook, tariffs have already cost the company $800 million and this figure could exceed $1 billion in the next quarter.
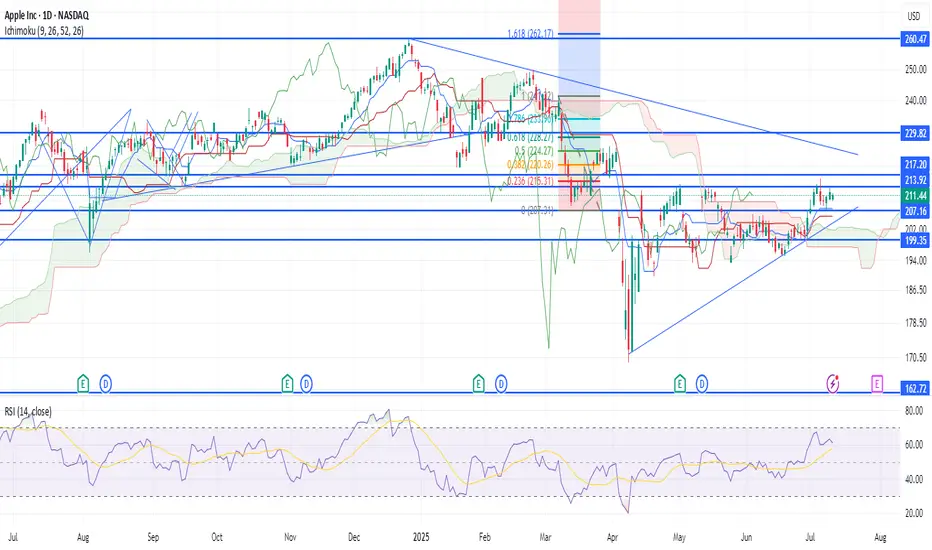
Technical Analysis of the Apple (AAPL) Stock Chart
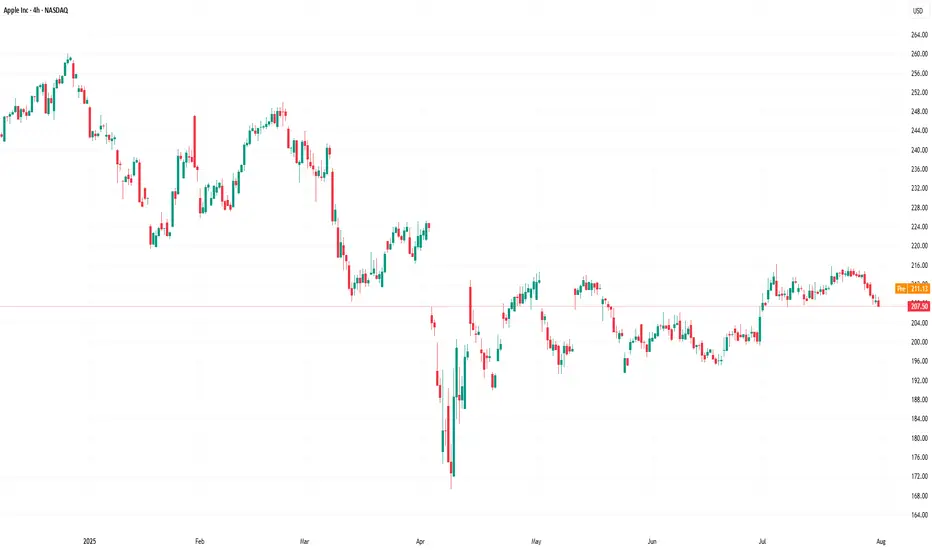
Following the volatility in April 2025, price action has justified the construction of an ascending channel (marked in blue). The $216 level, which has acted as a key reference point since March, remains a significant resistance area, because:
→ It has consistently prevented AAPL from reaching the upper boundary of the channel;
→ Even in the wake of a strong earnings report, the price failed to break through this level in post-market trading.
If the $216 level continues to cap gains in the coming days – despite the positive report – the stock might pull back towards the median line of the blue channel (following the post-market rally). This zone often reflects a balance between supply and demand. While such a retracement would appear technically justified, it may raise concerns among shareholders, particularly when compared to the more aggressive price rallies seen in the shares of other tech giants, such as Microsoft (MSFT), as we discussed yesterday.
From a more pessimistic perspective, peak A may turn out to be yet another lower high within a broader bearish structure that has been forming on the AAPL chart since December 2024, when the stock reached its all-time high around the $260 level.
This article represents the opinion of the Companies operating under the FXOpen brand only. It is not to be construed as an offer, solicitation, or recommendation with respect to products and services provided by the Companies operating under the FXOpen brand, nor is it to be considered financial advice.
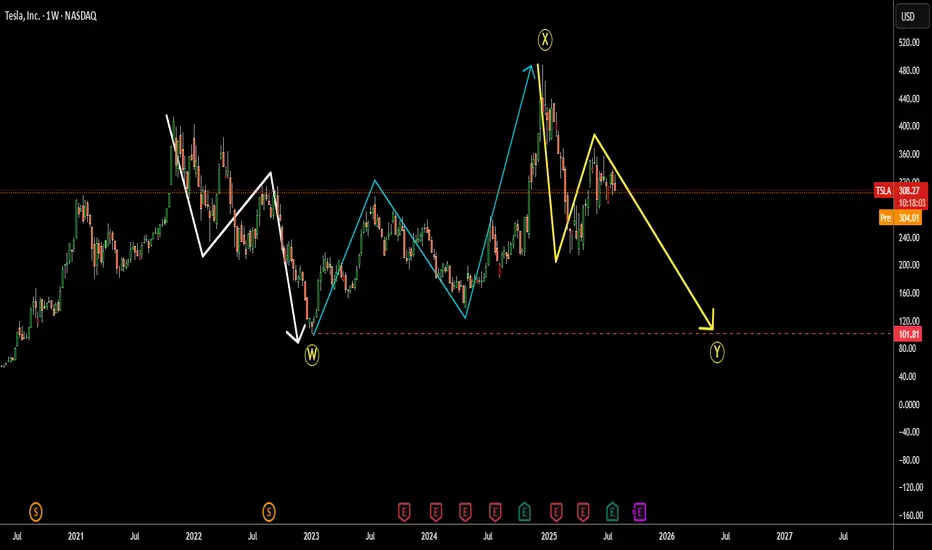
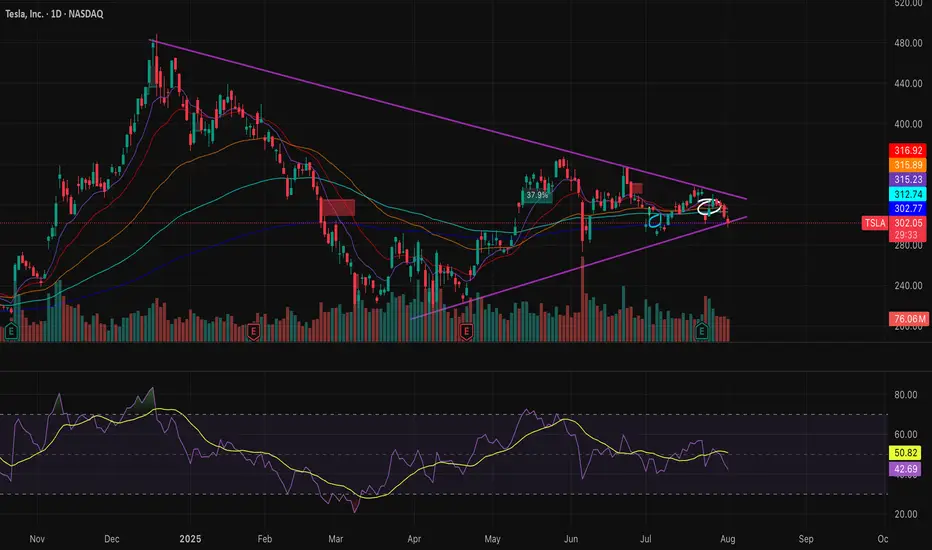
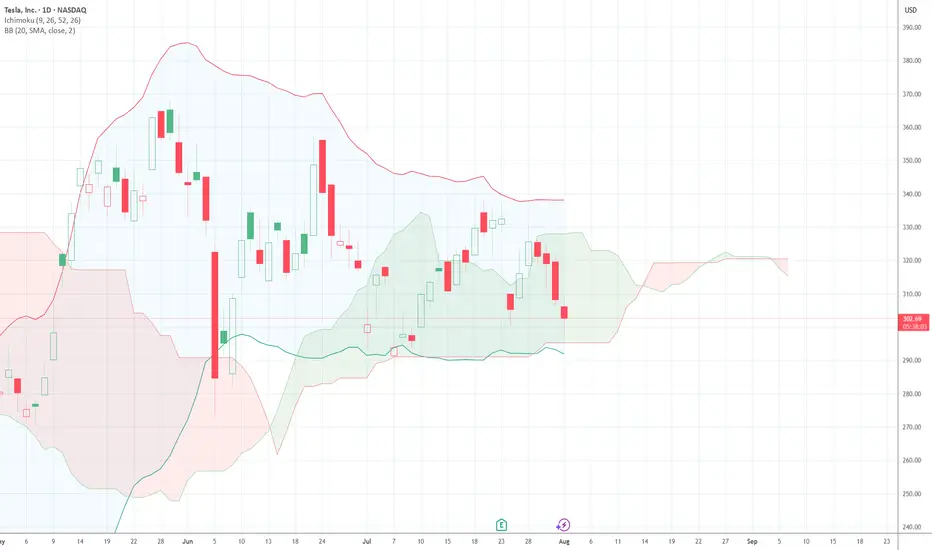
Tesla (TSLA) Crash Ahead? $101.81 Retest in SightThe Tesla price chart appears to show a large flat correction labeled W-X-Y.
Wave W consists of three downward waves from 2021 to 2023. (white)
Wave X shows a three-wave upward retracement from 2023 to 2024, which even overshot the start of wave W. (blue)
Now, we seem to be in the final leg of the third move: wave Y down. (yellow)
Typically, wave Y retests the bottom of wave W.
If that holds, we could see Tesla’s price revisit the 2023 low of $101.81.
Is Tesla losing its appeal?
I’d love to hear your thoughts.
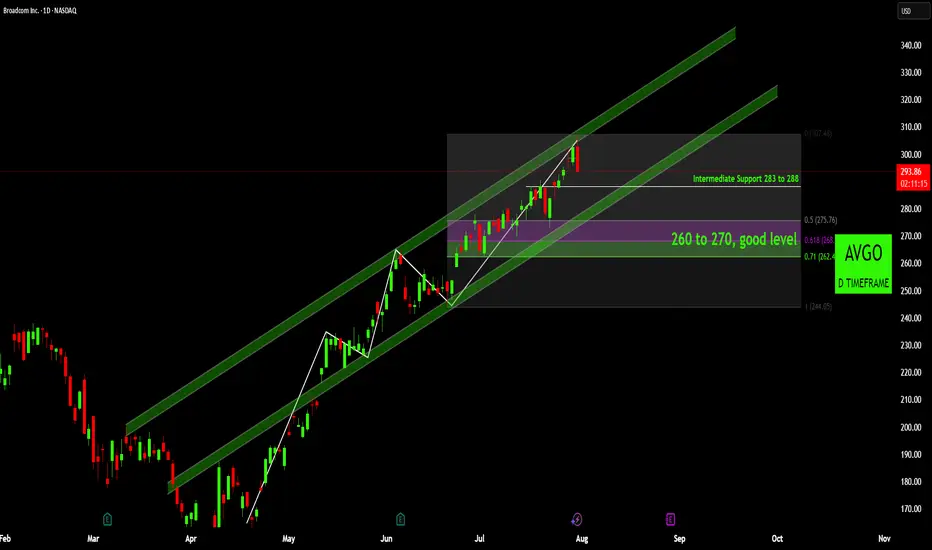
Broadcom (AVGO): Is This the Dip You've Been Waiting For?Broadcom (AVGO) has been demonstrating a remarkably strong bullish trend since early April, carving out a clear path of higher highs and higher lows. This robust upward momentum is well-defined by a series of ascending channels.
Trend and Channel Dynamics:
Initially, we observed price action moving steadily within a well-established ascending green channel. The stock showed consistent respect for the channel's boundaries, indicating controlled yet persistent buying pressure. More recently, AVGO broke out above the upper boundary of this initial channel, suggesting an acceleration in momentum. This breakout led the stock into a new, steeper ascending channel, which it has largely been respecting since late June/early July.
Current Price Action and Retracement:
AVGO is currently trading around the $294.10 mark. After reaching a peak just above $307, the stock appears to be undergoing a healthy pullback. This retracement is a natural part of any strong uptrend, allowing for consolidation and the absorption of profit-taking.
Key Support Levels to Watch:
Intermediate Support ($283 to $288): Our first crucial area of interest is the intermediate support zone between $283 and $288. This level aligns closely with prior areas of consolidation and, importantly, the lower boundary of the most recent ascending channel. A test of this area would be a typical and healthy retest of previous resistance now turned support, and a bounce here would signal continued strength within the current channel.
Key "Good Level" Support ($260 to 270) This zone is highlighted as a "good level" for a reason. It perfectly aligns with key Fibonacci retracement levels from the recent major swing low to high:
The 0.5 Fibonacci level at $275.76 sits just above this zone. The crucial 0.618 Fibonacci level is at $268.28. This 'golden ratio' is frequently a strong reversal point in healthy pullbacks. The 0.71 Fibonacci level at $262.44 reinforces the strength of this broader zone. A move into this 260−270 area would represent a deeper but still very much acceptable retracement within a strong uptrend, offering potentially compelling entry or re-entry opportunities for long-term participants.
Overall Outlook:
The current pullback in AVGO should be viewed as a necessary consolidation within a powerful uptrend rather than a sign of weakness. The stock has demonstrated clear impulsive moves followed by corrective retracements throughout its journey higher, as visually reinforced by the white zigzag line.
We will be closely monitoring how AVGO interacts with the 283−288 intermediate support. A successful hold and bounce from this level would suggest a continuation of the upward trajectory. However, if this level is breached, the 260−270 zone becomes the critical area where fresh buying interest is likely to emerge, presenting a lower-risk entry point for those looking to capitalize on AVGO's impressive run.
In summary, AVGO remains firmly in a bullish posture, and these identified support levels offer tactical insights for managing positions or initiating new ones.
Disclaimer:
The information provided in this chart is for educational and informational purposes only and should not be considered as investment advice. Trading and investing involve substantial risk and are not suitable for every investor. You should carefully consider your financial situation and consult with a financial advisor before making any investment decisions. The creator of this chart does not guarantee any specific outcome or profit and is not responsible for any losses incurred as a result of using this information. Past performance is not indicative of future results. Use this information at your own risk. This chart has been created for my own improvement in Trading and Investment Analysis. Please do your own analysis before any investments.
Why Pay $250K for a $115K Bitcoin? Welcome to Strategy (MSTR)This is already the third article I’ve written about Strategy (formerly MicroStrategy), and for good reason.
You don’t need to be a financial expert to ask: why buy a stock that simply mirrors Bitcoin’s price — but at a massive premium?
No matter how sophisticated the explanations may sound, or how many times you’re told that “if you don’t understand it, it must be brilliant,” the reality is much simpler — and much more absurd.
Buying Strategy today is like paying $250,000 for Bitcoin while the actual market price is $115,000.
It’s not about complexity. It’s about common sense.
I won’t dive too deep into it — no need to fight “financial sophistication” with even more sophisticated words.
The point is simple: buying Strategy is like paying me $10,000 just so I can hold your $10,000 and call it an “innovative capital deployment strategy.”
Sounds smart, right? Until you think about it for more than five seconds.
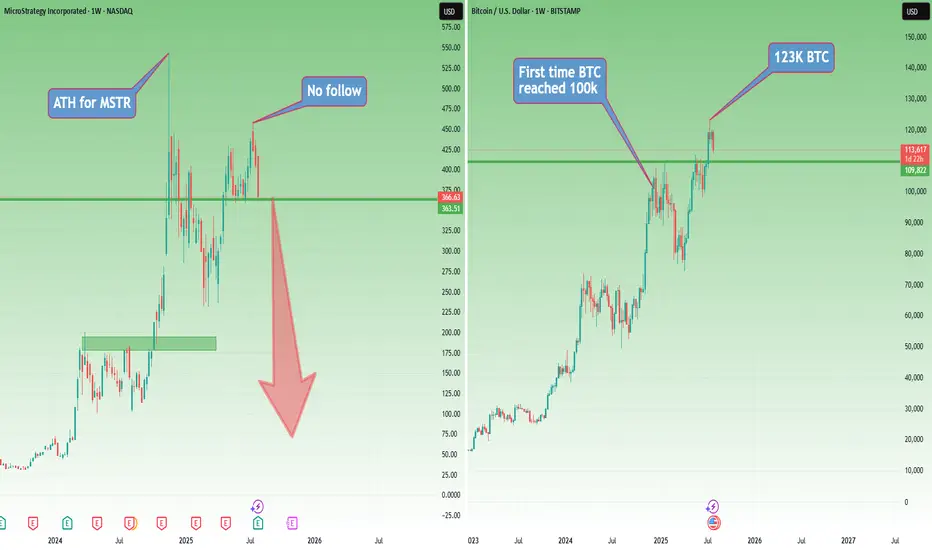
Now let’s look at the posted charts — simple and visual.
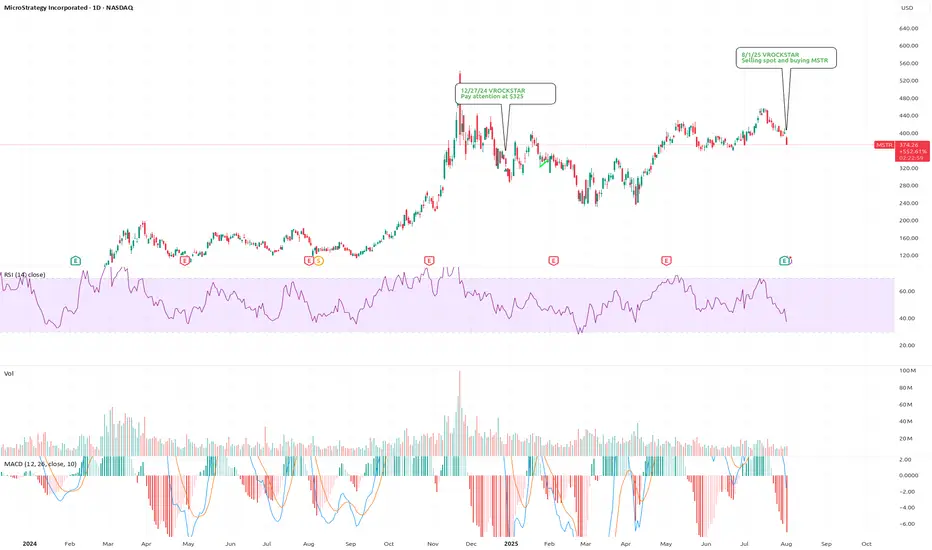
Strategy (MSTR) hit its all-time high in November 2024, right when Bitcoin first reached $100,000.
Then came a sharp correction of more than 50% for the stock.
Fast forward: even though Bitcoin went on to make new all-time highs, Strategy didn’t follow, it seems like people were finally starting to wake up.
When BTC peaked again in mid-July 2025, Strategy only managed to reach $455 — well below its November ATH.
Since then, BTC has pulled back about 10%, while Strategy dropped around 20%.
So much for the “outperformance” argument.
And here’s where things get even harder to justify:
In the past, some institutions bought MicroStrategy because they couldn’t hold Bitcoin directly. Fair enough.
But now? Spot Bitcoin ETFs are live, regulated, widely available, and charge tiny fees — without the leverage, dilution risk, or premium baked into Strategy.
So what’s the excuse now?
Where are we now?
At this moment, even though I’m not too happy about this week’s Bitcoin weakness, I remain cautiously bullish — emphasis on cautiously.
But let’s entertain a scenario.
If Bitcoin continues to correct, Strategy is sitting right on support. And if BTC breaks lower, Strategy will almost certainly follow — breaking support and heading toward the next level.
That next support? Somewhere around $240–250, depending on how deep the Bitcoin pullback goes.
But here’s the real question:
What happens if Bitcoin enters a true bear market?
Will Strategy — which just recently rebranded from MicroStrategy — be forced to rebrand again as…
NanoStrategy?
Just a Saturday thought.
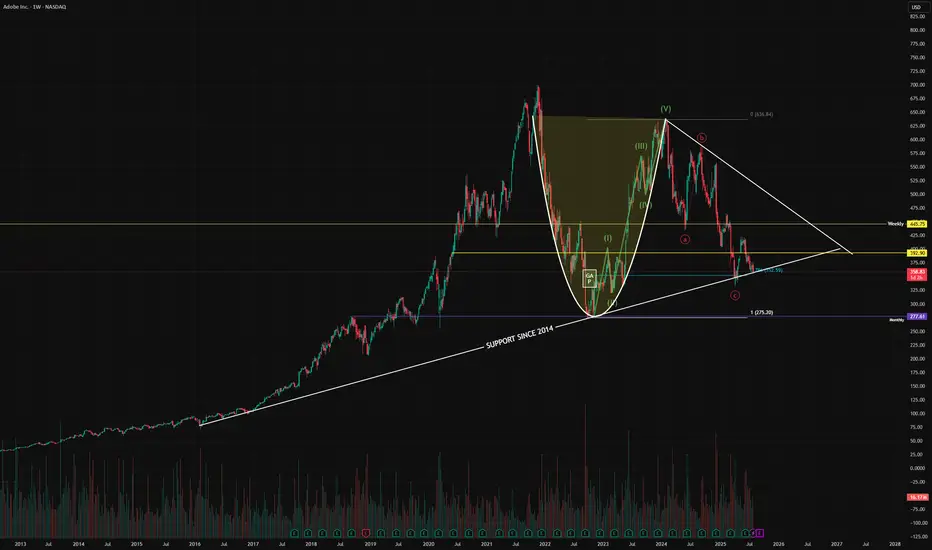
Bottom Feeding - Opportunity?Adobe is sitting on two areas of support - an 11 year old trendline and the 0.786 Fibonacci. It looks like it's coiling up in a giant triangle. This is a steadily growing business with a very sticky product suite. Whilst everyone is falling over themselves to buy Figma at $110, I think it's time to start paying attention to Adobe here.
I believe the AI fear is overdone, if you look at the continued growth in Adobe, their cash flow and continued growth, this is definitely the more compelling buy out of the two. If we lost the trendline support and Fibonacci support, things could indeed get worse.
Not financial advice.
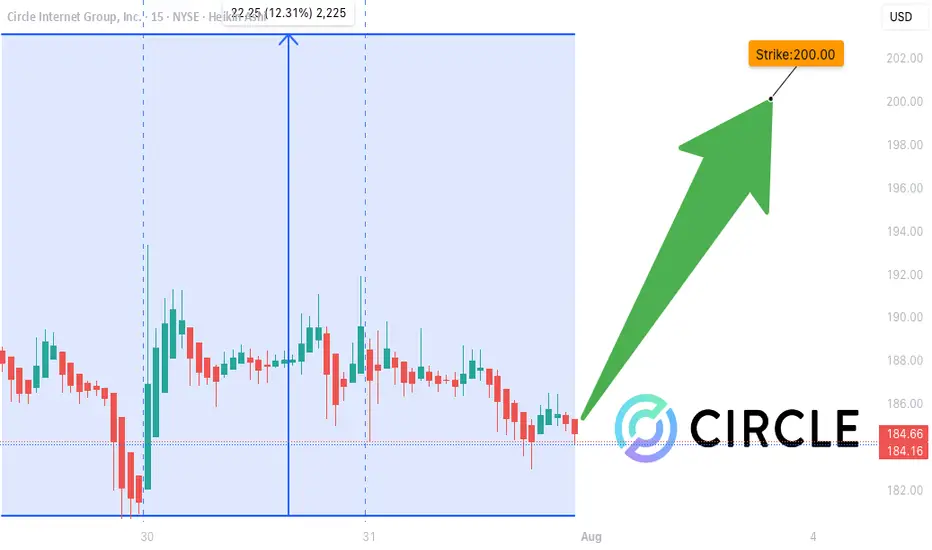
CRCL WEEKLY TRADE SIGNAL (JULY 31)
### 🚨 CRCL WEEKLY TRADE SIGNAL (JULY 31) 🚨
**Call Option Setup – Based on Multi-Model Consensus**
📈 **Momentum**:
🟡 RSI Daily: 46.7 (Neutral)
🟥 Volume: 0.4x last week = 🚨 Weak participation
🟢 Options Flow: Bullish (C/P Ratio = 1.42)
🌤️ VIX: Low (15.4) → Low volatility = 💰 opportunity
🔍 **Model Summary**:
✅ **Grok**: Bullish setup → RECOMMENDED TRADE
❌ Claude, DeepSeek, Gemini, Llama: No trade (weak volume + gamma risk)
🤝 ALL agree: Weak volume & mixed trend = caution
---
### 💥 Trade Setup 💥
🎯 **Direction**: CALL (Bullish bias)
💸 **Strike**: \$200
💰 **Entry**: \$0.85
📆 **Expiry**: Aug 1 (1DTE – high gamma 🔥)
🎯 **Profit Target**: \$1.11
🛑 **Stop Loss**: \$0.51
📊 **Confidence Level**: 65%
📍 **Entry Timing**: Market Open
---
### 🧠 Key Insight
📉 Weak volume = 🚫 no institutional conviction
📈 Bullish options flow = 🔥 potential short squeeze
🕓 Time-sensitive 1DTE = Fast hands needed!
---
👉 If you trade momentum, watch CRCL at open.
🧠 **Strategy**: scalp the move or exit near \$1.11
💥 High risk, high gamma, tight leash.
\#OptionsFlow #CRCL #CallOption #TradingSignal #UnusualOptionsActivity #0DTE #GammaScalp #TradingView #SwingTrade #TFlow
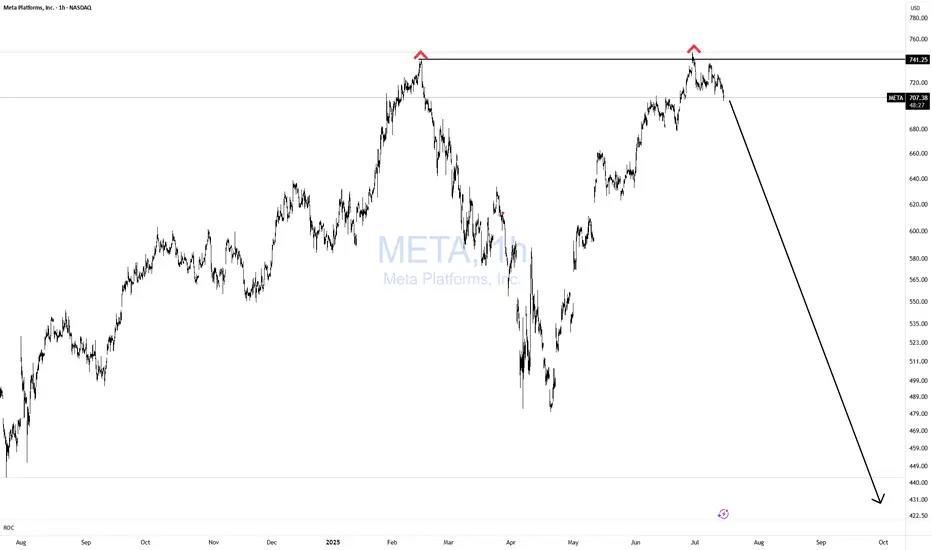
META Double Topping!Does it get any easier than this? NOPE!
If you can't spot this pattern from 1000 miles away, then you need a lot more time in the seat, training yourself in TA.
Simple with great risk reward!
Bulls GTFO!
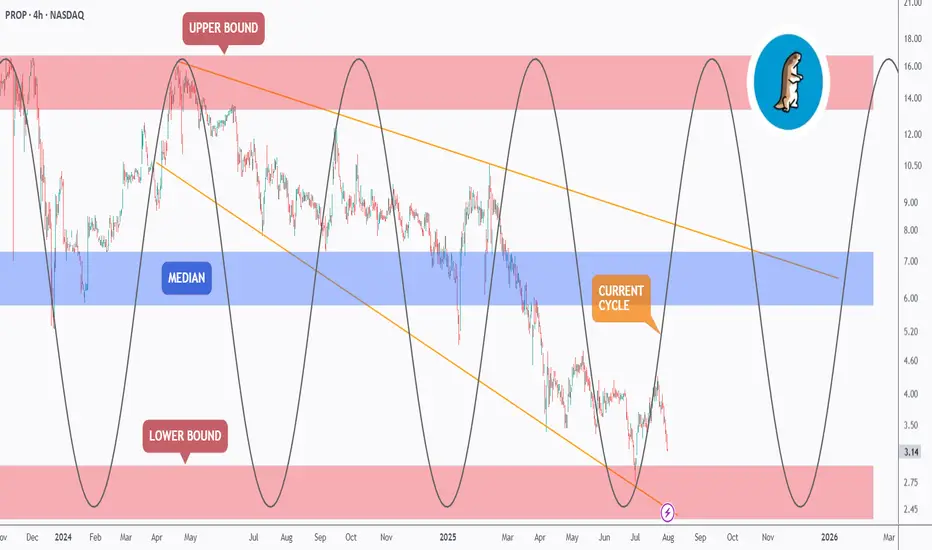
PROP - Riding the Cycle? The Next Wave May Just Be Starting!Markets move in cycles; and PROP is no exception.
If you’ve been following our previous analyses, you’ll recognize the accumulation zone we highlighted earlier. Well, this updated chart adds another layer: the cyclical rhythm of price action.
🔁As shown, PROP has been moving in clearly defined waves, bouncing between key zones with consistency. The current cycle appears to have bottomed — once again — inside the lower bound, where strong demand continues to hold.
We’re now in the early phase of what could be a fresh bullish cycle. If the rhythm plays out as before, the path of least resistance could take us toward the median zone ($6.5 - $7.5) and possibly all the way back to the upper bound ($15 - $17) by late 2025 or early 2026.
🔍 Supporting Fundamentals
While the chart speaks volumes, the fundamentals back it up:
Energy demand is surging globally, fueled by AI, data centers, and electric infrastructure — all of which require massive power capacity.
Oil and gas remain essential in this transition phase, especially with renewable infrastructure still years away from matching base-load demand.
PROP (Prairie Operating Co.) controls 65,000 acres in the DJ Basin — one of the most productive oil regions in the U.S. With advanced drilling tech and low-cost operations, PROP is well-positioned to ride out volatility and capitalize on rising demand.
🎯 Key Zones to Watch
- Support: $2.5–$3
- Median target: $6.5–$7.5
- Macro resistance: $15–$17
📌 We’re not just seeing structure — we’re seeing rhythm, confluence, and timing align.
If this cycle continues to play out, PROP might just be preparing for its next major wave.
Are you ready to catch it?
🧠 Previous posts and technical breakdowns are attached for full context.
➡️ As always, speak with your financial advisor and do your own research before making any investment decisions.
📚 Always follow your trading plan => including entry, risk management, and trade execution.
Good luck!
All strategies are good, if managed properly.
~ Richard Nasr
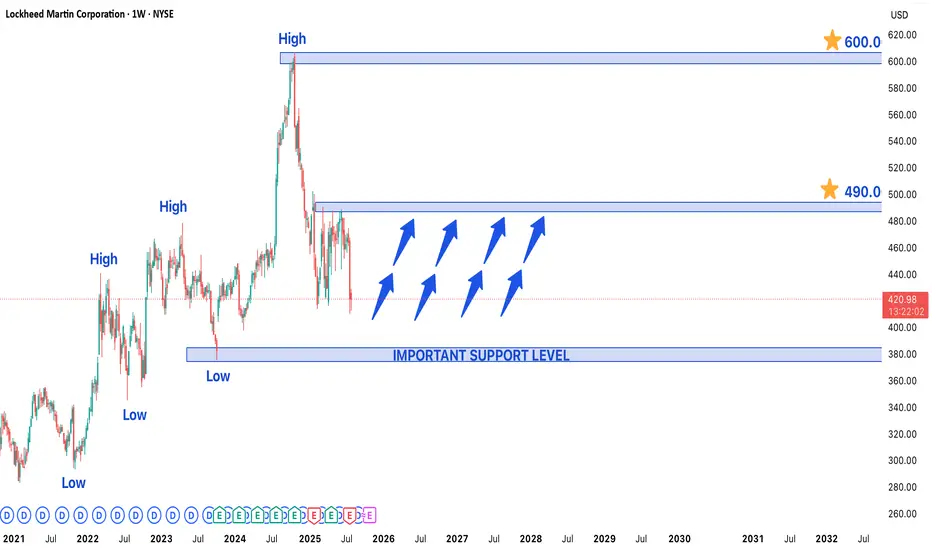
Lockheed Martin Stock in Bullish Trend - Key Levels to watchLockheed Martin (LMT) Stock in Strong Bullish Trend - Key Levels to Watch
Lockheed Martin's (LMT) stock is currently exhibiting a well-defined bullish trend, trading near a recent higher low that may serve as a crucial support level for the next upward move. The defense giant continues to benefit from robust global military spending and a strong contract pipeline, positioning the stock for potential further gains.
Technical Structure & Key Levels
- Higher Low Support: The current price zone represents a critical support area where buyers have previously stepped in, maintaining the upward trajectory
- Upside Targets:
- Near-term: $490 (previous resistance zone)
- Long-term: $600 (potential breakout extension)
- Major Support: $375 would act as strong demand zone if any deeper pullback occurs
Bullish Catalysts Supporting the Trend
1. Defense Sector Strength:
- Record US defense budget allocations for 2024-2025
- Increased NATO military spending amid global tensions
2. Contract Backlog:
- F-35 program continues to drive revenue
- Hypersonic weapons and space systems development
3. Technical Momentum:
- Price trading above key moving averages (50/200 DMA)
- Higher highs and higher lows confirm uptrend structure
Trading Strategy Considerations
- Optimal Entry:
- On bounces from current support level
- On breakout above $460 confirmation
- Risk Management:
- Stop-loss below $375 for longer-term positions
- Partial profit-taking near $490 resistance
- Confirmation Signals:
- Volume increase on upside moves
- Sustained closes above $460
Potential Risks to Monitor
- Geopolitical shifts affecting defense budgets
- Program delays (particularly in F-35 production)
- Broader market corrections impacting defense sector
Long-Term Outlook:
The combination of fundamental strength and technical positioning suggests LMT could progress toward $490 near-term, with $600 as a viable long-term target if the bullish structure holds. Traders should watch price action around current levels for continuation signals while remaining mindful of the $375 support as a critical level for the bullish thesis.
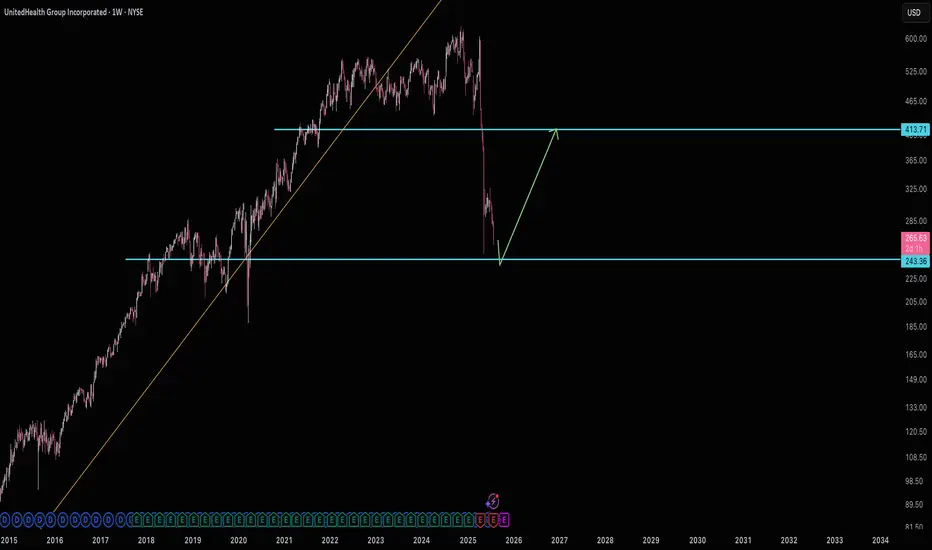
Waiting for $243 United HealthUNH has obviously taken a beating. It's managed to get so close to support many a few times now, yet hasn't hit yet. So if $243 does hit, then plan on targeting $410.
Good luck!
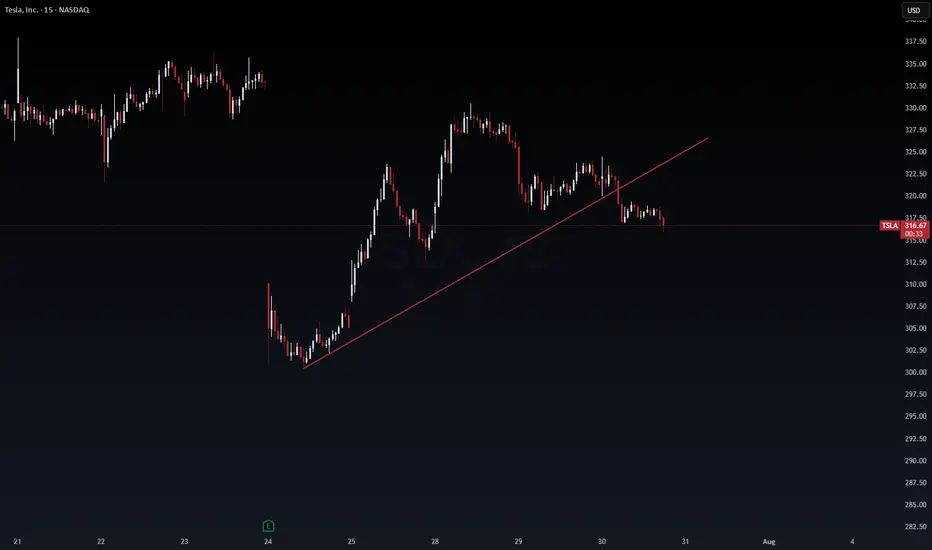
Make or Break point for TSLAlots of bulls and bears for TSLA. Wedging for a bit now. Filled the 296 gap and gap above, now its time to see if TSLA wants up or down. RSI MACD stabilized, volume thinned out, so whatever direction it chooses I think will be explosive. Plenty of Call and Put flow on both sides.
8/1/25 - $mstr - Selling spot and buying MSTR8/1/25 :: VROCKSTAR :: NASDAQ:MSTR
Selling spot and buying MSTR
- keeping it (purposefully) short today for everyone's benefit
- sold a bit of OTC:OBTC (which is nearly 15% off spot, e.g. $100k/BTC) to buy NASDAQ:MSTR MSD exposure here
- why?
- 1.6x mNAV is lowest it's been (nearly ever in current BTC move)
- Saylor not going to hit the ATM sub 2.5x, will run it hot
- Latest product further augments this runway to value accretion
- BTC still remains REALLY well bid in this current tape
- So math is like this
- ROE of BTC in "conservative" sense is 25%
- Kc (cost of capital) for Strategy is 10% again (conservative, it's really sub 10%)
- so ROE/Kc (without growth) = 2.5x book.
- A real ROE for BTC (remember this is permanent capital he's tapping, so no asset-liability mis-match) is 35%
- True Kc for this is sub 10%, but let's still say 10%. that's 3.5x book.
Therefore let's even say 2x book (below both of the above) is 2/1.6 = 25% upside. If/do you think that BTC can go back to low 90s, ofc this might contract further (the 1.6x) but at the same time, you have EVEN higher implied ROE and R/R only improves.
So at a minimum, i'd guess your R/R is "balanced" here in the most conservative scenarios. And if we do get BTC bid, this will rocket at this stage thru YE and far exceed px appreciation of it's BTC pair.
Ok that was longer than I intended. Felt important to convey math and up/downside parameters.
Be well. Everyone loses money in correlation 1. Just make sure you find the betas that have the first bids. Right now that's BTC and some quality names doing 6-7% fcf yields and growing.
I like
OTC:OBTC (adding fuel w/ my NASDAQ:MSTR calls)
NASDAQ:NXT
NYSE:DECK
NASDAQ:LULU
NYSE:FI
<3
V
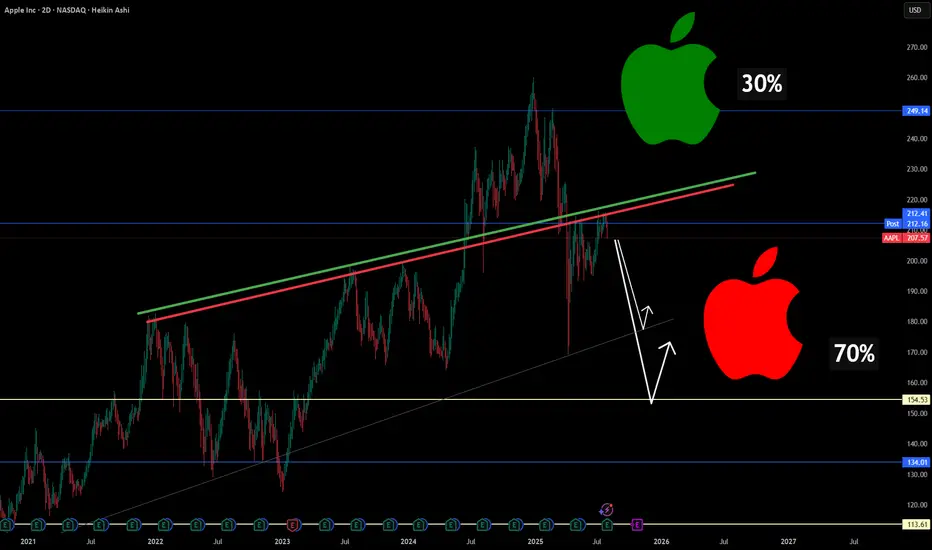
Why Apple Could Be Entering a Structural Correction🍎📉 Why Apple Could Be Entering a Structural Correction ⚠️🔍
After scanning major tech names today, one stock stood out— for all the wrong reasons : NASDAQ:AAPL .
Technically, Apple has broken below long-standing trendline support , and my chart now assigns a 70% probability(roughly guys...roughly and rounded) of further downside vs only 30% upside . But it's not just about the chart...
Here’s the macro storm Apple is walking into:
🧭 1. Trade War Revival
New tariffs on Chinese electronics could cost Apple up to $1.1B/quarter , even as it tries to diversify production. India and Vietnam are promising, but not mature enough to offset risk.
🤖 2. Lagging in the AI Arms Race
While Nvidia, Google, and Microsoft pour $30B+ into AI, Apple is spending less than half that. Analysts weren’t impressed with “Apple Intelligence.” Siri still isn’t leading.
🇨🇳 3. China: Flatlining Growth, Rising Risk
~18% of Apple’s revenue still comes from China. With Huawei resurging and tightening regulations, Apple’s dominance is being chipped away.
🛑 4. Innovation Pipeline: Empty?
There’s no iPhone super-cycle ahead. Vision Pro remains niche. Apple now looks like a mature tech stock without a breakout catalyst —risky when valuation is still premium.
⚖️ 5. Legal Pressure on Both Sides of the Atlantic
The DOJ and EU are targeting Apple’s App Store dominance. If changes are enforced, the service revenue moat weakens.
🔽 Summary: This Isn’t Panic. It’s Repricing.
The market is re-rating Apple based on real structural risks.
Downside levels I’m watching:
📉 177.65 (first support)
📉 154.53 (next key level)
❗️134–113 zone if macro pressure escalates
Chart = structure. Narrative = pressure. Both are aligned.
Let me know your thoughts—still long NASDAQ:AAPL , or hedging this weakness?
One Love,
The FXPROFESSOR 💙
Disclosure: I am happy to be part of the Trade Nation's Influencer program and receive a monthly fee for using their TradingView charts in my analysis. Awesome broker, where the trader really comes first! 🌟🤝📈
MNMD Weekly consolidation underway. What will earnings do?MNMD has started weekly consolidation by 2c right as ATAI and possibly CMPS end their weekly consolidations. Earnings after hours tonight had no real effect on the charts, so here are the levels I'm looking at into tomorrow. Click to watch the free video for more details
I provider regular chart analysis of the psychedelics sector. Be sure to Like and Follow, and Subscribe to future updates so you don't miss a post!
Support: 8.94, 8.79
Resistance: 9.40, 9.44

8/1/25 - $deck - 50% position8/1/25 :: VROCKSTAR :: NYSE:DECK
50% position
- if you have followed long enough, you know that when i write this sort of thing, it's maybe 5-10x a year, at most
- i still think anything can happen here in the mkt, so there are a lot of arrangements i've made in my portfolio to account for further drawdowns
- with that being said, conservatively DECK is 6% fcf money, and on my #s probably closer to 7%. when you're growing minimally MSD (nevermind HSD+) eventually this gets revalued
- so my preference is to barbell exposure
- i have a LT exposure w ITM leaps (jan '27 expire) and then i have my jet fuel that i'm burning in the last few sessions to get exposure higher
- think about it like this
- if 1 unit of risk costs me $1 today and $10-15 in 2027, if in this type of tape we leg down... if i say had 1 unit of risk on both of those exposures, i'd lose 1 on the first (zero) and then maybe 2...3...4 on the other.
- which is to say, as we go lower here, i eventually find myself growing that LEAP exposure quite large. rn it's about 25% of my effective book on about 5x leverage. and the other 25% is spread between 10-1 and 20-1 leverage.
if you look at ANF post results a month or so ago, this looks VERY similar and there are a lot of similarities in terms of how shorted/ positioning was into the event (same with NASDAQ:LULU btw, yet to report). by the 6th day... we ripped back to the first fib band.
- that would put next week at 107/108 and if mkt is bid, we hit 110 again. so that's why i'm using the 10-1 and 20-1. it's actually in part a trading call as well backed by my own view/ conviction on fundamentals. i think the flows today took us now far below fair value and we've filled the pre-earnings gap, which was important to point out.
- still doesn't rule out the mkt continues to puke, this is weak beta etc. etc. but from a 12-18 mo POV... this is money good in my estimation no matter what strike, unless you're degen'ing 10 delta BS (not recommended but also not my $, u do u)
be well
remember in this tape we all lose money
it's just important to lose less and find spots that will get bid back first, i think deck is one of those *for me
V

Rocket Lab Is Up 800%+ in 12 Months. What Does Its Chart Say?Space-services company Rocket Lab NASDAQ:RKLB , which has seen its stock shoot up by more than 75% year to date and 800%+ over the past 12 months, will report its latest quarterly earnings next Thursday. Does RKLB's chart show the company has more altitude to gain ... or will it crash back to Earth?
Let's check things out:
Rocket Lab's Fundamental Analysis
For those of you unfamiliar with RKLB, it's a Long Beach, Calif.-based end-to-end space company. (Full disclosure: I own shares in the name.)
Rocket Lab designs and manufactures its own small- and medium-class rockets in order to provide launch services from its sites, which are primarily in Virginia and New Zealand.
The company has mostly had commercial customers since its founding, but is starting to get some traction providing these services to the U.S. government for national-security purposes. You might say the firm competes with Tesla chief Elon Musk's privately held SpaceX and Amazon founder Jeff Bezos' private Blue Origin firm, just on a smaller scale.
RKLB is set to release Q2 results after the bell on Aug. 7, with the Street looking for a $0.07 adjusted loss per share on $135.3 million of revenue.
That would represent a 27.3% revenue gain from the $106.3 million the company took in during the same period last year, although profitability would have eased from the $0.05 adjusted loss per share RKLB posted in Q2 2024.
Of the seven sell-side analysts that I found that cover the stock, three have increased their earnings estimates since the quarter began, three have cut their estimates and one has sat on his hands.
Notably, Jeff Van Rhee of Craig-Hallum this week initiated Rocket Lab with a "Hold" rating and a $51 target price (vs. the $45.30 the stock was trading at Friday afternoon).
Looking further ahead, analysts expect Rocket Lab's revenues to grow 32% for 2025 as a whole, followed by another 56% for all of 2026.
As for price action, Rocket Lab's shares have traded more volatilely as the firm approaches its earnings release. After spiking into mid-July on an almost parabolic run, RKLB has recently consolidated with a number of days that saw multi-percentage-point drops.
As of Wednesday, options markets were pricing in a 50% likelihood of a move greater than 13%.
Rocket Lab's Technical Analysis
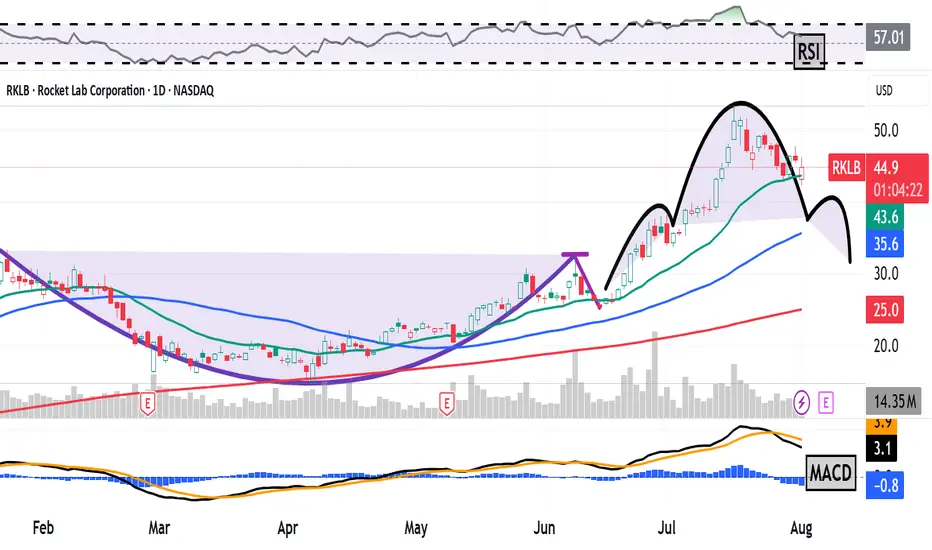
Now let's look at RKLB's chart going back to December:
Readers will note that since Rocket Lab ended its sharp upward run in mid-July, the stock's Relative Strength Index (the gray line at the chart's top) has exited overbought territory -- although the RSI still remains healthy.
Readers will also see that within the daily Moving Average Convergence Divergence indicator (marked "MACD" at the chart's bottom), the histogram of the stock's 9-day Exponential Moving Average (or "EMA," denoted by blue bars) has entered negative territory. That's usually short-term bearish.
Meanwhile, Rocket Lab's 12-day EMA (the black line near the chart's bottom) has also crossed below its 26-day EMA (the gold line). This is also traditionally a bearish signal.
However, one positive for the RKLB is that the stock appears to have found support in recent days at its 21-day EMA (the green line above). This suggests a willingness of swing traders to support the stock at that line.
Still, Rocket Lab's chart is showing what looks like a completed "head-and-shoulders" pattern of bearish reversal at the chart's right (denoted by curving black lines).
Should this pattern foretell a sell-off (as the daily MACD seems set up for), Rocket Lab's downside pivot would likely show up as a neckline at around $37 a share. That's well below the $45.30 that RKLB was trading at Friday afternoon.
What if Rocket Lab fails to hold its 21-day EMA ($45.90 in the chart above)? In that case, both the 50-day Simple Moving Average (or "SMA," marked with a blue line) and 200-day SMA (the red line) would have to come into play for the pattern implied here to become fully realized.
(Moomoo Technologies Inc. Markets Commentator Stephen “Sarge” Guilfoyle was long RKLB the time of writing this column.)
This article discusses technical analysis, other approaches, including fundamental analysis, may offer very different views. The examples provided are for illustrative purposes only and are not intended to be reflective of the results you can expect to achieve. Specific security charts used are for illustrative purposes only and are not a recommendation, offer to sell, or a solicitation of an offer to buy any security. Past investment performance does not indicate or guarantee future success. Returns will vary, and all investments carry risks, including loss of principal. This content is also not a research report and is not intended to serve as the basis for any investment decision. The information contained in this article does not purport to be a complete description of the securities, markets, or developments referred to in this material. Moomoo and its affiliates make no representation or warranty as to the article's adequacy, completeness, accuracy or timeliness for any particular purpose of the above content. Furthermore, there is no guarantee that any statements, estimates, price targets, opinions or forecasts provided herein will prove to be correct.
Moomoo is a financial information and trading app offered by Moomoo Technologies Inc. In the U.S., investment products and services on Moomoo are offered by Moomoo Financial Inc., Member FINRA/SIPC.
TradingView is an independent third party not affiliated with Moomoo Financial Inc., Moomoo Technologies Inc., or its affiliates. Moomoo Financial Inc. and its affiliates do not endorse, represent or warrant the completeness and accuracy of the data and information available on the TradingView platform and are not responsible for any services provided by the third-party platform.
$TSLA 3rd Time's a CharmI bottom called NASDAQ:TSLA twice in a row. About to do it a third time today. 312.5C 8/8 @ 4.47 were just bought for $1.3 million.
Let`s play some pokkerThere`s a pattern ;) So why not..
There`s room to grow min till pre-earnings
Trade safe!

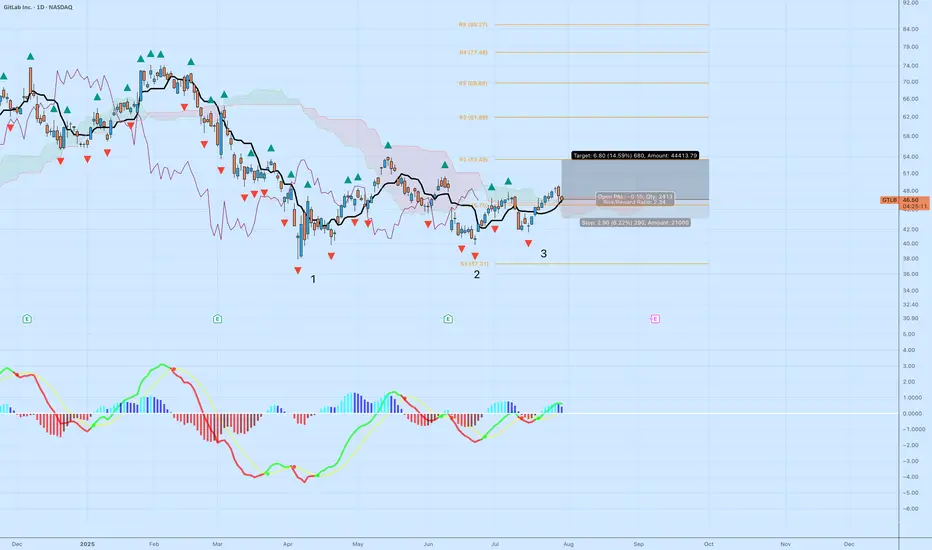
GTLB | Triple Bottom ReversalGitLab (GTLB) is setting up for a potential trend reversal following a textbook triple bottom pattern and a clean breakout above the cloud. Here's the technical breakdown:
Why This Setup Matters
Triple Bottom Pattern: Reversal structure is clear with three defined lows at ~$38, ~$40, and ~$41. The most recent leg up confirms buyers defending that zone.
Ichimoku Cloud: Price has broken above the Kumo with bullish Tenkan-Kijun cross. The leading span A is pointing up, and the cloud ahead is flat and thin — ideal conditions for continuation.
MACD Momentum: Histogram flipped positive again with green signal line crossover — a momentum shift from accumulation to breakout phase.
Trade Parameters
Entry: $46.53
Stop: $43.63 (below Tenkan and the neckline zone)
Target: $53.33
Risk:Reward Ratio: 2.34
Projected Move: +14.59%
Additional Confluence
Daily closes above cloud show growing strength from buyers.
Each bottom was followed by increasing MACD strength — a bullish divergence over time.
Pivot zone at R1 ($53.49) aligns with the price target, adding structure to the exit plan.
Risk Notes
Failure to hold $46 with volume could invalidate the breakout — watch for a retest.
If price closes below Tenkan, reevaluate the setup for weakness.
Volume confirmation needed on the next daily candle for strong conviction.
This is a technical breakout aligned with pattern recognition and trend metrics. Ideal for swing setups with controlled downside.
AAPL BUY 1st target $223AAPL is forming a wedge and been lagging for 2 years. I was expecting $182 but we never saw that level, after weeks of $200 range consolidation it's clear this is basing, first target of resistance is $223 then we could be off to the races. I would expect to see this as soon as next week provided #donthecon can stop bullying American companies long enough to focus on important things
Tesla - The all time high breakout!🚗Tesla ( NASDAQ:TSLA ) will break out soon:
🔎Analysis summary:
For the past five years Tesla has overall been consolidating between support and resistance. But following the recent bullish break and retest, bulls are slowly taking over control. It is actually quite likely that Tesla will soon break above the previous all time highs.
📝Levels to watch:
$400
🙏🏻#LONGTERMVISION
SwingTraderPhil

TSLA: Watching for short. I think there might be sell off, looking at the chart. I could be wrong so ll observe for now. I will go in if the momentum towards downward accelerate.