Long USDSGDCapitalising on last night's USD strength -looks like a turnaround for USDSGD. Looking at history, SGD typically trades within a range. (see weekly). Recent months' price action has stretched the range a fair bit, short term trend signals a potential turnaround to revert to mean. Is a contrarian trade but seriously , can Singapore afford currency strength for prolong period of time given inflation may have eased off (stands to be corrected) and being one the most costly countries in the world? Think MAS left the trading band unchanged (Yesterday's news). Good luck!

Live data chart
A technical analysis summary (moving averages, RSI, MACD, etc.)
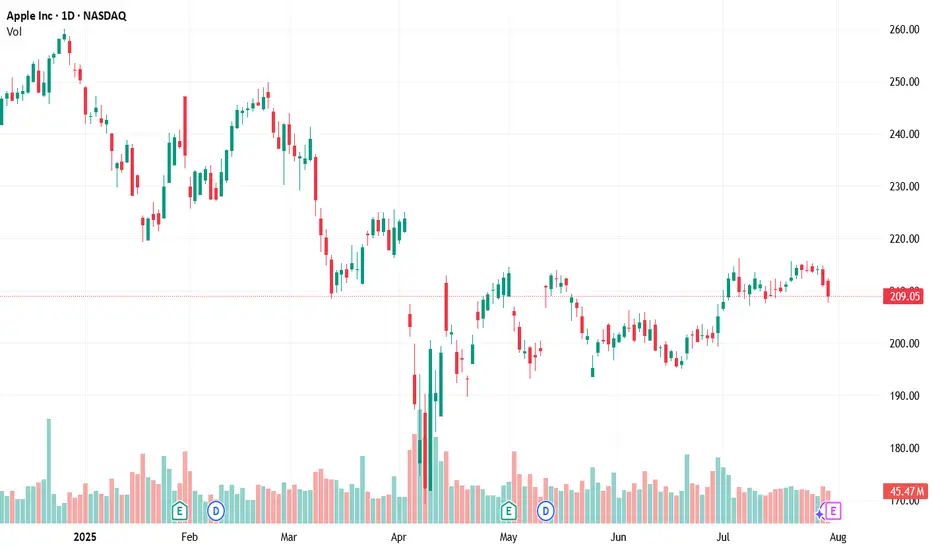
A fundamental snapshot of Apple (revenue, EPS, P/E)
GME 1W: when the memes fade, the structure speaksGameStop is once again testing the lower boundary of its long-term consolidation, bouncing off the 21.53 zone - a level that aligns with the 0.79 Fib retracement and historical support. This zone also intersects with a key trendline on the weekly chart, and just recently, a golden cross (MA50 crossing MA200 weekly) printed - a rare but technically significant signal. The stock continues to trade inside a broad descending channel, and if this support holds, the natural next step is a move back toward the mid-range at 37.42 (0.5 Fib), followed by a possible push toward 64.92. The tactical setup favors a confirmation entry near current levels, with a stop under 21.00. Risk/reward here is among the cleanest GME has offered in months.
On the fundamental side, GameStop remains in a transitional phase. The company is shutting down unprofitable segments, reducing costs, and doubling down on e-commerce and digital distribution. Financial results are still slow to recover, but the latest Q2 2025 report showed positive operating cash flow and narrowing losses. This isn't a value play in the traditional sense - it's more about the potential for renewed retail-driven momentum if technical conditions align.
If there’s still power behind the crowd - this might be one of the most technically compelling entry zones of 2025.

7/29/25 - $nxt - Still long and strong7/29/25 :: VROCKSTAR :: NASDAQ:NXT
Still long and strong
- have written a lot about this name since last yr, so won't bore you with more details
- but still MSD++ FCF yields
- mkt still wants to ignore solar
- any credit-related phase-out is acutally likely to pull fwd demand/ beats (that backlog)
- mkt already seems to be pretty conservative on next year, as is
- and w/ software and electrical systems (cross sell) in the mix... i'd guess all else equal, we still report a great quarter
- what's interesting to note is names that have rallied into their prints (electrical/ infra types) have beat... think NYSE:GEV , $cls... stuff like this. I get it, diff zip code... but still, these are well-bid "havens" b/c the mkt likes the backlog in trump economy as "money good and dip-buyable... so just buy moar now"
let's see what dan shug and squad offer. i'm buying any dips sub $60... but all else equal, expect upside
V

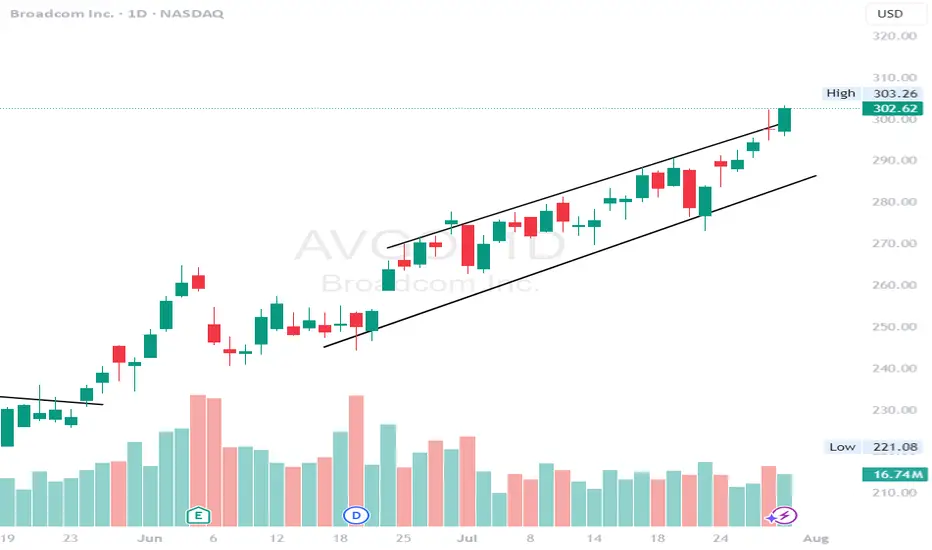
$AVGO - channel breakout on the daily.AVGO - Stock in a channel breakout pattern on the daily time frame. Stock broke and held $300 level. Looking for more upside here towards $315 and $330. Stock is decent on the indicator level.
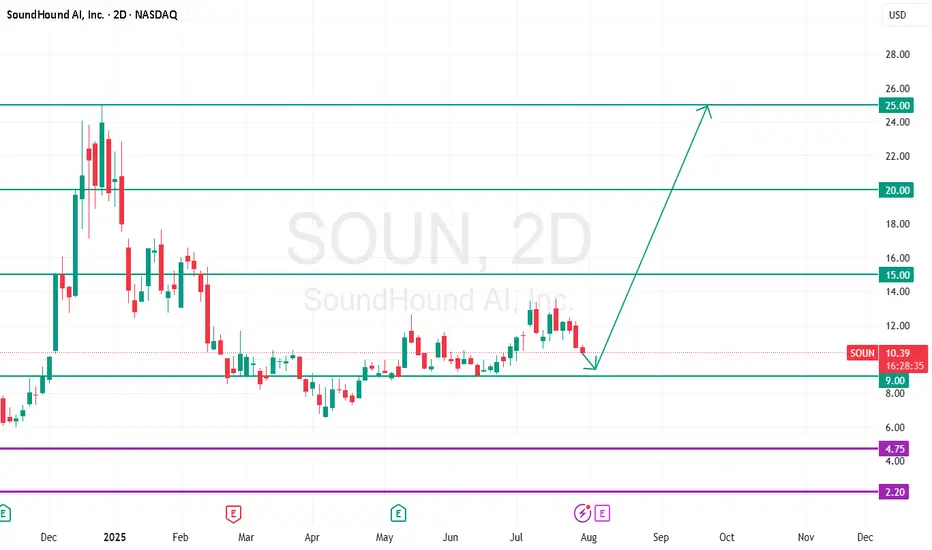
SoundHound AI - Long*SoundHound AI CMP - $10.40 Positional Setup*
*Buy Range $9 - $12 / Strict Stop Loss $8.65 in weekly closing*
Target 1 - $15.00
Target 2 - $20.00
Target 3 - $25.00
Disclaimer: This is my view and for educational purpose only.
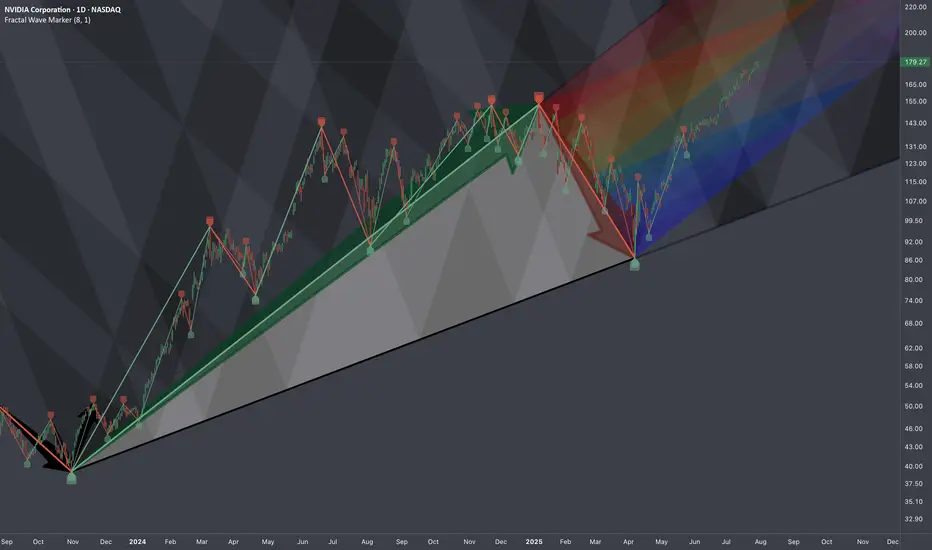
$NVDA: Cycle-Wired Levels🏛️ Research Notes
The fact that the angle of linear connection between 3rd degree points (fractal hierarchy) acted multiple amout of times as support and eventually resistance from which tariff drop happened establishing bottom and expanding from there.
That means if we were to justify the texture of ongoing wave from that bottom, we would geometrically quantify the area of that triangle to project considering historic data to remain objective approach (and NOT what levels we subjectively want to see whether we are bullish or bearish). There is mean reversion rule also going on which will be structurally addressed.
No matter where your actual target is at, there are always structural boundaries that price must break through first in order to get there. And because markets tend to move in proportion to their own scale — often aligning with exponents of the golden ratio, we treat phi as a constant within this probabilistic space.
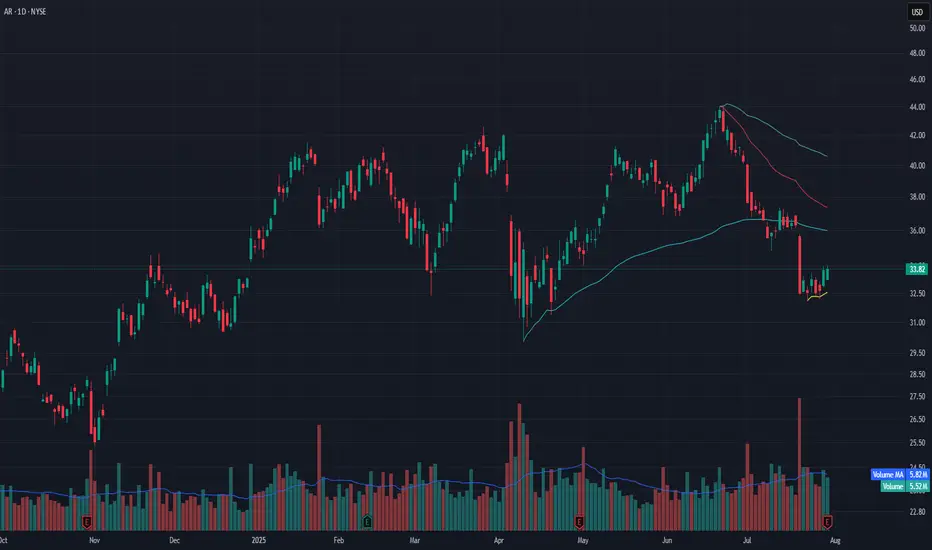
AR Rebounding from VWAP Zone – Watch for Break Above $34AR is attempting to base after a steep selloff from the $44 level. Over the past few sessions, price has found stability above the anchored VWAP (yellow line) and printed multiple higher lows. Today’s close at $33.82 brings it right up against the recent short-term resistance near $34.
Volume is steady (5.52M vs. 5.82M average), suggesting balance between buyers and sellers. A confirmed breakout above $34 with volume could trigger a move toward the $36.50–37 range, where the next anchored VWAP (red) and declining 20 EMA reside.
This setup favors early reversal traders with tight risk below VWAP and confirmation needed through $34.25.
Indicators used:
Anchored VWAP (short-term support reclaim)
Volume trend (flat but no selling surge)
Price structure (potential bottom formation with higher lows)
Entry idea: Long above $34
Target: $36.50–37
Stop: Below $32.75 or VWAP zone
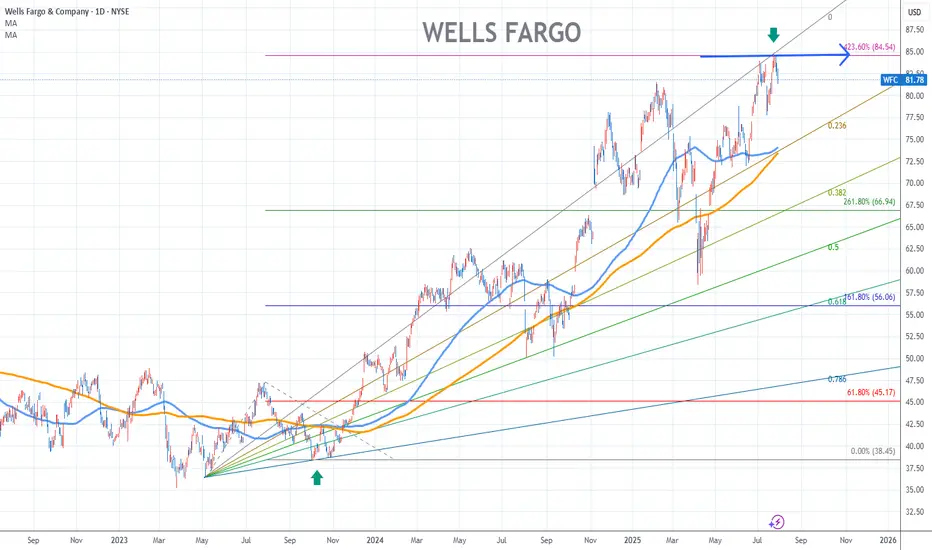
Wells Fargo Stock Chart Fibonacci Analysis 073025Hit the 84.5/423.60% resistance level.
Trading Idea
Chart time frame:D
A) 15 min(1W-3M)
B) 1 hr(3M-6M)
C) 4 hr(6M-1year)
D) 1 day(1-3years)
Stock progress:E
A) Keep rising over 61.80% resistance
B) 61.80% resistance
C) 61.80% support
D) Hit the bottom
E) Hit the top
Stocks rise as they rise from support and fall from resistance. Our goal is to find a low support point and enter. It can be referred to as buying at the pullback point. The pullback point can be found with a Fibonacci extension of 61.80%. This is a step to find entry level. 1) Find a triangle (Fibonacci Speed Fan Line) that connects the high (resistance) and low (support) points of the stock in progress, where it is continuously expressed as a Slingshot, 2) and create a Fibonacci extension level for the first rising wave from the start point of slingshot pattern.
When the current price goes over 61.80% level , that can be a good entry point, especially if the SMA 100 and 200 curves are gathered together at 61.80%, it is a very good entry point.
As a great help, tradingview provides these Fibonacci speed fan lines and extension levels with ease. So if you use the Fibonacci fan line, the extension level, and the SMA 100/200 curve well, you can find an entry point for the stock market. At least you have to enter at this low point to avoid trading failure, and if you are skilled at entering this low point, with fibonacci6180 technique, your reading skill to chart will be greatly improved.
If you want to do day trading, please set the time frame to 5 minutes or 15 minutes, and you will see many of the low point of rising stocks.
If want to prefer long term range trading, you can set the time frame to 1 hr or 1 day.
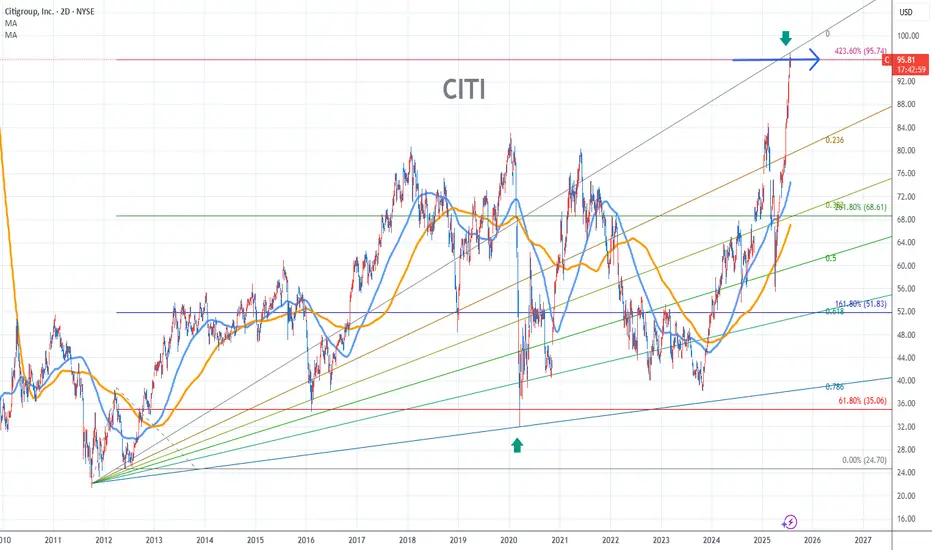
Citigroup Stock Chart Fibonacci Analysis 073025Hit the 96/423.60% resistance level.
Chart time frame:D
A) 15 min(1W-3M)
B) 1 hr(3M-6M)
C) 4 hr(6M-1year)
D) 1 day(1-3years)
Stock progress:E
A) Keep rising over 61.80% resistance
B) 61.80% resistance
C) 61.80% support
D) Hit the bottom
E) Hit the top
Stocks rise as they rise from support and fall from resistance. Our goal is to find a low support point and enter. It can be referred to as buying at the pullback point. The pullback point can be found with a Fibonacci extension of 61.80%. This is a step to find entry level. 1) Find a triangle (Fibonacci Speed Fan Line) that connects the high (resistance) and low (support) points of the stock in progress, where it is continuously expressed as a Slingshot, 2) and create a Fibonacci extension level for the first rising wave from the start point of slingshot pattern.
When the current price goes over 61.80% level , that can be a good entry point, especially if the SMA 100 and 200 curves are gathered together at 61.80%, it is a very good entry point.
As a great help, tradingview provides these Fibonacci speed fan lines and extension levels with ease. So if you use the Fibonacci fan line, the extension level, and the SMA 100/200 curve well, you can find an entry point for the stock market. At least you have to enter at this low point to avoid trading failure, and if you are skilled at entering this low point, with fibonacci6180 technique, your reading skill to chart will be greatly improved.
If you want to do day trading, please set the time frame to 5 minutes or 15 minutes, and you will see many of the low point of rising stocks.
If want to prefer long term range trading, you can set the time frame to 1 hr or 1 day.
AACG - Daily - Run-up Into EarningsA notable short squeeze is underway, with most short positions closing on July 24, 2025, potentially aiming to trigger stop-losses for remaining shorts from November 2024. The stock has seen quiet accumulation since August 2024, driven by existing money recycling and new participants. Despite being founded in 1999, the company maintains a $40 million market cap with stable annual revenue growth but consistently negative net income. Its debt is rising, and cash and equivalents are declining, suggesting a potential cash shortfall within five years. While a significant price spike towards $2.40 is anticipated before a gradual decline, unfavorable news could send it below $1, risking delisting.
Not financial advice, always do your due diligence
Leave a like👍 and/or comment💬.
We appreciate and value everyone's feedback!
- RoninAITrader

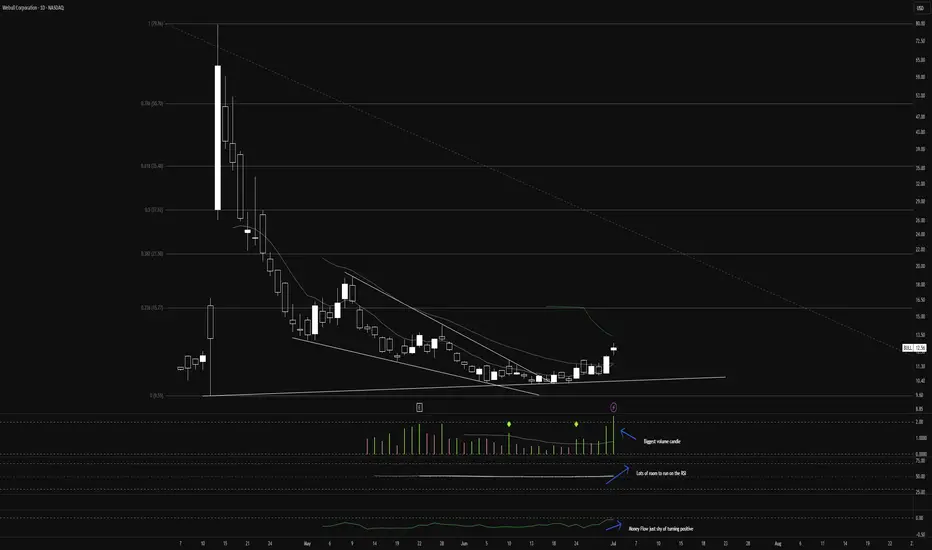
Is the $BULL Ready to Run? A perfect storm of good news here.
June 30 was the last day to redeem $BULLZ warrants. The overhang of insiders dumping shares to arbitrage warrants is gone.
This happened just in time to catch the sector tailwinds from the NASDAQ:HOOD announcement of tokenized public and private assets rolling out in Europe.
WeBull has integrated the NASDAQ:COIN CaaS offering for crypto trading, augmenting its crypto exposure and pairing nicely with Kalshi's integrated hourly crypto contracts. With favorable crypto legislation coming out of the current administration, WeBull is perfectly primed to take advantage of the trend, coupling stock and crypto trading into one neat platform.
Today, July 1, we saw massive volume on call contracts - a 44% increase to average daily volume.
17% YoY growth of user base since Q1 of '24 and a 66% YoY increase in AUM. With revenues on the rise, I would fully expect positive margins this year.
Should be a fun one as we start to catch momentum.
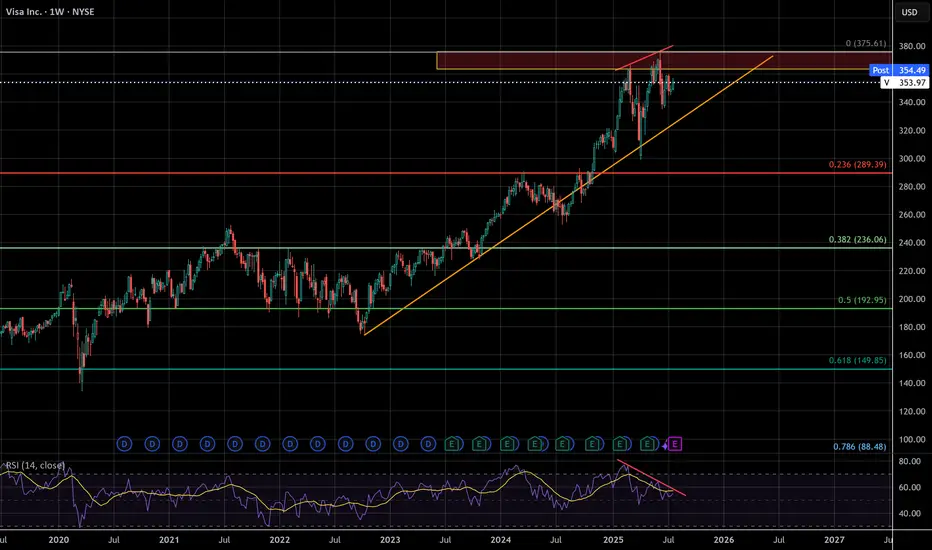
VISA - The missing puzzle piece - Suffering from successI've seen a lot of negative sentiment online lately about the impending bubble, but even with social media, crude AI, and the US dollar being the peak of that negativity this whale has been dying slowly and few have taken notice.
VISA has begun to censor what can be bought, overcharge merchants, and short change banks on interchange fees. These are acts of desperation as growth reaches diminishing returns, the beginning decline of a massive company. Think about it, who isn't using visa already? They have to wait for new users to be born. There will only ever be more competition, competition that has superior speed, accuracy, efficiency, and cost.
VISA may not lead this crash, but it's days look to be numbered unless they make radical changes . According to google results, antitrust violations can carry 3 times the monetary penalty gained from illegal activity. I don't think this will happen, but it's a TON of leverage for a massive settlement. The cracks are just beginning, but this company is made of glass
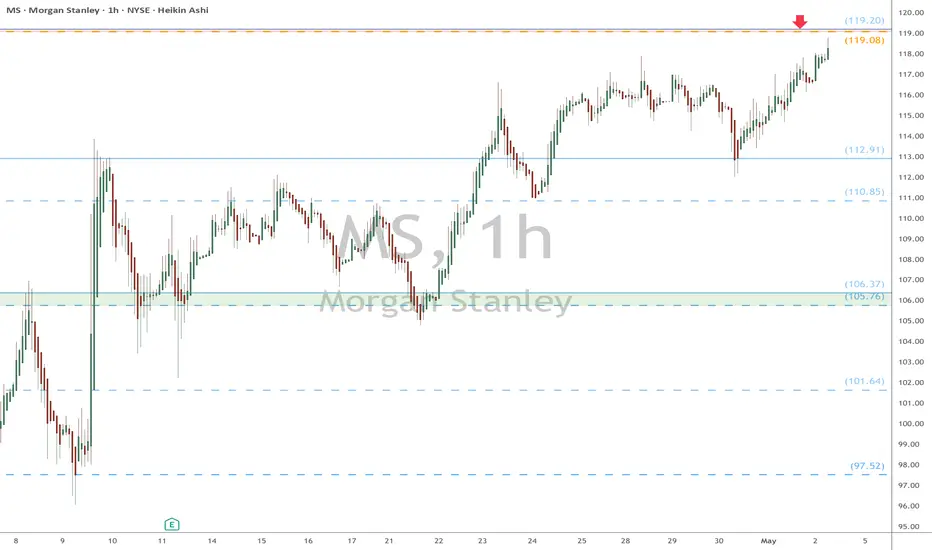
MS eyes on $119: Major Resistance may End Bounce or Strong BullMS recovering well from the tariff tantrum.
About to test a major resistance $119.08-119.20
Break would show strong bull, but dip more likely.
===========================================
.
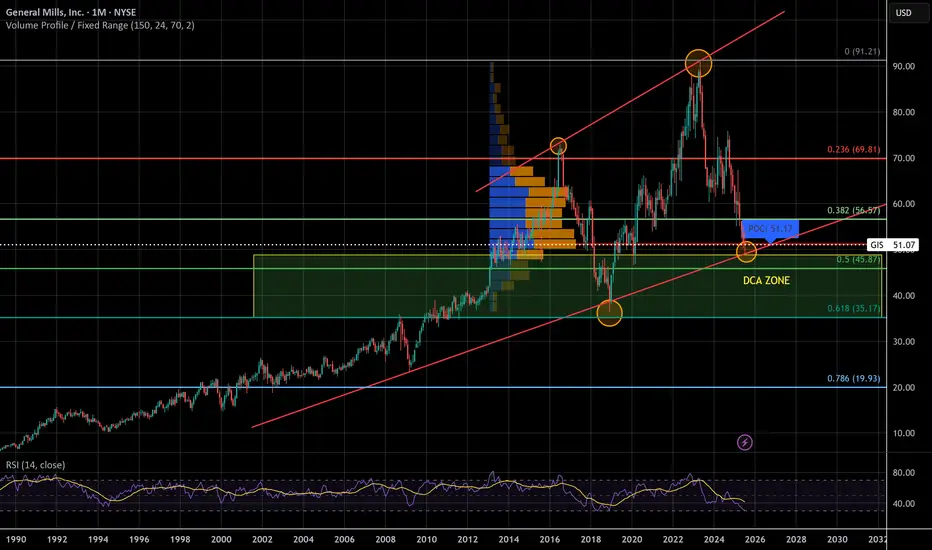
General Mills - Legendary Recession StockWe could be witnessing the biggest correction in General Mills history, again! For the 2nd time in 5 years! I trust in the golden fib, volume looks good, and RSI is low. If it makes it to the top of the channel it'll double in price in the coming years. This looks like a good candidate for Elliott Waves but I'm no good with them.
A lot of people think a recession is coming, if that is the case a lot of people will be buying general mills. More eating at home to save money = more groceries purchased. Looking at the previous financial recessions, General Mills lost 30-35% and recovered swiftly to even greater heights
Tariffs could also heavily affect general mills, which is why I DCA instead of 'aping fat bags'. Making money is hard, but holding onto it is even harder.
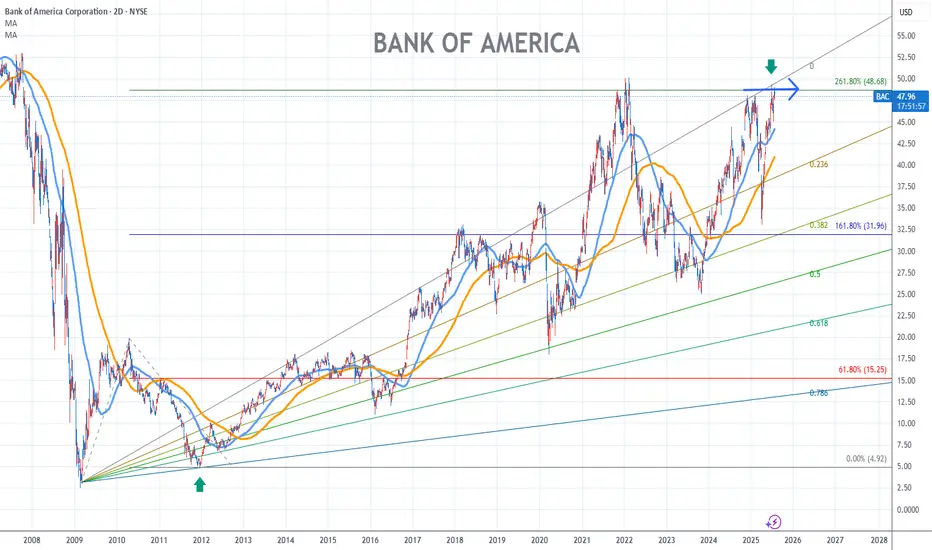
Bank of America Stock Chart Fibonacci Analysis 073025
Hit the 48.7/261.80% resistance level.
Trading Idea
Chart time frame:D
A) 15 min(1W-3M)
B) 1 hr(3M-6M)
C) 4 hr(6M-1year)
D) 1 day(1-3years)
Stock progress:E
A) Keep rising over 61.80% resistance
B) 61.80% resistance
C) 61.80% support
D) Hit the bottom
E) Hit the top
Stocks rise as they rise from support and fall from resistance. Our goal is to find a low support point and enter. It can be referred to as buying at the pullback point. The pullback point can be found with a Fibonacci extension of 61.80%. This is a step to find entry level. 1) Find a triangle (Fibonacci Speed Fan Line) that connects the high (resistance) and low (support) points of the stock in progress, where it is continuously expressed as a Slingshot, 2) and create a Fibonacci extension level for the first rising wave from the start point of slingshot pattern.
When the current price goes over 61.80% level , that can be a good entry point, especially if the SMA 100 and 200 curves are gathered together at 61.80%, it is a very good entry point.
As a great help, tradingview provides these Fibonacci speed fan lines and extension levels with ease. So if you use the Fibonacci fan line, the extension level, and the SMA 100/200 curve well, you can find an entry point for the stock market. At least you have to enter at this low point to avoid trading failure, and if you are skilled at entering this low point, with fibonacci6180 technique, your reading skill to chart will be greatly improved.
If you want to do day trading, please set the time frame to 5 minutes or 15 minutes, and you will see many of the low point of rising stocks.
If want to prefer long term range trading, you can set the time frame to 1 hr or 1 day.
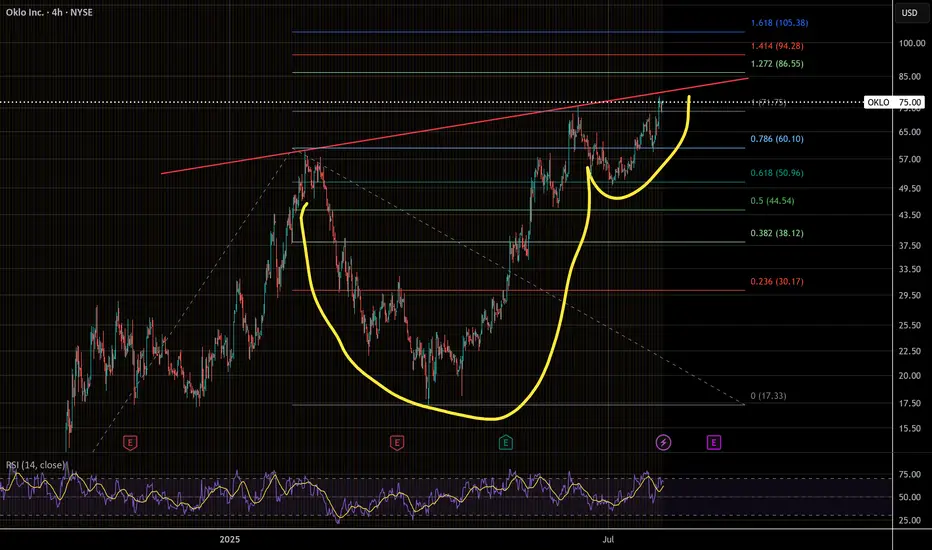
Cup and Handle, another leg up?Oklo is looking pretty decent, waiting for a break to confirm this momentum trade
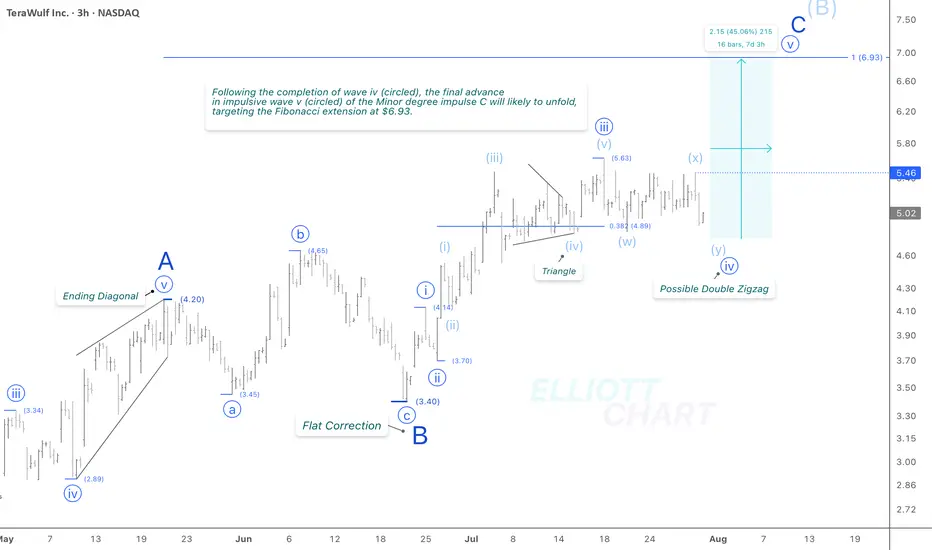
WULF / 3hThe unexpected 4% decline today suggests a potential shift in the wave iv (circled) corrective structure—from the previously identified triangle pattern to a more complex (w)-(x)-(y) combination. While differing corrective variations remain possible, this alternate structure now appears to be nearing completion. It is likely to precede the anticipated advance of approximately 45% in wave v (circled) of the ongoing Minor degree wave C.
The Fibonacci extension target at 6.93 remains unchanged.
Trend Analysis >> Upon completion of Minor wave C, the countertrend advance of Intermediate wave (B)—in progress since April 9—is expected to give way to a decline in wave (C) of the same degree. This next downtrend may begin in the coming days and has the potential to extend through the end of the year.
NASDAQ:WULF CRYPTOCAP:BTC BITSTAMP:BTCUSD MARKETSCOM:BITCOIN
#CryptoStocks #WULF #BTCMining #Bitcoin #BTC
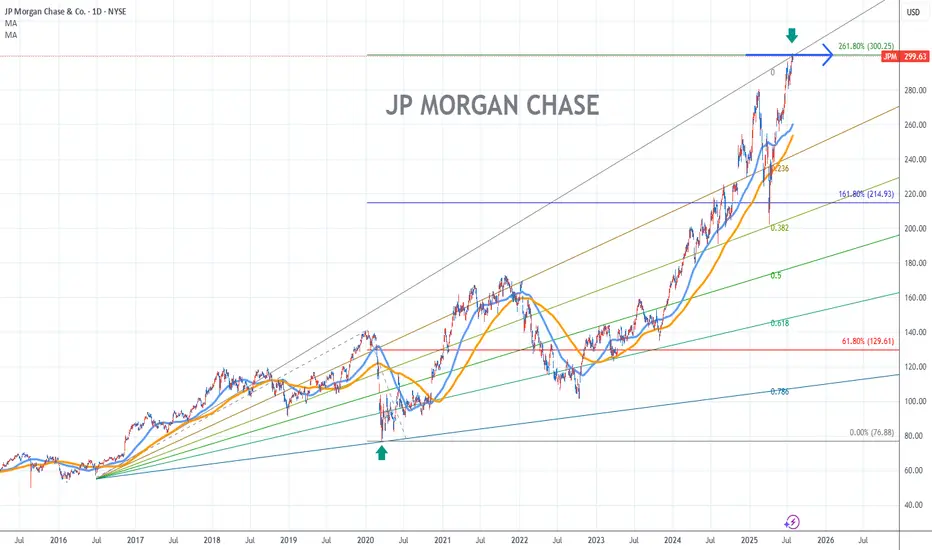
JP Morgan Chase Stock Chart Fibonacci Analysis 073025Trading Idea
Hit the 300/261.80% resistance level.
Chart time frame:D
A) 15 min(1W-3M)
B) 1 hr(3M-6M)
C) 4 hr(6M-1year)
D) 1 day(1-3years)
Stock progress:E
A) Keep rising over 61.80% resistance
B) 61.80% resistance
C) 61.80% support
D) Hit the bottom
E) Hit the top
Stocks rise as they rise from support and fall from resistance. Our goal is to find a low support point and enter. It can be referred to as buying at the pullback point. The pullback point can be found with a Fibonacci extension of 61.80%. This is a step to find entry level. 1) Find a triangle (Fibonacci Speed Fan Line) that connects the high (resistance) and low (support) points of the stock in progress, where it is continuously expressed as a Slingshot, 2) and create a Fibonacci extension level for the first rising wave from the start point of slingshot pattern.
When the current price goes over 61.80% level , that can be a good entry point, especially if the SMA 100 and 200 curves are gathered together at 61.80%, it is a very good entry point.
As a great help, tradingview provides these Fibonacci speed fan lines and extension levels with ease. So if you use the Fibonacci fan line, the extension level, and the SMA 100/200 curve well, you can find an entry point for the stock market. At least you have to enter at this low point to avoid trading failure, and if you are skilled at entering this low point, with fibonacci6180 technique, your reading skill to chart will be greatly improved.
If you want to do day trading, please set the time frame to 5 minutes or 15 minutes, and you will see many of the low point of rising stocks.
If want to prefer long term range trading, you can set the time frame to 1 hr or 1 day.
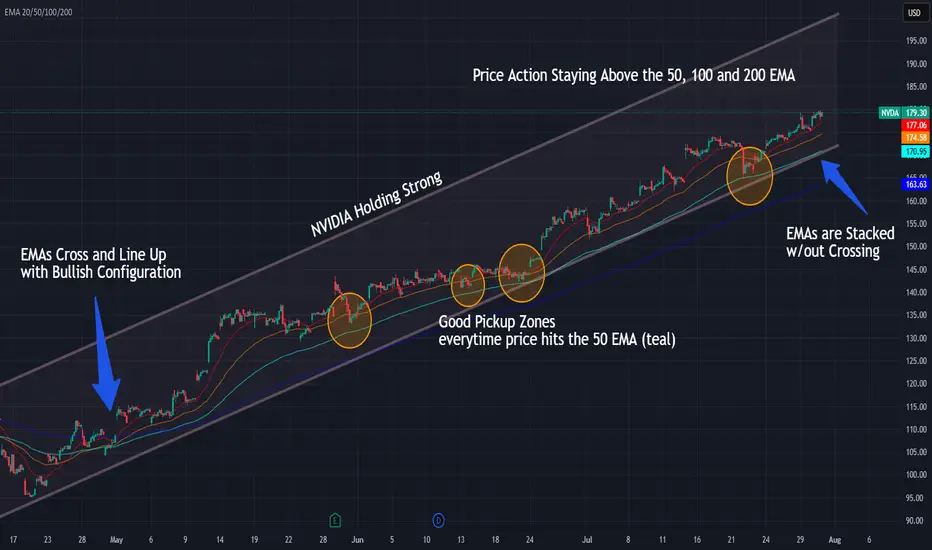
NVIDIA Riding the 50 EMA — Trend Still IntactNVDA continues to respect the rising channel while price holds above the 50, 100, and 200 EMAs — with each 50 EMA touch offering solid entries.
📌 Bullish EMA structure: 20/50/100/200 stacked clean
📌 50 EMA = key support and entry zone
⏱️ Timeframe: 1H
#nvda #stocks #ema #swingtrading #bullishtrend #quanttradingpro #tradingview
Move to the higher range? Looks like we are prepped to move to the higher range. Especially after the way futures reacted to FOMC today.
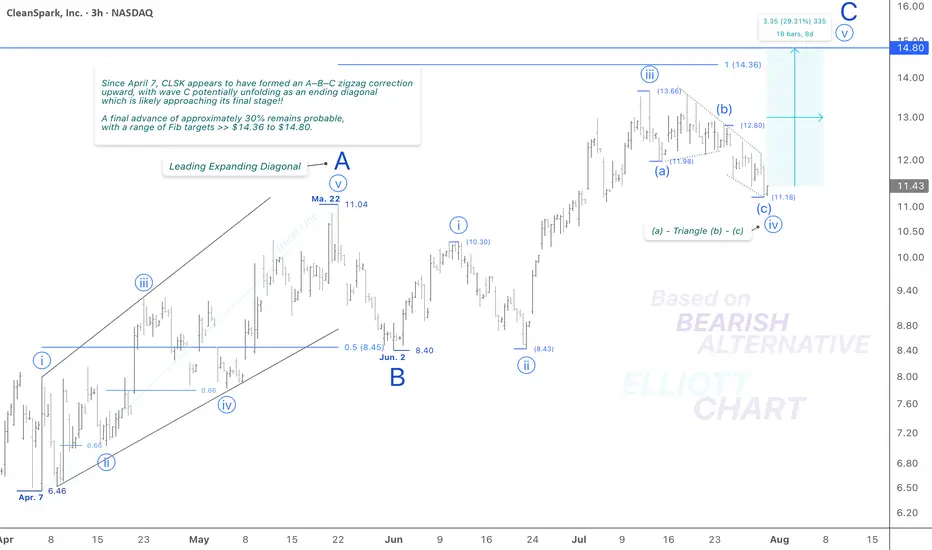
CLSK / 3hToday’s unexpected 2.6% decline, along with the continued development of an ending diagonal in the final leg of the correction, supports a reversion to the previously considered structure: an formation for wave iv (circled). This revised interpretation aligns more closely with the current price action and wave behavior.
I continue to view Minor wave C as an impulsive sequence as well, which now appears to be entering its final stage—an anticipated advance in wave v (circled), with a projected Fib target in the 14.36–14.80 range.
Wave Analysis >> While the current outlook on NASDAQ:CLSK remains consistent with previous analysis, the 3-h frame above shows that Minor wave C—completing the corrective advance of wave (B)—appears to be unfolding in an impulsive sequence, likely entering its final stages.
Within this structure, Minute wave iv (circled) has taken the form of an correction. A final push higher in Minute wave v (circled) is now anticipated, which would complete the ongoing wave C and, in turn, mark the conclusion of the countertrend advance in Intermediate degree wave (B).
Trend Analysis >> Upon completion of Minor wave C, a broader trend reversal to the downside is anticipated, marking the beginning of the final decline in Intermediate wave (C). This bearish phase may develop over the coming months and could persist through the end of the year.
#CryptoStocks #CLSK #BTCMining #Bitcoin #BTC
NASDAQ:CLSK MARKETSCOM:BITCOIN CRYPTOCAP:BTC BITSTAMP:BTCUSD
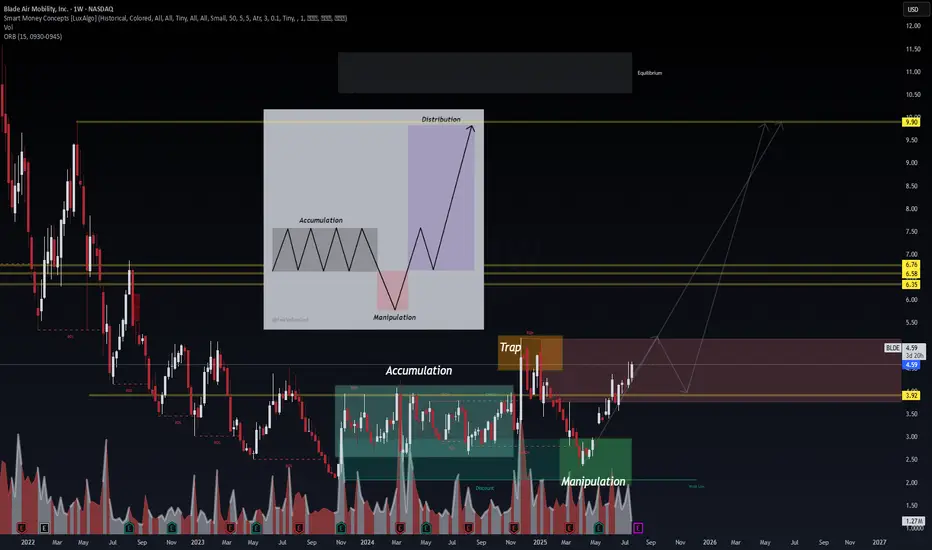
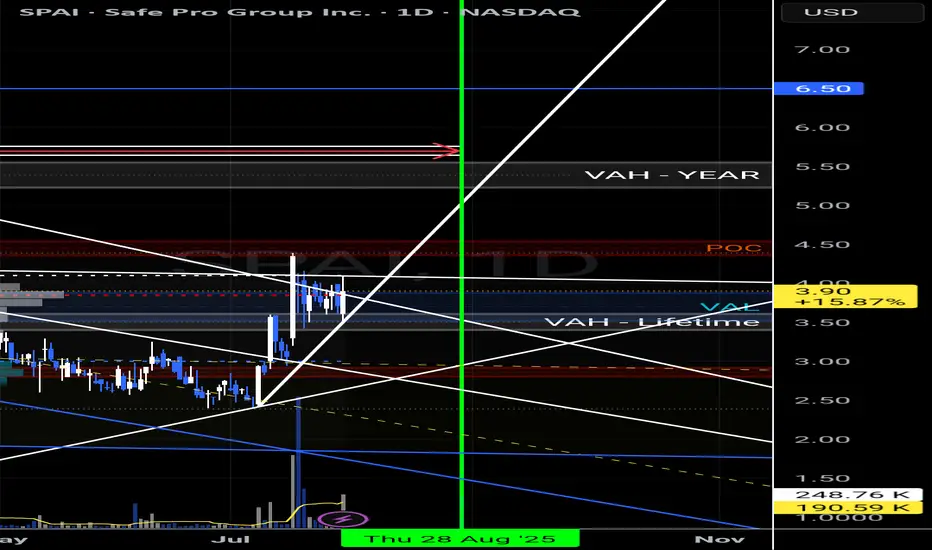
BLDE – VolanX Smart Cycle Activation📈 BLDE – VolanX Smart Cycle Activation
Timeframe: Weekly
Posted by: WaverVanir International LLC | VolanX Protocol
Model: Accumulation → Manipulation → Expansion
After multiple Breaks of Structure (BOS) and prolonged markdown, BLDE has now confirmed a Smart Money Accumulation Cycle. A clear manipulation sweep below prior lows has triggered the upside phase. This chart follows the classic SMC model with:
🔹 Accumulation → Trap → Manipulation → Expansion
🔍 Key Observations:
Accumulation zone: $2.00–$4.00
Trap high: ~$5.00 (liquidity run & rejection)
Clean reclaim of $3.92 structure now acting as launchpad
Next zones of interest:
• $6.35
• $6.58
• $6.76
• Ultimate distribution zone: $9.90
📊 VolanX Thesis:
We are entering a Mark-Up Phase consistent with the VolanX Alpha Expansion Model. As liquidity rotates upward, expect a stair-step climb toward the equilibrium zone near $9.90.
🧠 Strategic Insight:
If price pulls back into the $3.92–$4.10 range, that would be considered a high-probability re-entry for bulls aligned with institutional footprints.
🛡️ Risk Lens:
Monitor for early distribution at $6.76. VolanX Guardian Protocol flags rising volume anomalies in that range.