NVDA Squeezes to $187 or Pullback from Supply? Jul 31NVDA Explodes into Gamma Cloud! Squeeze to $187 or Pullback from Supply?
🔍 GEX & Options Flow Insight (1st Image Analysis)
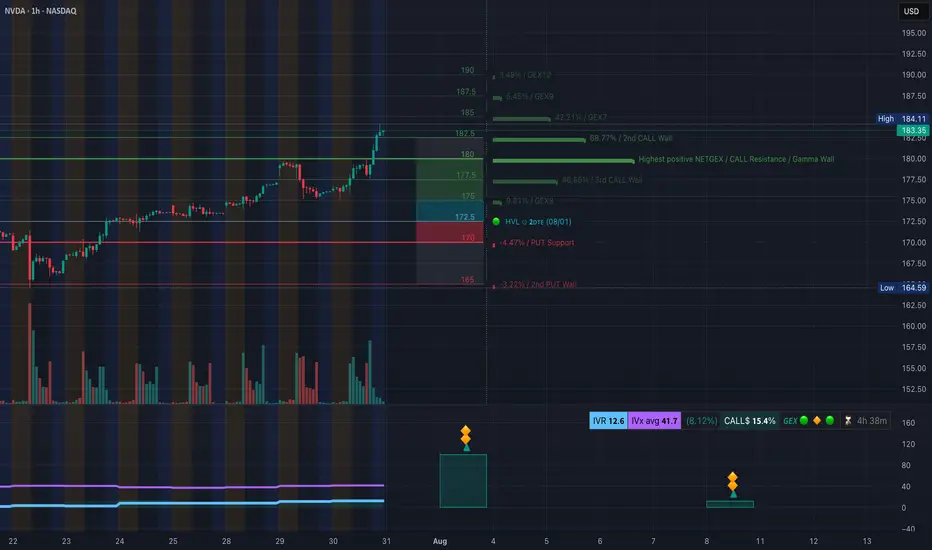
NVDA just broke through major resistance and is trading at $183.35, sitting in the middle of stacked Call Walls and a strong positive GEX zone. Gamma positioning is highly bullish—but a stall near current levels is possible as dealers begin to hedge less aggressively.
* Call Walls & Resistance:
* ✅ $180.00 → Highest positive NET GEX zone
* ✅ $182.5 → 2nd Call Wall (68.77%) — current area of battle
* 🧱 $187.5–190.0 → GEX9 and GEX10 zones = possible squeeze targets
* Put Support:
* 🛡️ $175.18–175.51 → Strong PUT Support zone and demand on price chart
* 🔻 $172.5 → HVL zone = invalidation for breakout thesis
* Volatility Insight:
* IVR 12.6, IVx Avg 41.7 → Neutral-to-low IV
* Calls Bias: 15.4% → Slightly bullish, but not euphoric
* GEX sentiment: 🟡🟢🟢 = Cautiously Bullish
✅ Option Trading Suggestion:
Bias: Bullish with caution around 185
Strategy: Vertical debit call spread
* Entry Idea: Buy 182.5C / Sell 187.5C for Aug 2 or Aug 9
* Stop: Close below 179.65 (trap candle base)
* Target: 187.5 (GEX9 ceiling)
Why this works: NVDA is entering a highly stacked gamma region. If bulls hold above 182.5, momentum may carry price toward the outer GEX bands at 187.5. However, IV is not stretched, so premium decay is a risk—spreads protect against it.
🧠 Technical Analysis (1H Chart) (2nd Image Analysis)
Market Structure & SMC:
* ✅ CHoCH → BOS → BOS confirmed since July 29
* 🚀 Strong bullish continuation from discounted OB area near 175
* NVDA is currently riding mid-upper range of an ascending channel
Trendlines:
* Perfect channel structure respected since July 25
* Currently touching upper channel resistance around 183.35–184.50
SMC Zones & Supply/Demand:
* 🟩 Demand Zone: 175.18–177.32 → Last bullish OB
* 🟥 Supply/Exhaustion Zone: 183.5–185 (purple box) → caution here
🔄 Price Action & Key Levels
* Support:
* 📌 179.65 → Key structure base (trap candle)
* ✅ 177.32–175.18 → Demand + OB + GEX Put Support
* ❗ Below 172.5 = structure breaks
* Resistance:
* 🚩 183.35–185.00 → Supply + top channel + GEX7
* 🧨 187.5–190.0 → GEX9/GEX10 extension zone = possible parabolic breakout
🧭 Scalping / Intraday Trade Setup
🟩 Bullish Setup (Preferred):
* Entry: 182.50–183.00 breakout
* Target 1: 185.00
* Target 2: 187.50
* Stop: 179.65 break & hold
🟥 Bearish Pullback Setup:
* Entry: Rejection at 184.5 supply zone
* Target 1: 180.00
* Target 2: 177.30
* Stop: New high above 185.5
🔁 Summary Thoughts
* NVDA is showing classic breakout behavior with gamma fuel behind the move.
* SMC and structure are fully bullish, supported by rising channel and BOS continuation.
* Price is approaching a key exhaustion zone, so either it breaks through to 187.5 or pulls back to retest 179–177.
* Intraday long trades are favored above 182.5. Swing traders should wait for a dip to demand or a clean breakout above 185.
🚨 Disclaimer:
This analysis is for educational purposes only and does not constitute financial advice. Always do your own research and manage your risk accordingly.
TSLA Breaks Bull Structure - Gamma Trap or Breakdown? Jul 31TSLA Breaks Bull Structure — Gamma Trap or Breakdown? Watch 315/300 Closely!
🔍 GEX & Options Flow Insight (1st Image Analysis)
TSLA is trading at $317.82, having just lost support at the 2nd Call Wall ($322.5) and now hovering near key PUT Wall clusters. Options positioning reveals strong downside pressure unless bulls reclaim 321+.
* Call Walls / Resistance:
* 📍 $322.5 → 2nd Call Wall (73.94%) — recently rejected
* 📍 $324.5–328 → Heavy net GEX zones and dealer resistance
* 📍 $336–338 → 3rd Call Wall + GEX9 — parabolic ceiling
* Put Walls / Gamma Risk Zone:
* 🔻 $316.0 / $312.0 → GEX transition zone (dealer flip risk)
* 🔻 $305.0 / $300.4 → Major PUT Support (73.87%) and HVL demand
* Extreme risk below $300 → Gamma cascade toward $290
* Volatility Insight:
* IVR 6.7, IVx Avg 52.9 → Low relative IV = cheap options
* Call Bias: 44.8% → Dealers still net short calls, but flows are softening
✅ Option Trading Suggestion:
Bias: Leaning bearish below 321.2, bearish confirmation under 315
Strategy: Bearish vertical or put debit spread
* Entry Idea: Buy 315P / Sell 305P for Aug 2 or Aug 9 expiry
* Aggressive alt: Naked 310P or 305P if breakdown confirmed
* Invalidation: Reclaim 321.20 with volume = close or reverse
Why this works: Dealer gamma exposure has flipped to negative under 316. If TSLA fails to hold above 315, dealers must hedge by selling into weakness, potentially accelerating downside toward 300.4–305.
🧠 Technical Analysis (1H Chart) (2nd Image Analysis)
Market Structure & SMC:
* 🟥 Recent CHoCH confirmed on July 30 — bearish shift
* ❌ Failed to hold BOS structure from July 29 → trendline break
* ⚠️ Currently retesting broken structure as resistance (321.20–324.50)
Trendline Dynamics:
* 📉 Break below upward sloping trendline confirmed → downside pressure
* New bearish structure forming lower highs under OB zone
SMC Zones & Reversal Blocks:
* 🔴 Supply Zone (Purple Box): 321.2–324.5 → Rejected twice, now acting as resistance
* 🟩 Demand Zone (Green Box): 312–315.25 → Minor bounce zone; if fails, opens flush to 305–300
🔄 Price Action & Key Levels
* Support Levels:
* 🔻 315.25 → 312.00 → Minor demand + retest zone
* ⚠️ 300.41 → PUT Support + HVL zone (gamma wall)
* 🚨 Below 300 = fast move to 290
* Resistance Levels:
* 🚫 321.20 → 324.50 → Supply zone (order block + 2nd Call Wall)
* 🧱 330.48 → 336 → Next upside wall if bulls reclaim trend
🧭 Scalping / Intraday Trade Setup
🟥 Bearish Scenario (Preferred for Now):
* Entry: 316.00–317.00 rejection
* Target 1: 312.00
* Target 2: 305.00
* Stop: 321.50 reclaim
🟩 Bullish Reversal Scenario (Low Probability):
* Entry: Only on breakout and close above 324.50
* Target: 330.00 → 336.00
* Stop: 321 intraday flip back down
🔁 Summary Thoughts
* TSLA broke bullish market structure with a clean CHoCH and is now trading under OB resistance.
* Gamma positioning supports further downside if price stays under 321.
* Strong Put Walls at 305–300 create a natural magnet if breakdown continues.
* Option premiums are relatively cheap — attractive for directional plays.
* Scalpers and swing traders can ride the downside with tight stops; bulls must wait for reclaim above 324.
🚨 Disclaimer:
This analysis is for educational purposes only and does not constitute financial advice. Always do your own research and manage your risk accordingly.

“NVDA Setting Up — Small Triangle, Big Potential”
📈 Trade Snapshot:
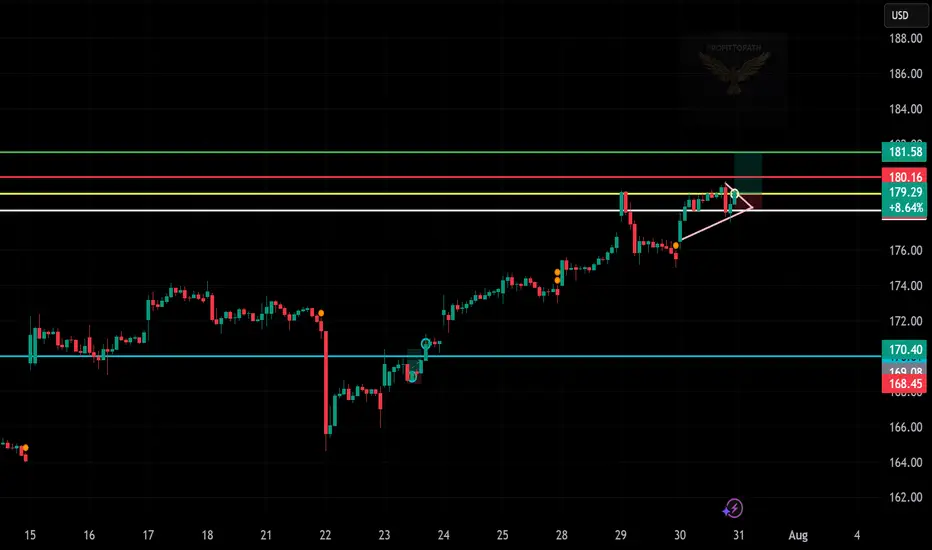
NVDA is forming a mini triangle with higher lows. Breakout above $180.16 could push it toward $181.58.
🎯 Setup:
→ Entry: $179.29
→ SL: ~$176.00
→ Target: $181.58
📌 Tight structure + bullish momentum = strong breakout chance.
📋 Hashtags:
#NVDA #BreakoutSetup #PriceAction #ProfittoPath #SwingTrade #SmartMoney #TechnicalAnalysis #ChartSetup
“AMD Breaks Out — Triangle Setup in Action”
📈 Trade Snapshot:
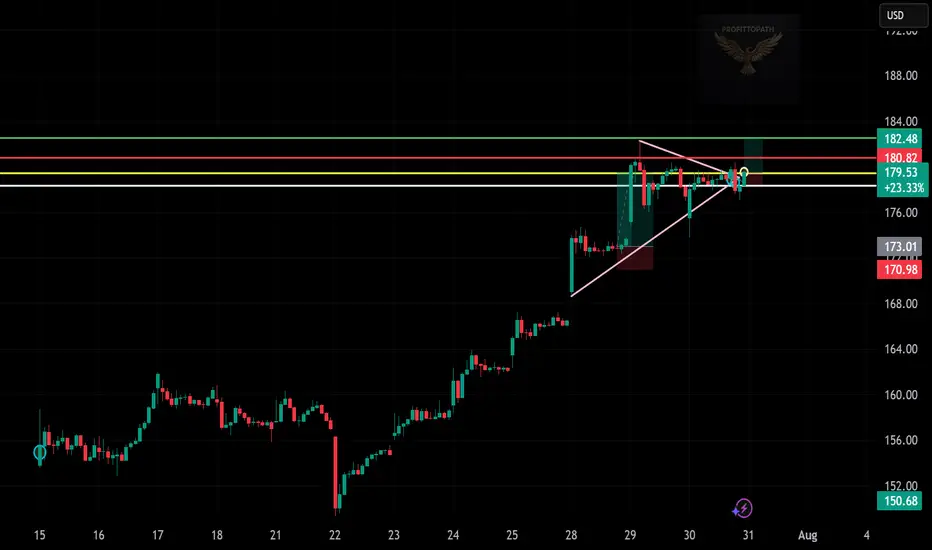
AMD breaks a tight triangle range with momentum. A clean move above $180.82 puts $182.48 in sight.
🎯 Plan:
→ Entry: $179.53
→ SL: ~$173.00
→ Target: $182.48
📌 Clear structure, low-risk entry, breakout confirmed. Let it run.
📋 Hashtags:
#AMD #BreakoutTrade #ChartSetup #TechnicalAnalysis #ProfittoPath #SwingTrade #PriceAction #SmartMoney
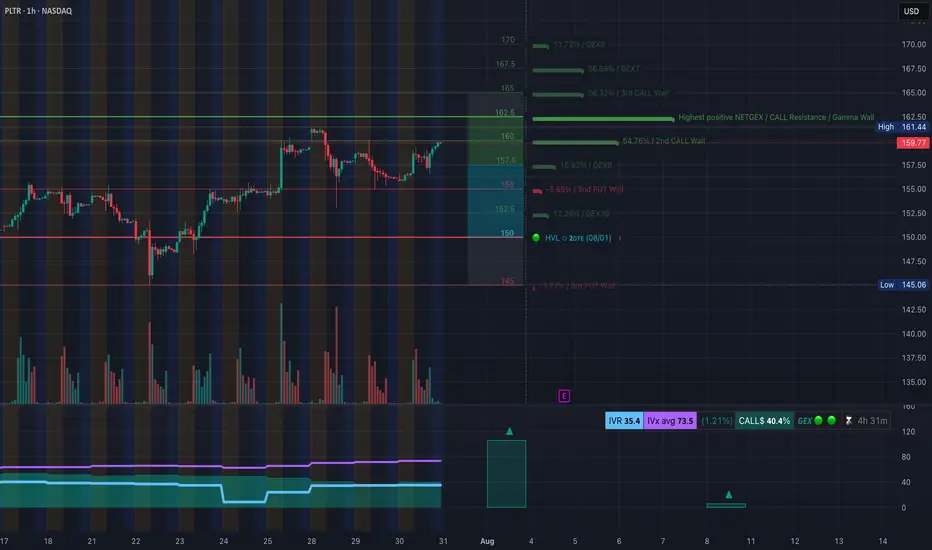
PLTR Breaking Out or Bull Trap? Jul 31PLTR Breaking Out or Bull Trap? Options Flow Says Bulls Might Win!
🔍 GEX & Options Flow Insight (1st Image Analysis)
PLTR is pushing into key resistance around $159.77, just under the 2nd CALL Wall at $161.44, with massive gamma clusters building overhead. Here's the breakdown:
* Call Walls & Gamma Resistance:
* 📍 $159.77 → Current wall that price is testing
* 📍 $161.44 → 2nd CALL Wall / Highest positive NET GEX
* 📍 $165–168 → 3rd Call Wall and deeper GEX levels = high resistance/squeeze potential
* Put Support Zones:
* 🔻 $155.00 / $153.00 / $151.06 → Multiple layers of liquidity and support
* 🛡️ $145.00 → 3rd PUT Wall = Strong downside defense
* Volatility Metrics:
* IVR: 35.4, IVx Avg: 73.5 → High IV suggests elevated premium
* Calls Flowing Heavy (40.4%), Bullish GEX 🌕🟢🟢
* Options sentiment is decisively bullish with strong open interest at upper walls
✅ Option Trading Suggestion:
Bias: Bullish momentum with caution at overhead resistance
Strategy: Debit Call Spread or Vertical Fly
* Entry Idea: Buy 160C / Sell 165C (or 168C) for Aug 2 or Aug 9
* Risk: Price must hold above $156.24 to remain valid
* Target: $161.44 → $165.00 if gamma squeeze plays out
Why this works: PLTR is pressing into a GEX transition zone. If price breaks through $161.44 with volume, dealers will likely hedge net short exposure by buying more, pushing toward $165+. But risk is tight — failure to break 160 convincingly can lead to fast reversal.
🧠 Technical Analysis (1H Chart) (2nd Image Analysis below)
Market Structure & SMC:
* ✅ CHoCH → BOS confirmed mid-July, with aggressive bullish structure
* ⚠️ CHoCH again on July 30 = possible trap or reload
* Price now retesting previous BOS zone under supply
Trendline Analysis:
* Ascending trendline holding support from July 29 to now
* Price approaching upper wedge resistance around $160–161
SMC Zones:
* Order Block Support: Around 156.24–154.91
* Reversal Zone / Supply: Purple box between 159.77–161.44 → Caution for fakeout traps
* Below 153.06, liquidity opens to HVL gap zone at 151–145
🔄 Price Action & Key Levels
* Support:
* ✅ 156.24 → Critical order block + trendline confluence
* ✅ 154.91 → Confirmed demand wick
* 🔻 151.06 → Liquidity base
* ⚠️ 145.00 → 3rd PUT Wall (GEX-based demand)
* Resistance:
* 🔼 159.77–161.44 → Major supply + 2nd Call Wall = high-conviction resistance
* 🚀 165.00 → Next wall for gamma expansion
* 🧨 Above that → Blowoff zone (168+)
📉 Bearish Reversal Zone
If price fails to close above 160 or gets rejected from 161.44, watch for:
* Breakdown to 156.24 → If this fails, opens up to 154.91 then sweep to 151.06
* Options IV is high → risk of premiums collapsing on rejection, so avoid chasing long OTM calls
🔁 Summary Thoughts
* PLTR is coiling tightly under a strong gamma ceiling with a bullish structure intact.
* Option flow shows aggressive CALL positioning, suggesting bulls are betting on breakout.
* Smart money might be stacking up before pushing through 161.44 — or could trap retail and unwind.
* Day traders can long above 157.5–158 on dips toward 160–161.44. Swing traders should avoid entries until breakout confirmation or dip to OB.
* Watch gamma squeeze to 165 if bulls break structure.
🚨 Disclaimer:
This analysis is for educational purposes only and does not constitute financial advice. Always do your own research and manage your risk accordingly.
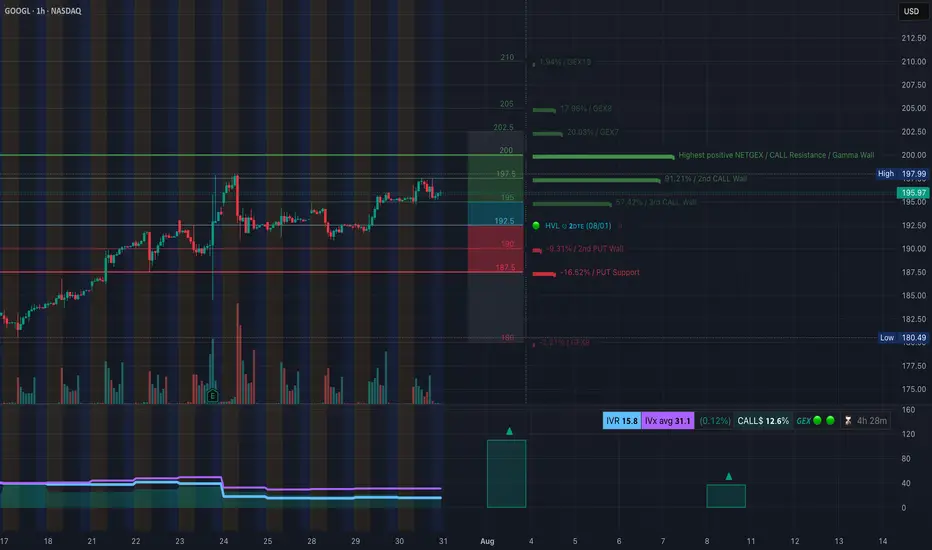
GOOGL Eyeing Gamma Squeeze to $202? Jul 31GOOGL Eyeing Gamma Squeeze to $202? Smart Money Sets the Trap!
🔍 GEX & Options Flow Insight
GOOGL is trading around $196 and sitting just under the 2nd Call Wall at $197.5, with a visible Gamma Wall / Resistance around the psychological $200 level. Here's how GEX is positioned:
* Call Walls:
* 📍 $197.5 → Current hot zone (2nd CALL Wall — 91.21%)
* 📍 $200.00 → Highest Positive NET GEX / Gamma Resistance
* 📍 $202.5 and above → Extreme GEX buildup with potential squeeze fuel
* Put Support:
* 🚨 $188.41 → Strong PUT Support (−16.52%)
* 🔻 Below that: Risk increases toward $187.5 (major demand zone)
* Volatility Context:
* IVR 15.8 and IVx Avg 31.1 → IV is relatively low
* Calls Outweigh Puts (12.6%) → Bullish GEX skew
* Green GEX, Green Sentiment, Long Gamma Zone Active
✅ Option Trading Suggestion:
Bias: Moderately bullish with potential for gamma-driven breakout
Strategy: Debit Call Spread or Naked Call if aggressive
* Entry Idea: Buy GOOGL 195C / Sell 200C (or 202.5C) for Aug 2 or Aug 9 expiration
* Risk: Tight invalidation below 194.50 (under price structure)
* Target: $200–202.5 (Gamma Wall exhaustion)
Why this works: Price is coiled just under a heavy call wall. If GOOGL pushes above $197.5 with volume, gamma hedging can amplify the move to $200+ — where dealers are net short calls and may have to buy shares to hedge.
🧠 Technical Analysis (1H Chart)
Market Structure:
* ✅ Bullish Break of Structure (BOS) confirmed on July 29
* ⚠️ Change of Character (CHoCH) seen on July 30 with a mild pullback
* Currently trading inside a rising channel, respecting trendline support
Trendline:
* Upper trendline rejection seen at ~198
* Lower channel support aligning near 195–195.5
Smart Money Concepts (SMC):
* Order Block Zone formed around 195.75–195.97 = current support
* Premium/Discount zone separation validates possible retest and continuation
* Purple Box = Supply Zone → Sellers active below 198.50
🔄 Price Action & Key Levels
* Support Zones:
* 📌 195.75–195.97 → Order block + Trendline
* 📌 194.91 → Minor support + fib confluence
* 🚨 191.56–190.85 → Liquidity pocket below CHoCH
* Resistance Zones:
* 🚩 197.5–198.5 → Call Wall + Prior swing highs
* 🔼 200.0–202.5 → Gamma squeeze zone / possible parabolic move
📉 Bearish Reversal Zone
If GOOGL fails to reclaim 197.5 or gets rejected again at 198.5:
* Expect retracement toward 195.7 → 194.91
* Breakdown below 194.91 → Opens test of CHoCH zone and fills inefficiency to 191–192 range
🔁 Summary Thoughts
* GOOGL is consolidating near a high-conviction breakout zone.
* GEX flow favors bullish continuation with strong gamma clustering above.
* Smart Money has already swept liquidity and flipped structure; bulls are in control if they defend the OB.
* Scalpers can long dips to 195.75 with stop under 194.91, targeting 198–202.
* Avoid calls above 202.5 unless new GEX builds show extended flow.
🚨 Disclaimer:
This analysis is for educational purposes only and does not constitute financial advice. Always do your own research and manage your risk accordingly.
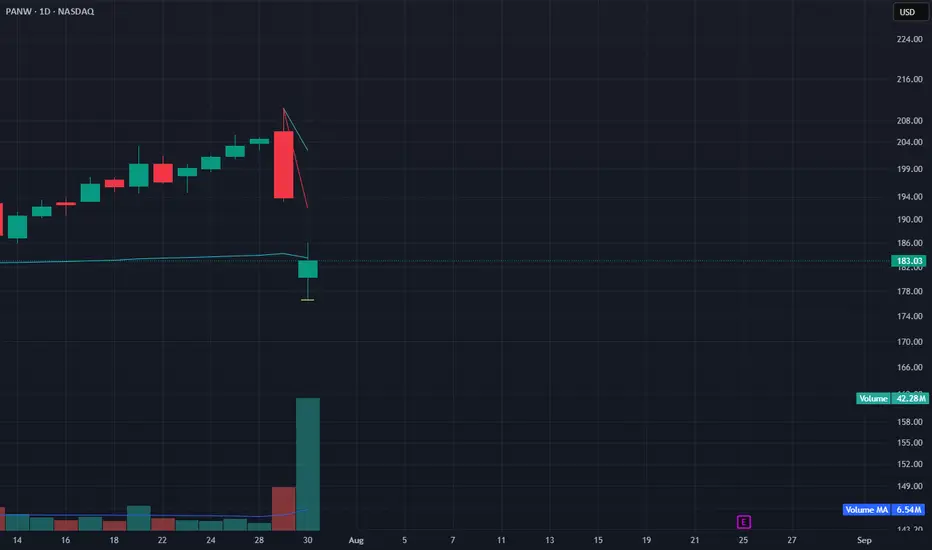
PANW Prints High-Volume Reversal Candle – VWAP Defense Holds forPANW followed yesterday’s breakdown with a high-volume reversal candle today, closing back above the anchored VWAP after flushing below it. Volume exploded to 42.28M (vs. 6.54M avg), confirming institutional activity.
Today’s green candle after a massive red bar forms a potential bullish reversal, especially with the wick undercutting VWAP and closing strong. The failed follow-through by bears may signal seller exhaustion — but confirmation is needed with a close above $186–188 in the next session.
The 30-min chart shows tight consolidation near VWAP intraday. Cautious long setups may emerge if bulls hold this reclaimed zone and break the short-term downtrend.
Indicators used:
Anchored VWAP (support briefly violated but reclaimed)
Volume surge (capitulation + reversal potential)
Price action (bullish reversal candle at key level)
Entry idea: Long above $186 with strength
Target: $194–198
Stop: Below $178 or today's low
MARA: Mining Bitcoin, Diluting ShareholdersMarathon's Q2 results were great. Revenue up 64% to $238M, adjusted EBITDA exploding 1,093% to $1.2 billion, and swinging from a $200M loss to an $808M profit year-over-year. Those are eye-popping numbers that deserve scrutiny. The massive EBITDA jump and profit turnaround are largely driven by Bitcoin's mark-to-market gains, not operational improvements.
What continues to concern me is the dilution story. That $940.5 million raise they just completed might provide "strategic dry powder," but it's coming at the expense of existing shareholders. The company has been aggressively issuing equity, and while the recent numbers look impressive, a significant portion of that value creation is paper gains tied to crypto appreciation.
They're making progress on vertical integration, but a meaningful chunk of their hashrate still relies on third-party hosting arrangements. The all-in mining costs remain a key metric to watch—strong Bitcoin prices can mask underlying operational inefficiencies.
The timing of these results is also worth noting. MARA, like other miners, benefited enormously from Bitcoin's run to new highs and the broader institutional adoption wave we've seen with ETFs and corporate treasury strategies. But as CEO Fred Thiel himself has warned, there are signs of frothiness in the market reminiscent of previous crypto bubbles.
The AI and HPC initiatives still read like a work in progress. While the company talks a good game about diversification beyond pure Bitcoin mining, material revenue contributions from these ventures remain elusive.
Here's my take: MARA's Q2 numbers reflect the perfect storm of operational scale meeting a Bitcoin bull market. The company has undoubtedly grown its mining capacity and BTC holdings significantly. But the headline-grabbing profitability is heavily dependent on crypto valuations staying elevated.
For investors considering MARA at current levels, the key question isn't whether they can deliver strong numbers in a Bitcoin bull market—they've proven they can. It's whether the business model is resilient enough to generate attractive returns if Bitcoin faces a meaningful correction. Given the company's ongoing dilution, operational leverage to BTC prices, and rich valuation multiples, I'd argue there's limited margin of safety built into the current stock price.

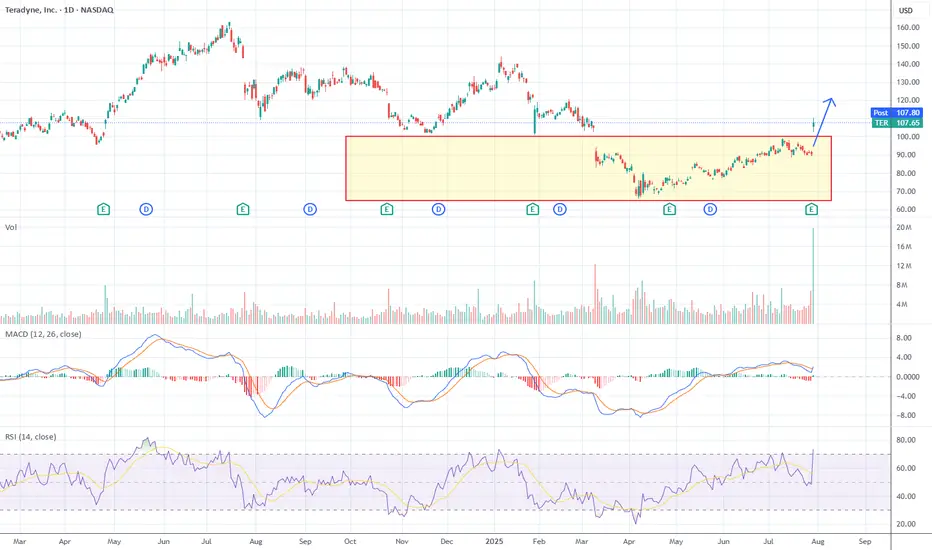
TER Just Ignited: Breakout, Volume Spike and Re-Rating in MotionAlright, if you’re watching Teradyne (TER) right now, this thing just exploded and the chart is absolutely textbook. Let’s break it down for the folks playing technicals and momentum.
Candlestick Action
TER just printed a massive bullish marubozu — up +18.65%, closed right near the high of day. Zero upper wick. That’s pure buying all day long, no hesitation.
This came right after a period of tight compression with small-bodied candles — the kind of coil setup that often precedes big moves. This wasn’t a reversal candle. It’s a momentum ignition bar—triggered by earnings. So if you’re wondering if it’s too late? Probably not. Momentum just turned up.
Trend & Momentum
MACD just flipped bullish a few sessions ago from below zero — that’s the cleanest momentum turn you can get. RSI ripped up to 73.27 — technically overbought, but no divergence. So it’s strong, not stretched. Volume was one of the highest days in the last 6 months. That’s not retail. That’s institutions showing up. This isn’t FOMO. It’s a sentiment shift and potential re-rating moment. Could get vertical if no rejection follows.
Box Logic
Stock had been rangebound in a $65–$100 box for a couple months. Today’s candle blew past the top of that with conviction and volume. That sets up a new Darvas box from $100 to $120, with a measured move target of $117.
Fibonacci Levels (April swing low ~$64 → today’s high $110.50)
If we do get a pullback, watch these levels:
23.6%: $101.43
38.2%: $95.79 (also prior resistance = new support)
50.0%: $87.25
61.8%: $78.70
But if this keeps running (and no rejection shows up soon):
127.2% Fib extension → $124.86
161.8% → $140.22
200% → $157.00
Hit the 100% Fib intraday today. Next logical target = $117–125 range.
Smart Money Behavior
Accumulation phase was clear April to July — tight base, low drama, low volume.
Today was the trigger: gap up + runaway bar = institutions repricing the stock after confirming the catalyst.
No signs of profit-taking yet — no upper wick, no fade into close.
Big money just took control.
Final Read
TER just triggered a clean momentum breakout with institutional support behind it. This looks like a re-rating, not just a post-earnings blip. If it holds $101–102 and doesn’t reverse hard tomorrow, there’s a real shot at seeing $117–125 in the next leg.
Tight stop if you see a reversal candle or big-volume rejection
Play it with discipline. This is one of the cleanest setups we’ve seen from TER in a while.
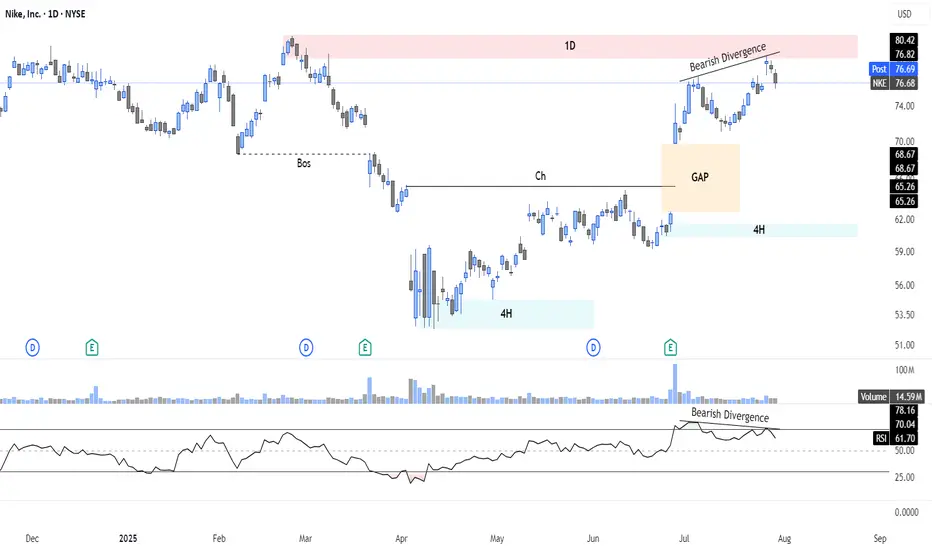
Bearish Setup on Nike ($NKE): Divergence + Supply Rejection📉 I'm watching a high-probability bearish setup on NYSE:NKE , with price rejecting a key 1D supply zone ($77–80) on bearish RSI divergence and fading momentum. A downside gap below adds further confluence.
📊 Technical Context:
Clear 1D supply rejection with divergence
Lower RSI highs vs higher price highs = Bearish divergence
Volume weakening near resistance
Open gap ($65–$68.67) below = magnetic target
Previous BOS indicates potential for continuation move lower
🎯 Strategy Ideas:
Bear Call Spread 80/85 (credit spread with resistance overhead)
Put Debit Spread 75/65 (targeting full gap fill)
⏳ Expiry: Sep 20 – well-timed before IV builds
📌 Setup offers attractive R/R with clearly defined invalidation above $81
🔔 Key Alerts:
$81: "Invalidation – bias flips if breakout confirmed"
$68.67: "Gap close in progress – partial target zone"
➡️ Follow for structured trade setups combining price action, divergence, and options strategies.
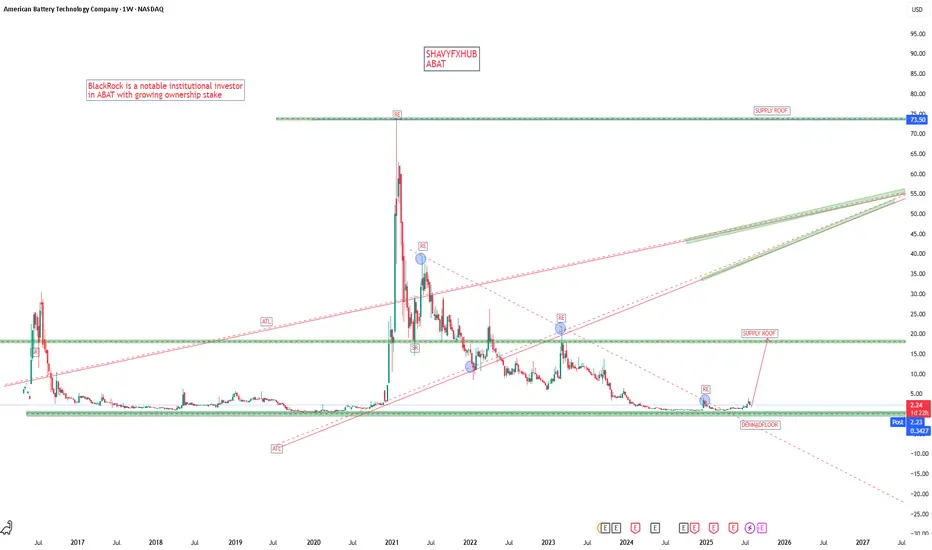
ABATThe American Battery Technology Company (ABAT) is a U.S.-based battery materials and recycling company focused on domestic production of critical battery minerals, including lithium. It has received significant federal support and attention in recent years tied to strategic initiatives to boost domestic mining and manufacturing of battery materials.
BlackRock has bought shares in American Battery Technology Company (ABAT). As of March 31, 2025, BlackRock held approximately 791,296 shares, on June 30, 2025, BlackRock made a significant move by acquiring an additional approximately 3.9 million shares, indicating an expansion of its stake in ABAT.
Key recent developments about ABAT include:
ABAT received a $900 million Letter of Interest from the U.S. Export-Import Bank (EXIM Bank) to finance its Tonopah Flats Lithium Project in Nevada, which involves building a lithium mine and a lithium hydroxide refinery with a capacity of 30,000 tonnes per year. This financing aligns with the U.S. government’s initiatives to strengthen domestic critical mineral supply chains and reduce dependence on China.
The Tonopah Flats project is considered one of the largest known lithium deposits in the U.S., and ABAT has demonstrated its ability to produce battery-grade lithium hydroxide at pilot scale from the lithium-rich claystone resource there.
ABAT has also secured a $150 million grant from the U.S. Department of Energy to build a second commercial-scale lithium-ion battery recycling facility, further supporting the domestic supply chain for battery metals critical to electrification and sustainability efforts. This facility will create hundreds of jobs and promote environmentally sustainable battery materials manufacturing.
The federal support for ABAT ties into broader government strategies such as the “Make More in America” initiative and the March 2025 Executive Order on increasing American mineral production.
The company’s CEO, Ryan Melsert, has expressed that these government endorsements validate ABAT’s mission to commercialize technologies for both primary mining and secondary lithium-ion battery recycling.
In summary, the American Battery Technology Company (ABAT) is a key player in the U.S. domestic battery materials sector, leveraging federal funding and policy initiatives to develop a large-scale lithium mine and refinery in Nevada, as well as expand battery recycling facilities to help secure and localize the battery materials supply chain.
#abat #stocks
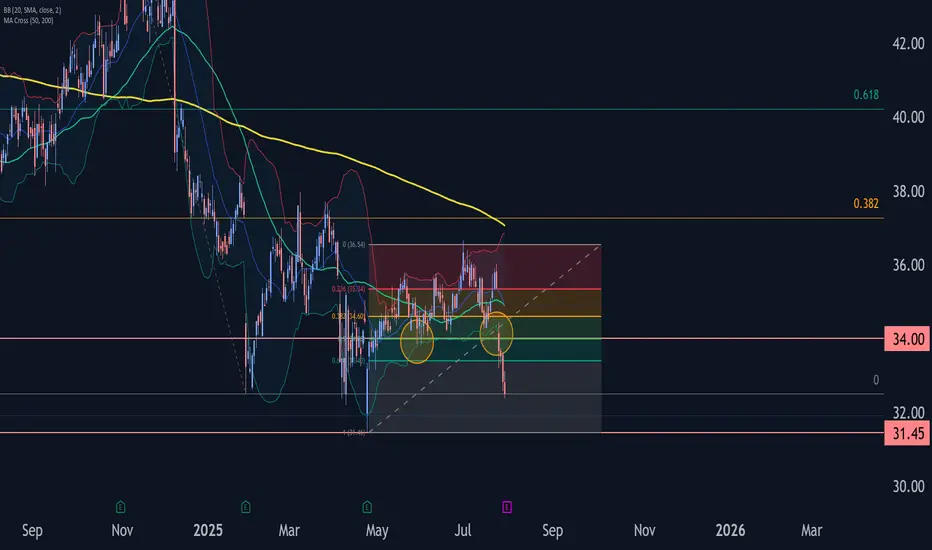
Comcast Wave Analysis – 30 July 2025- Comcast broke the support zone
- Likely fall to support level 31.45
Comcast recently broke the support zone located between the support level 34.00 (which has been reversing the price from the start of May) and the 50% Fibonacci correction of the upward wave A from April.
The breakout of this support zone accelerated the active impulse wave c, which belongs to wave B from June.
Given the clear daily downtrend, Comcast can be expected to fall further to the next support level 31.45 (former multi-month low from April).
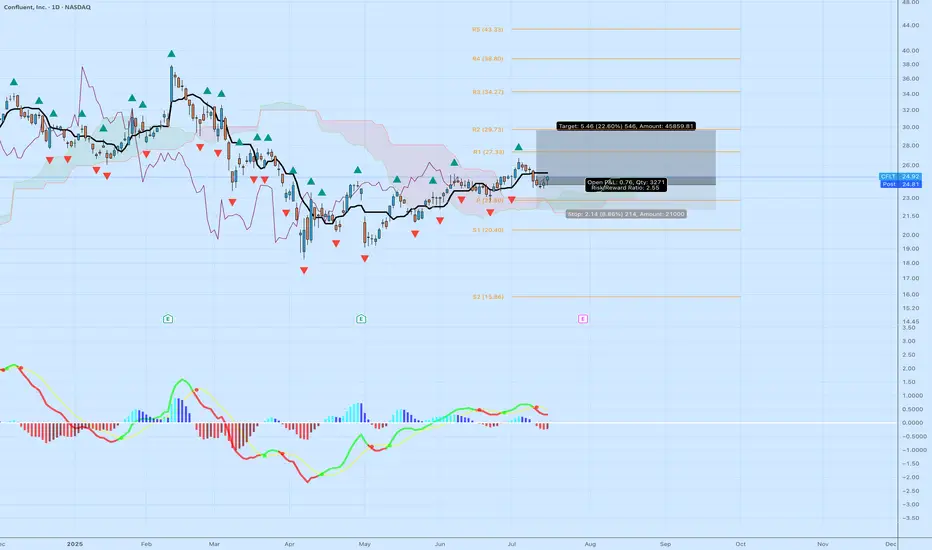
CFLT: Bullish Momentum Breakout Targeting $29.76 – Strong R/R Ticker: NASDAQ:CFLT (Confluent, Inc.)
Bias: Long
Timeframe: Daily (with momentum building from May lows)
Entry: Around $24.30 (near recent breakout above pivot at $22.80)
Stop Loss: $22.14 (below swing lows, ~8.86% risk)
Target: $29.76 (near R2 resistance, ~22.60% reward)
Risk/Reward Ratio: 2.35:1
Position Sizing Suggestion: Limit risk to 1-2% of capital (e.g., ~$21,000 total risk on 3,271 shares as shown)
Confluent (CFLT) is showing strong bullish momentum on the daily chart, breaking out from a multi-month consolidation base between $18–$23 since April 2025 lows. The price has formed higher highs and lows, supported by a bullish MACD crossover (green signal line above red, positive histogram bars), indicating accelerating upside potential. RSI is neutral around 54–60, leaving room to run without being overbought. Volume has ticked up on recent green candles, confirming buyer interest.
From a smart money perspective, institutional ownership stands at ~78%, with net buying in Q2 2025 (e.g., hedge funds adding ~7.1M shares). This aligns with Confluent's growth in real-time data streaming for AI and cloud applications, boosted by the July 2025 AWS Marketplace expansion for AI agents. Fundamentals support this: Q1 2025 beat expectations (EPS $0.08 vs. $0.07, revenue +26% YoY, Cloud segment +42%), though guidance was conservative amid macro IT spending slowdowns.
Pivot points guide the trade: Break above P ($22.80) targets R1 ($27.33) then R2 ($29.73, close to my $29.76). If momentum holds (e.g., breakout above $25.82), we could see extension to $31–$32 based on analyst averages (Moderate Buy consensus, target ~$31.50 from 30 analysts).
Risks to Watch: Upcoming Q2 earnings on July 30 could introduce volatility—consider trailing stops or exiting beforehand if holding through. Competition from hyperscalers (AWS, GCP) and broader tech sector dips (CFLT beta 1.71) could pressure if support fails. Not financial advice; always DYOR.
If you agree with this setup or have thoughts on CFLT, drop a comment below! Hit like if this helps, and follow for more ideas. Let's see how this plays out—I'll update as needed. 🚀
New Setup : $MUThe hourly chart sees a bullish crossover, bullish ATR Break, and Bullish Price Action already out.
Ready To catch it

RDDT Earnings Play — July 30 (BMO)
## 🚀 RDDT Earnings Play — July 30 (BMO)
**🎯 Bullish Call Trade | 75% Confidence | High Momentum Setup**
---
### 📈 REDDIT, INC. (RDDT) – EARNINGS SNAPSHOT
🧠 **Revenue Growth**: +61.5% TTM — AI + Ads combo paying off
💸 **Margins**:
• Gross: 90.8% ✅
• Op: 1.0% 🚩
• Profit: 8.1% 👍
🧾 **EPS Surprise Streak**: ✅ 5 for 5 | Avg. +191%
🎯 **Target Price**: \$155.58 (+9.5%)
⚖️ **Forward P/E**: 222.6 — Rich but justified?
**Score: 8/10**
📊 Sector: Comm Services (AI-driven tailwinds)
---
### 💥 OPTIONS FLOW SNAPSHOT
💰 Calls Stack at \$150 & \$160
🛡️ Puts cluster \$140–\$149 = Hedges, not bearish bets
📉 IV High = Juicy premiums
📈 Gamma Bias: Positive Skew
**Score: 7/10**
---
### 🔍 TECHNICAL CHECK
📍 Price: \~\$145.32
🧭 20D MA: \$147.89
📊 RSI: 59.5 (Momentum neutral, room to run)
🔓 Resistance: \$150
🛡️ Support: \$140
**Score: 6/10**
---
### 🌎 MACRO CONTEXT
🧠 Sector tailwinds from AI hype + digital ad rebound
🛑 No major regulatory red flags
**Score: 8/10**
---
## 🔥 THE TRADE SETUP
**📈 Direction**: Bullish
🎯 **RDDT 08/01 \$150C**
💸 **Entry**: \$9.55
🛑 **Stop Loss**: \$4.78
📈 **Target**: \$19.55+
🧮 **Size**: 1 Contract = \$955 Risk
🕒 **Entry Timing**: Pre-earnings close
📆 **Earnings Time**: BMO (Before Market Open)
📊 Expected Move: \~5%
📈 Setup = High risk / High reward, theta-sensitive
---
## ⚡ TRADE PLAN
✅ Take partial profit at 100%, full at 200%
⏳ Exit within 2H post-ER if target unmet
🛑 Cut below \$4.78 to cap drawdown
---
## 🧠 CONVICTION SCORE
🎯 75% Bullish Bias
📊 Based on fundamentals, options, and flow
📉 Risk = Valuation + Thin Op Margin
📈 Reward = Explosive upside w/ surprise history
---
💬 **Watch for \$150 breakout. If cleared post-ER = moonshot to \$160 possible.**
📢 #RDDT #EarningsTrade #RedditStock #CallOptions #AIStocks #TechMomentum #OptionsFlow #IVSurge #TradingViewIdeas #SwingTrade #OptionsStrategy #VolatilityPlays #RDDTstock

AMZN Earnings Play — July 30 (AMC)
## 🚀 AMZN Earnings Play — July 30 (AMC)
**💵 High Conviction Call Trade | 85% Confidence**
📈 **Amazon (AMZN)** — Cloud + Consumer Power Combo
🧠 Setup driven by earnings momentum, bullish flow, and macro strength.
---
### 🔍 FUNDAMENTALS SNAPSHOT
✅ **Revenue Growth**: +8.6% TTM
✅ **Margins**: Profit 10.1%, Op 11.8%, Gross 49.2%
🎯 **EPS Beat Streak**: 8/8 with avg. surprise of +34.7%
🔮 **Consensus Target**: \$252.03 (+9.4% upside)
📌 AWS + AI + Cost control = 🔥 upside setup
🟢 **Score: 9/10**
---
### 📊 OPTIONS FLOW SIGNAL
💰 **High OI**: \$232.50, \$240, \$247.50 calls
📈 **Call/Put Ratio**: Bullish Skew
🛡️ **Put Hedging** ≠ Bearishness
📉 Expected Move: \~5%
⚖️ **Gamma Bias**: Bullish above \$240
🟢 **Score: 8/10**
---
### 📉 TECHNICAL SETUP
📍 Price: \$231.01
📈 20D MA: \$226.21 (Support)
📉 RSI: 66.71 (momentum building)
🔒 Resistance: \$242.52 (watch for breakout)
🟢 **Score: 8/10**
---
### 🌐 MACRO TAILWINDS
🧠 AI & Cloud Momentum 🚀
💹 Consumer spending rebound
🔧 Regulatory risk mitigated via diversification
🟢 **Score: 8/10**
---
## 🎯 TRADE IDEA
🟩 **AMZN 08/01 \$247.50 Call**
💸 Entry: \$0.86
🎯 Target: \$2.58 (200%)
🛑 Stop: \$0.43 (50% loss)
⏰ Entry: **July 30 — Pre-close**
📏 Max Risk: \$86
💰 Max Reward: \$258
🧠 IV Crush Defense: Exit 2H post-ER
---
## ⚡️ WHY THIS WORKS
✅ 8-straight beat streak
✅ Fundamentals + Technicals = aligned
✅ Flow + Macro confirm direction
📈 Setup = asymmetrical upside
---
🎯 Tag your earnings sniper crew
📈 #AMZN #EarningsTrade #OptionsFlow #AmazonStock #CloudAI #OptionsStrategy #EarningsPlays #TradingView #SwingTrade #CallOptions #VolatilityTrade #EarningsMomentum

New Setup : $GPNThe daily chart sees a bullish crossover with a small pullback on the ema 50d.
New Bullish ATR Alert popped out as well
Ready To Catch it !!

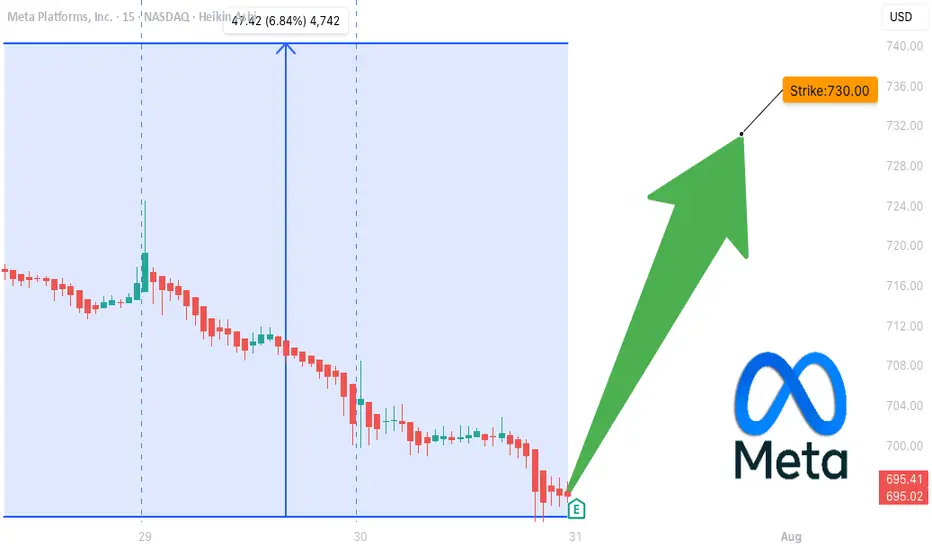
META Earnings Trade Setup — July 30 (AMC)
## 🧠 META Earnings Trade Setup — July 30 (AMC)
📈 **META (Meta Platforms Inc.)**
💥 **Confidence**: 85% Bullish
💡 **Play Type**: Pre-earnings call option
📊 **Fundamentals + Flow + Setup = High Conviction Swing**
---
### 📊 FUNDAMENTALS SNAPSHOT
✅ **Revenue Growth**: +16.1% YoY
✅ **Profit Margin**: 39.1%
✅ **Gross Margin**: 81.8%
📈 **8/8 EPS Beats** — Avg Surprise: +13%
🧠 **Digital Ad Rebound + AI Integration = Growth Engine**
🟢 **Score: 9/10**
📌 Bottom line: Elite execution + consistent guidance beats
---
### 🔥 OPTIONS FLOW CHECK
💰 **Call Walls**: \$720 / \$730
📈 **Call/Put Skew**: Bullish tilt
🔎 **IV Rank**: 0.65 — High enough for a move, not extreme
📈 **Market Expectation**: \~6% move
🟢 **Score: 8/10**
📌 Institutional flow leans long — smart money eyes upside
---
### 📉 TECHNICAL SETUP
📍 **Price**: \~\$700
📉 RSI: 34.34 → OVERSOLD
📉 20D MA: \$713.27 (near-term bounce target)
📌 Support: \$692.50 | Resistance: \$720
🟡 **Score: 7/10**
📌 Post-consolidation rebound setup into earnings
---
### 🌎 MACRO CONTEXT
💡 Growth + AI names in focus
📢 Communication Sector → Risk-On Rotation
📌 META riding digital ad/AI secular trends
🟢 **Score: 8/10**
📌 Macro tailwinds match company strengths
---
## 🎯 TRADE IDEA
**META 08/01 \$730 CALL**
💵 Entry: \$10.00
🎯 Target: \$30.00 (300% ROI)
🛑 Stop: \$5.00 (50% loss cap)
⏰ Entry: Pre-close on July 30 (AMC earnings)
📏 Size: 1 Contract (Risk \$1,000 max)
### ⚖️ Risk/Reward
* Max Risk: \$1,000
* Target Profit: \$3,000
* IV Crush Protection: **Exit within 2 hours post-earnings**
---
## 📌 WHY IT WORKS
✅ Meta beats 8 straight quarters
✅ Fundamentals elite
✅ Bullish options stack
✅ Oversold tech setup
⚠️ Risk? Always — but *structured speculation wins* 📐
---
📣 Tag someone who trades earnings like a sniper 🎯
\#META #EarningsPlay #OptionsTrading #IVCrush #CallOptions #TechStocks #AIStocks #TradingView #DigitalAds #SwingTrade #StructuredRisk
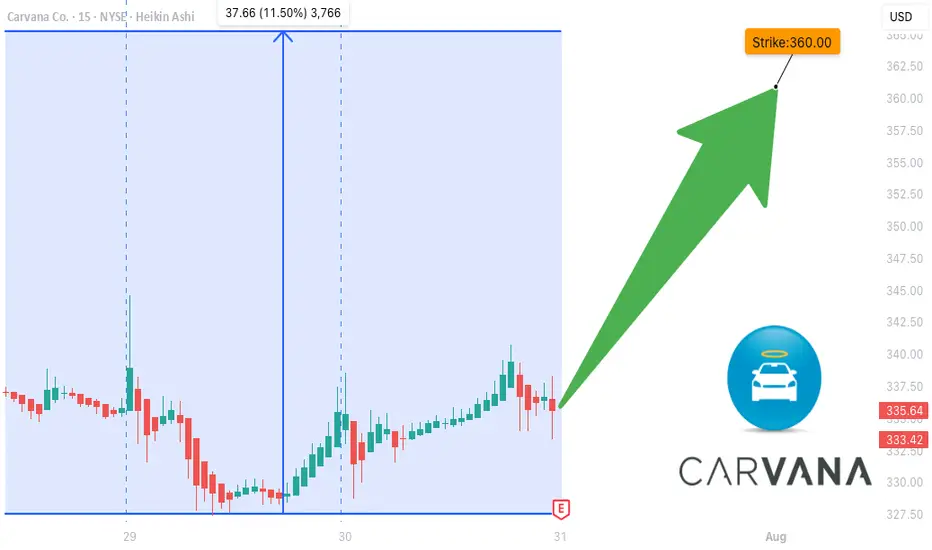
CVNA EARNINGS TRADE IDEA — July 30 (AMC)
## 🚗 CVNA EARNINGS TRADE IDEA — July 30 (AMC)
**Carvana (CVNA)**
📊 **Bullish Confidence**: 85%
📈 **Earnings Play Setup**
💣 Big Volatility + Strong History = Explosive Potential
---
### ⚙️ FUNDAMENTALS SNAPSHOT
✅ **Revenue Growth**: +38.3% YoY
🔁 **8/8 EPS Beats** (114.5% avg surprise)
🟡 **Profit Margin**: 2.7% (Thin but improving)
⚠️ **Debt-to-Equity**: 344.78 (High leverage risk)
💬 **Sector Rotation**: Growth favors high-beta names
💡 **Beta**: 3.60 → Big post-earnings swings likely
---
### 📊 OPTIONS FLOW HEATMAP
🔥 Heavy Call Volume @ \$360–\$370
🟢 Bullish OI Stack
📉 Put/Call Skew: CALL DOMINANT
💥 IV Elevated = Lotto ticket pricing
---
### 📈 TECHNICALS
💵 Price: \$336.50
🧱 Resistance: \$343.68
📉 RSI: 44.5 (Neutral – Room to Run)
📊 200D MA: \$252.21 → Long-term bullish positioning
---
### 🔥 TRADE IDEA:
**CVNA 08/01 \$360 CALL**
🎯 **Entry**: \$11.25
🚀 **Target**: \$33.75 (200% ROI)
🛑 **Stop**: \$5.60
📊 **Size**: 1 contract
⏰ **Entry Timing**: Pre-Earnings Close (AMC play)
---
### 📉 RISK / REWARD
* 🟥 Max Loss: \$11.25
* 🟩 Profit Target: \$33.75
* ⚖️ RR Ratio: 1:3
* 💼 Portfolio Risk: 2–3%
---
### 🧠 STRATEGY INSIGHTS
✅ Historical beat rate = STRONG
✅ Bullish options skew = CONFIRMED
⚠️ High debt = risk, but momentum > fear
📌 Tip: If IV crushes post-earnings, exit fast. This is a *structured speculative play* — not a hold-and-hope.
---
📢 "Speculation is fine. Structure it."
💬 Tag a trader who *YOLOs with stop losses* 👇
\#CVNA #EarningsPlay #OptionsTrading #TradingView #HighBeta #LottoPlay #RiskManaged #CallOptions #BullishSetup #IVCrushProof #EcommerceStocks #EarningsSeason
7/30/25 - $algn - Beat, but i'm only dip buying7/30/25 :: VROCKSTAR :: NASDAQ:ALGN
Beat, but i'm only dip buying
- 20x PE for growth, leadership position, 5% fwd fcf gen... great
- consumer names on mgn doing just fine as we over spend from the mar/apl pullback
- a higher cost discretionary purchase? hrm. tough to say.
- i think result is +ve and stock is higher. it's health-care-adjacent and not an insurance company or pharma (cough NYSE:NVO ) at-risk industry
- any decent result but smaller either "beat" or w/e on the mgn that sends this back toward $180... has me dip buying (though that's not my expectation, just my reaction function - and unless there's a real stink bomb inside the print)
V

$WLGS very nice set-upThe price seems to be consolidating above SMA50. Awaiting entry signal to get in! Nice update

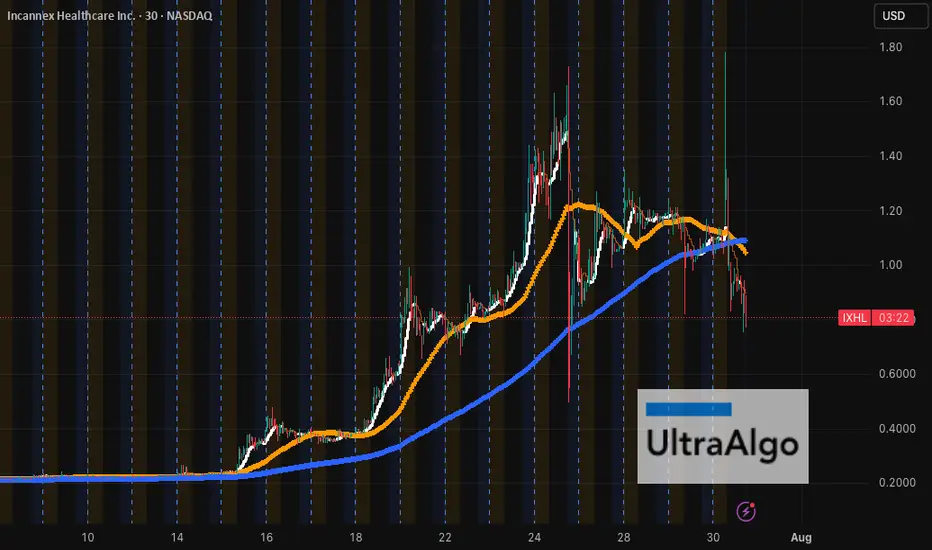
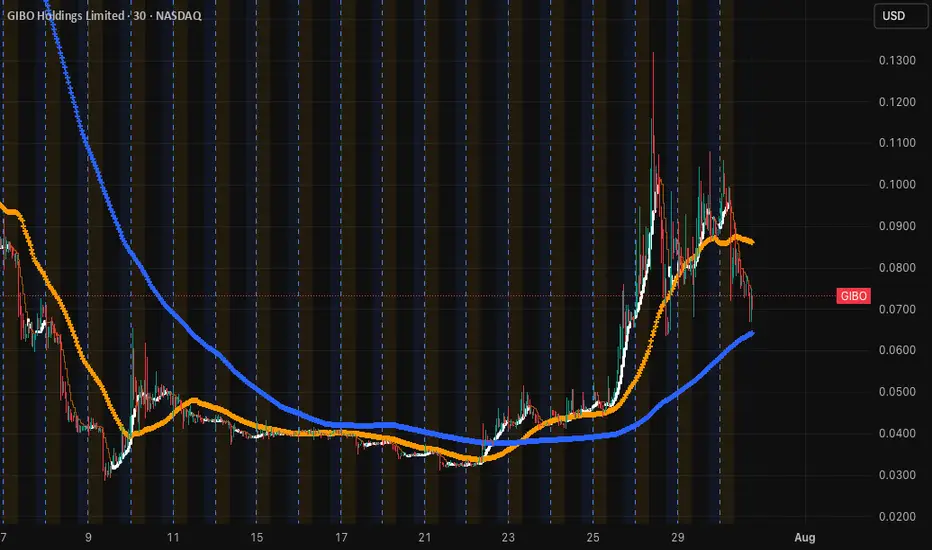
$GIBO drowning, but holding Key Support Above $0.065Now at $0.0731, NASDAQ:GIBO is trading below its 50-period SMA (~$0.0800) but above its 200-period SMA (~$0.0650) on the 30-minute chart. The stock has been consolidating after pulling back from the $0.0975 resistance zone, and the $0.0650 support level is critical to hold for bulls. Seems like it could bounce back up from SMA200. Let's wait for a nice entry confirmation. A clean breakout above the SMA50 could open room for upside momentum. Using UltraAlgo Optimizer to catch the next gorgeous set-up — charting tomorrow’s giants with UltraAlgo.
$IXHL Confirms Bearish Crossover BreakdownTrading at $0.83, NASDAQ:IXHL is now below both its 50-period SMA (~$0.95) and its 200-period SMA (~$1.00), following a bearish crossover where the longer-term trend overtook the short-term one. The stock just broke key support at $0.83, and failed to hold bullish momentum from the $1.24 resistance zone. Momentum is fading fast. UltraAlgo flagged it early — charting tomorrow’s giants with UltraAlgo.