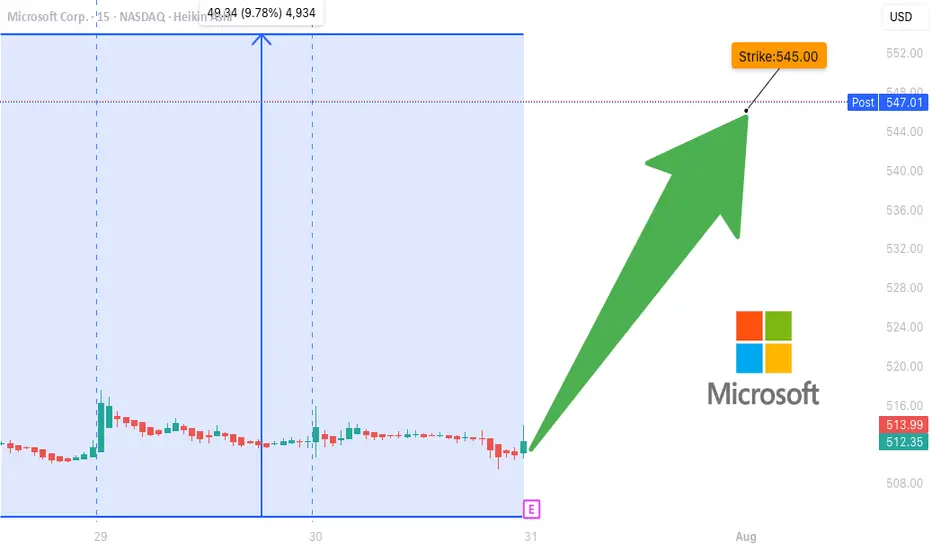
MSFT Earnings Play (2025-07-31) — STRONG BULLISH SETUP
**🚨 MSFT Earnings Play (2025-07-31) — STRONG BULLISH SETUP 🚨**
**Microsoft \ NASDAQ:MSFT Pre-Earnings Trade Idea — 545C (Aug 1)**
---
### 🧠 **Earnings Thesis (🔥 80% Conviction)**
MSFT is set to report **BMO July 31**, and all signs point *bullish*:
📈 **Revenue Growth**: +13.3% YoY, driven by **AI + Cloud** momentum
💰 **Margins**: Profit 35.8%, Op 45.7%, Gross 69.1% — textbook pricing power
📊 **Guidance**: 100% beat history, avg. +5.8% surprise
📌 **Analyst Consensus**: 💪 Strong Buy | Target: \$549.90
📊 **Sector Tailwinds**: Tech favored in current macro with Fed on hold
➡️ **Score: 9/10 Fundamentals | Bullish Momentum Across the Board**
---
### 🔍 **Options Flow & Technicals**
🔥 **Implied Move**: \~6.3% by Aug 1
📉 **IV Rank**: 0.75 (Room to expand post-earnings)
💸 **Call Flow**: Strong OI in 540–550 zone, gamma buildup may fuel squeeze
📊 **RSI**: 70.14 → Bullish, close to overbought
📈 **Support**: \$505 | **Resistance**: \$518.29
➡️ **Score: 8/10 Options | 8/10 Technicals**
---
### 🧨 Trade Setup: 545 CALL (Aug 1 Exp)
🎯 **Entry Price**: \$0.90
📅 **Expiry**: 2025-08-01
📈 **Profit Target**: \$1.80 (⚡️+100%)
🛑 **Stop Loss**: \$0.45
📐 **Size**: 2 contracts (2% portfolio risk)
💡 **Timing**: Enter **EOD July 30 (Pre-earnings)**
⚠️ **IV Crush Alert** → Exit within 2 hours *post-earnings*
---
### ✅ RISK PLAN
* Position: Max 2–3% of portfolio
* IV crush & gap protection: Tight stop and quick post-earnings exit
* Exit Plan: \$1.80 or Stop \$0.45, OR close manually after earnings move
---
📊 **Trade JSON Snapshot**
```json
{
"ticker": "MSFT",
"direction": "CALL",
"strike": 545,
"entry": 0.90,
"target": 1.80,
"stop": 0.45,
"expiry": "2025-08-01",
"entry_time": "EOD Jul 30",
"earnings_date": "2025-07-31 BMO",
"confidence": "80%",
"expected_move": "6.3%",
"iv_rank": "0.75"
}
```
---
🧠 **Summary**
MSFT is poised for a **clean earnings beat** with bullish fundamentals, strong options flow, and upside momentum. This is a **high-conviction, short-dated trade** with defined risk.
🎯 **Watchlist it. Size smart. Exit fast.**
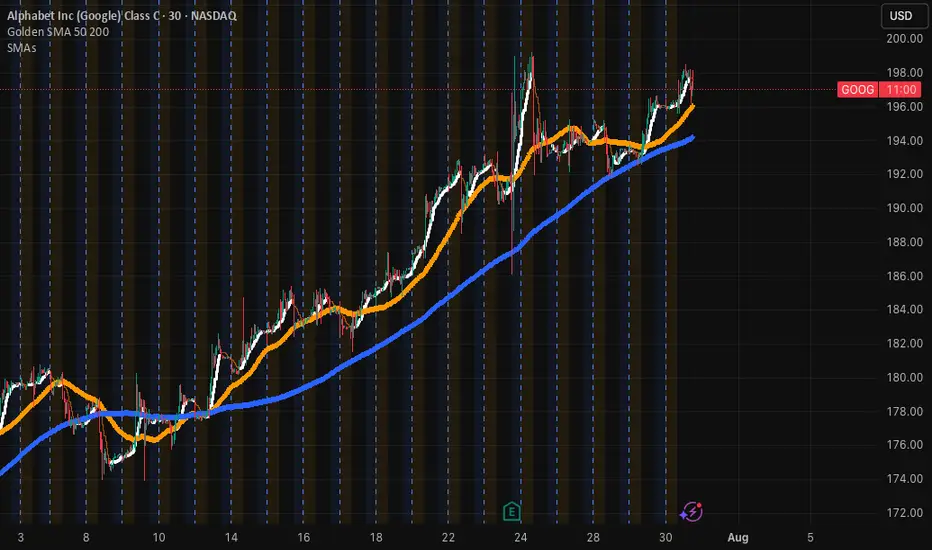
$GOOG Eyes Breakout Above $198Currently at $197.12, NASDAQ:GOOG is trading above both its 50-period SMA (~$196.00) and 200-period SMA (~$192.50) on the 30-minute chart. The trend remains bullish with support holding firm at $192.50, and bulls are watching closely as the price flirts with resistance near $198.75. This steady grind higher signals strength and trend continuation. Using UltraAlgo Optimizer to catch the next gorgeous set-up — charting tomorrow’s giants with UltraAlgo
Apple - The next major push higher!🍎Apple ( NASDAQ:AAPL ) will head for new highs:
🔎Analysis summary :
Apple has been underperforming markets for a couple of months lately. However technicals still remain very bullish, indicating an inherent and substantial move higher soon. All we need now is bullish confirmation and proper risk management and this setup looks very decent.
📝Levels to watch:
$200, $300
🙏🏻#LONGTERMVISION
Philip - Swing Trader

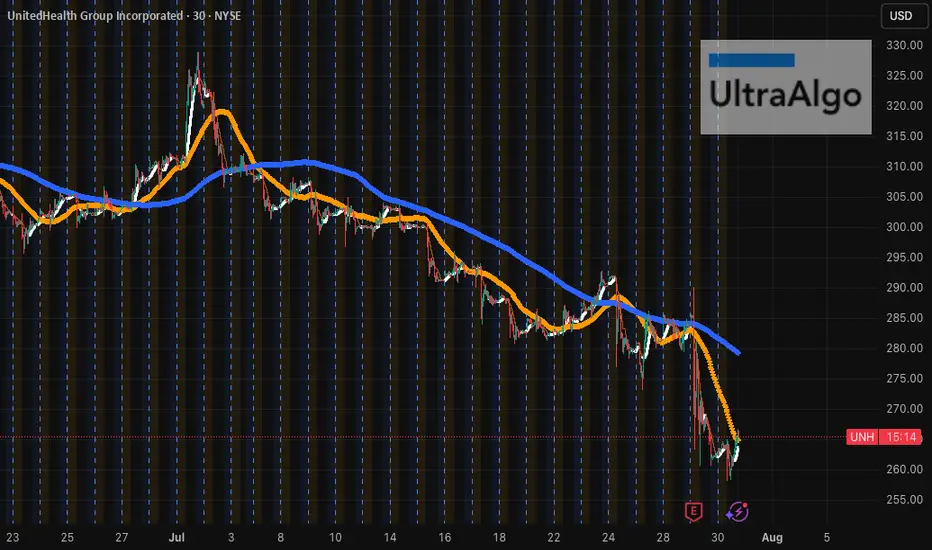
$UNH Fighting Back After Sharp DropCurrently at $265.46, NYSE:UNH is trading below both its 50-period SMA (~$270.00) and 200-period SMA (~$285.00) on the 30-minute chart. The stock found support at $260.00, where it staged a small bounce, but it remains under pressure with clear resistance at $312.29. The trend remains bearish until a stronger reversal emerges. Awaiting UltraBuy signal — charting tomorrow's giants with UltraAlgo.
Nvidia - This is clearly not the end!📐Nvidia ( NASDAQ:NVDA ) will confirm the breakout:
🔎Analysis summary:
Over the past couple of months, Nvidia managed to rally about +100%, reaching top 1 of total market cap. Most of the time such bullish momentum just continues and new all time highs will follow. But in order for that to happen, Nvidia has to confirm the all time high breakout now.
📝Levels to watch:
$150
🙏🏻#LONGTERMVISION
SwingTraderPhil

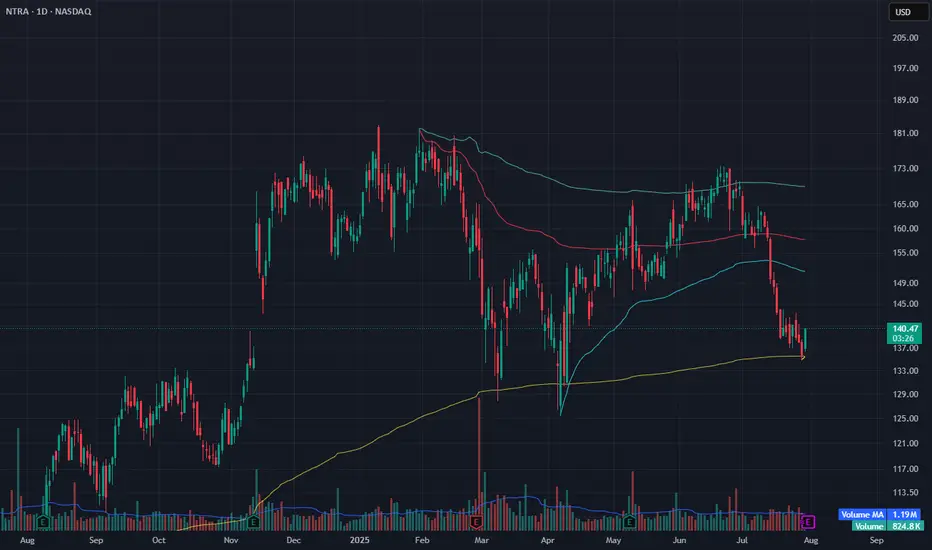
NTRA Bounce from Anchored VWAP – Oversold Relief or Reversal?NTRA bounced +3.23% today off the yellow anchored VWAP support level, which has historically acted as a strong longer-term pivot. After several red candles and a steep pullback from the $165 area, this reaction at VWAP could mark either a short-term relief rally or the start of a base.
Volume was light (800K), so conviction is limited, but the technical bounce at a key anchored level makes this a chart to watch. Confirmation above $143–145 could set up a move back toward $153–155.
Indicators used:
Anchored VWAP (support reaction zone)
Volume (low – watch for increase on continuation)
Oversold context after extended decline
Entry idea: Above $143 with strength
Target: $153–155
Stop: Below $136 or yellow VWAP close
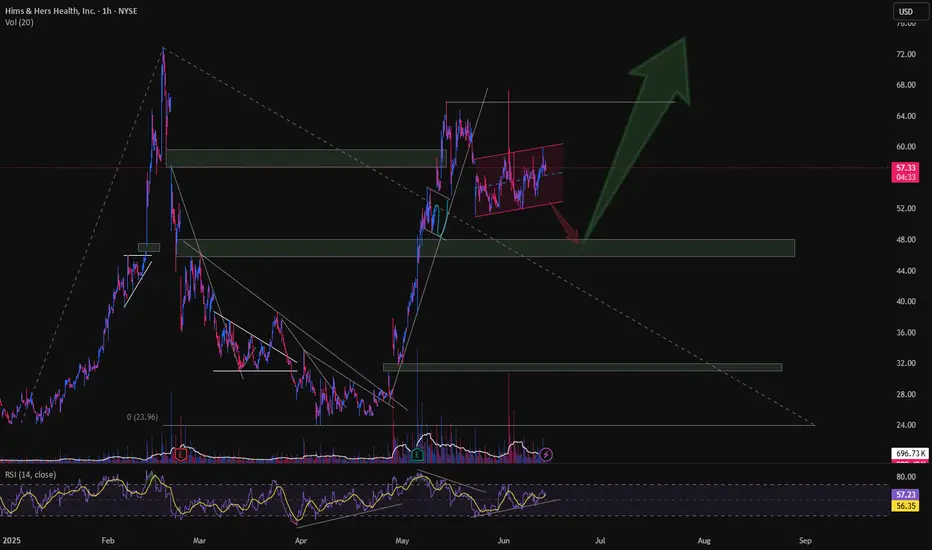
HIMS - Wait for it, don't rush itI would wait for the correction to complete around the 45 zone, then start adding when the parallel channel breaks. It has already faked out once. Do not fall for this.
Generac Breaking OutSolid earnings and copper prices are tanking, the bullish golden cross has occurred and this stock is off to the races. This has the potential to start a new bull run. Keep an eye on it, if it breaks the weekly this could get interest. Not financial advice...

KSS Uptrend HoldsKSS has been trading down since the spike and should hold its uptrend into earnings. Brokers will raise borrow costs and if GDP is any guide, KSS should have better than expected results for earnings.

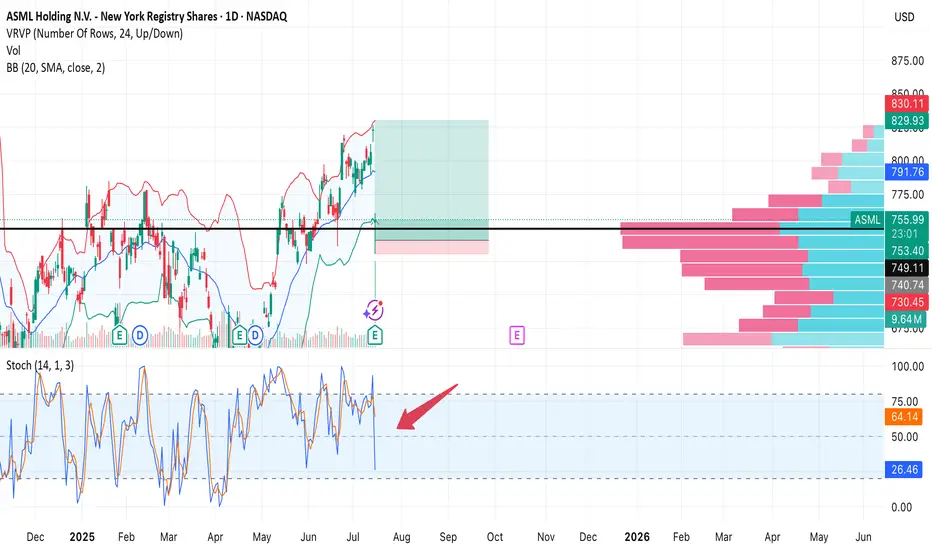
ASML — Strong earnings, sharp drop on profit-taking. Second chanAfter a strong quarterly report, NASDAQ:ASML stock initially surged, but then dropped -7.6% in a single session. Most likely due to profit-taking and a broader tech sector correction. Still, the key $754 support held, and the uptrend remains intact.
Trade Setup:
• Buy Zone: $754–760 (on retest)
• Target: $849 (+12%)
• Stop Loss: $730 (below support and volume shelf)
• Risk/Reward: 1:8
Earnings were great, fundamentals are solid. This drop could be a shakeout before continuation. As long as $754 holds, bulls have a second chance.
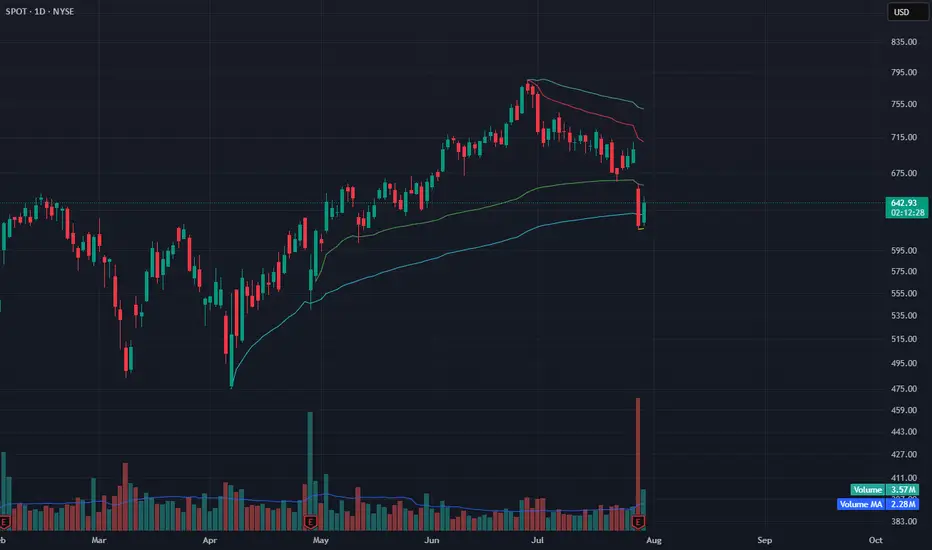
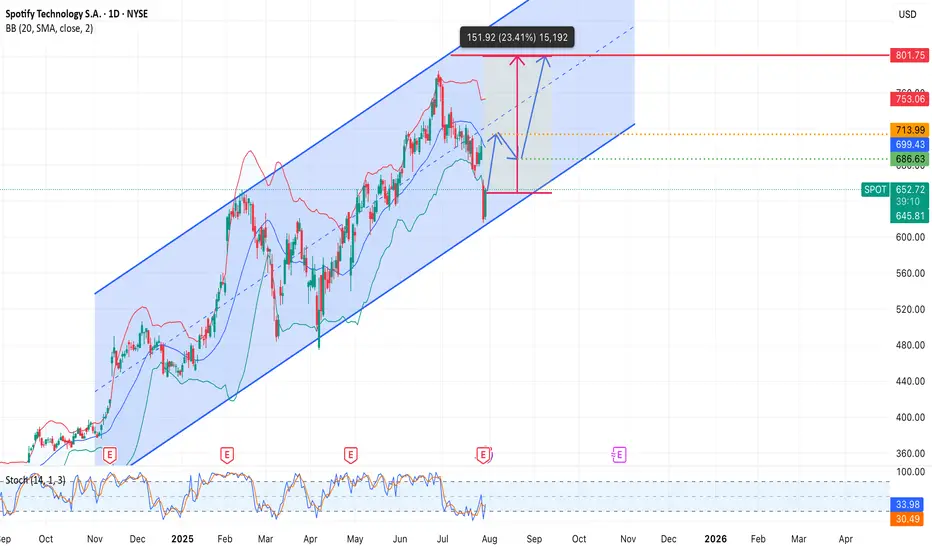
SPOTIFY-Turn the Music Up!NYSE:SPOT
Why did profit drop?
Spotify reported an operating loss of $75M — at first glance, that looks bad. But there’s logic behind it:
• Increased spending on marketing and podcast development (long-term investment)
• Higher royalty payments — short-term pressure
• Expansion of features and product offerings — costs now, growth later
What’s good?
• Revenue up 17% YoY — Spotify keeps growing steadily
• Premium subscribers +14% — user base continues to expand
• Streaming cost per user is decreasing
• Podcasts and audio ads growing faster than expected
• Announced $1B share buyback program
Technically:
• Bounce from the bottom of the rising channel — strong support
• Upside potential to $800 (~+23%) if trend holds
Spotify is investing in growth. Yes, it hurts earnings now, but markets care more about direction than past numbers. And right now, the arrow points up.
BHVN at long term support lineBottoming signs near $13.20 with today's strong bounce.
Still inside a high-risk consolidation zone, but momentum is shifting bullish.
Watch for a follow-through move above $16.30–17.00 to confirm potential uptrend.
Ideal spot for early positioning, but confirmation is still needed.

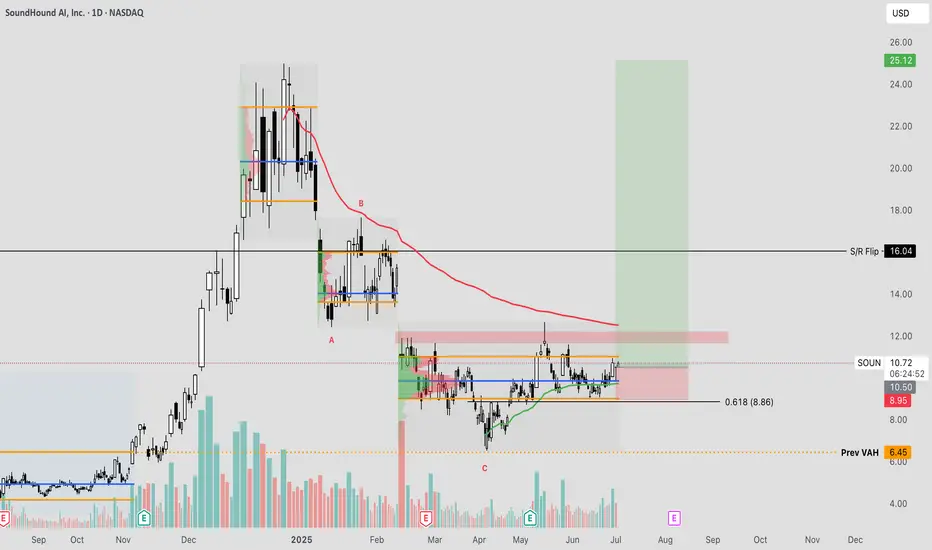
Soundhound Round 2 SoundHound Inc. is a voice AI and audio recognition company that specializes in technologies allowing humans to interact with devices through natural voice commands. Albiet not currently profitable, their business model does have some revolutionary potential for many service based industries as AI begins to take over our everyday life.
What im interested in here is the overall setup where we may be starting to see a rotation back to the highs after bouncing at some of my key levels based on the volume profile. These being the POC and VWAP from the low.
I think there is a decent chance we go to $16 perhaps, and then we can re-evaluate the market and if there is potential for us to hit new highs!
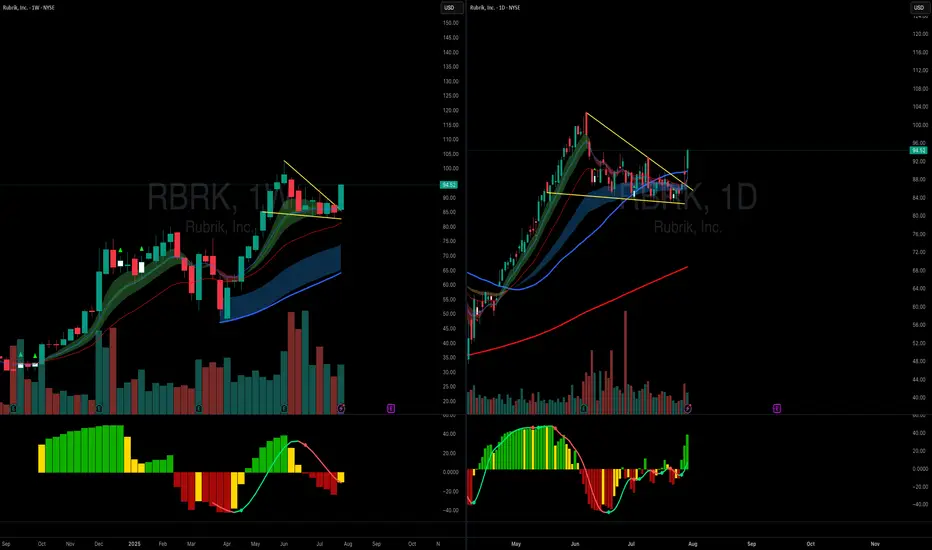
Rubrik, I am late, sorryNYSE:RBRK broke out of this pennant, and I was late to enter this position, positing this as a journal entry.
I half sized as the ideal entry was at 87 (91.5 for me)
but looks really good here with seeking alpha showing great growth metrics
targets: 100 (psych), 110

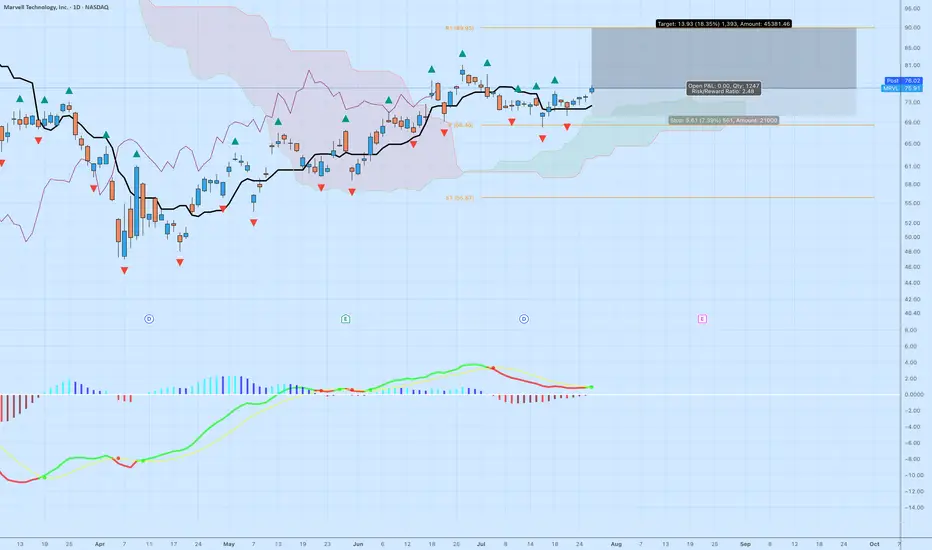
MRVL | Ichimoku Breakout Setup with Fractal and MACDMarvell Technology (MRVL) just printed a clean bullish breakout setup across multiple technical systems. Here's the breakdown:
Why This Setup Matters
Ichimoku Cloud: Price has decisively cleared the cloud with bullish Tenkan-Kijun alignment. The Senkou Span A is rising, and the cloud ahead is thin — suggesting low resistance and potential acceleration.
Fractal Support: Multiple upward fractals formed near the $73–$74 support zone, validating the base before the breakout. Price broke the most recent fractal high, triggering a potential continuation.
MACD Momentum: A bullish crossover just occurred, with the histogram flipping positive — a classic momentum confirmation following consolidation.
Trade Parameters
Entry: $76.02
Stop: $70.41 (below the recent flat Kijun and cloud base)
Target: $89.93 (R1 pivot zone and psychological resistance)
Risk:Reward Ratio: 2.48
Projected Move: +18.35%
Additional Confluence
The Kumo breakout occurred alongside a flat Kijun and a narrowing cloud — a textbook edge-to-trend signal.
Price structure has formed higher lows since June.
Potential for strong institutional interest heading into earnings.
Risk Notes
Watch for rejection around $78.50 (prior resistance zone).
The upcoming cloud twist is narrow — if the Tenkan turns flat, a short-term pullback could occur before continuation.
Let me know in the comments if you're watching MRVL or trading this breakout. I’ll post an update if we get confirmation above $78 with volume.
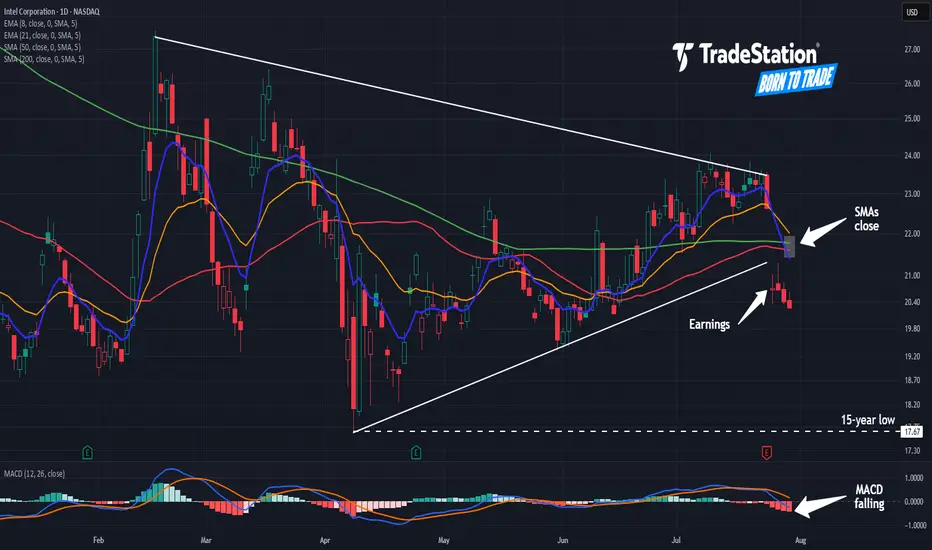
Intel: Still Not Cheap Enough?Intel has been falling for years, but some traders may think it’s still not cheap enough.
The first pattern on today’s chart is the series of higher lows since April, combined with lower highs since February. That converging range is a potential consolidation pattern.
Second, the chipmaker broke that range by gapping lower on Friday following a weak quarterly report.
Third, traders may eye $17.67 as the next important level. That April low was also the lowest price since August 2010.
Fourth, the 50-day simple moving average (SMA) inched toward the 200-day SMA this month but failed to cross above it. Is a longer-term bearish trend in effect?
Next, the 8-day exponential moving average (EMA) is below the 21-day EMA and MACD is falling. Both of those signals may be consistent with bearishness in the short term.
Finally, INTC is an active underlier in the options market. (Its average daily volume of about 350,000 contacts ranks 10th the S&P 500, according to TradeStation Data.) That could help traders take positions with calls and puts.
TradeStation has, for decades, advanced the trading industry, providing access to stocks, options and futures. If you're born to trade, we could be for you. See our Overview for more.
Past performance, whether actual or indicated by historical tests of strategies, is no guarantee of future performance or success. There is a possibility that you may sustain a loss equal to or greater than your entire investment regardless of which asset class you trade (equities, options or futures); therefore, you should not invest or risk money that you cannot afford to lose. Online trading is not suitable for all investors. View the document titled Characteristics and Risks of Standardized Options at www.TradeStation.com . Before trading any asset class, customers must read the relevant risk disclosure statements on www.TradeStation.com . System access and trade placement and execution may be delayed or fail due to market volatility and volume, quote delays, system and software errors, Internet traffic, outages and other factors.
Securities and futures trading is offered to self-directed customers by TradeStation Securities, Inc., a broker-dealer registered with the Securities and Exchange Commission and a futures commission merchant licensed with the Commodity Futures Trading Commission). TradeStation Securities is a member of the Financial Industry Regulatory Authority, the National Futures Association, and a number of exchanges.
Options trading is not suitable for all investors. Your TradeStation Securities’ account application to trade options will be considered and approved or disapproved based on all relevant factors, including your trading experience. See www.TradeStation.com . Visit www.TradeStation.com for full details on the costs and fees associated with options.
Margin trading involves risks, and it is important that you fully understand those risks before trading on margin. The Margin Disclosure Statement outlines many of those risks, including that you can lose more funds than you deposit in your margin account; your brokerage firm can force the sale of securities in your account; your brokerage firm can sell your securities without contacting you; and you are not entitled to an extension of time on a margin call. Review the Margin Disclosure Statement at www.TradeStation.com .
TradeStation Securities, Inc. and TradeStation Technologies, Inc. are each wholly owned subsidiaries of TradeStation Group, Inc., both operating, and providing products and services, under the TradeStation brand and trademark. When applying for, or purchasing, accounts, subscriptions, products and services, it is important that you know which company you will be dealing with. Visit www.TradeStation.com for further important information explaining what this means.
BMNR - Ascending triangle spotted with breakout?It's low time-frame and could break down but I spotted this and wanted to share.

AMD Short AMD has the potential to fall from the $200 level within the Fair Value Gap (FVG) zone, and based on the Cypher pattern, it is aiming to reach a lower FVG zone as the next target.

Hidden Bullish Divergence Bull is in a falling wedge patter while also making lower lows on the 1hr while making higher lows on the true strength index indicator. It is also bouncing off the 200ma, the bottom bollinger band, and the first reversal zone.

MSTR Holding VWAP Support – Reversal Attempt but Earnings AheadMSTR bounced nearly 2% today after testing anchored VWAP support near $390. This recovery comes after a steady pullback from the recent $460 high. Price is holding above the yellow VWAP and just above the green zone, signaling possible short-term support.
However, volume remains light (3.72M vs. 11.47M average), indicating cautious buying — and earnings are scheduled for tomorrow, which introduces added volatility risk. A close above $410 post-earnings would strengthen the bullish case.
Until then, this remains a speculative long setup with event risk.
Indicators used:
Anchored VWAP (support zone: $390–395)
Volume vs. Volume MA (light = indecision)
Earnings date = risk trigger
Entry idea: Only after earnings reaction; ideally above $410
Target: $430–440
Stop: Below $388 or earnings miss

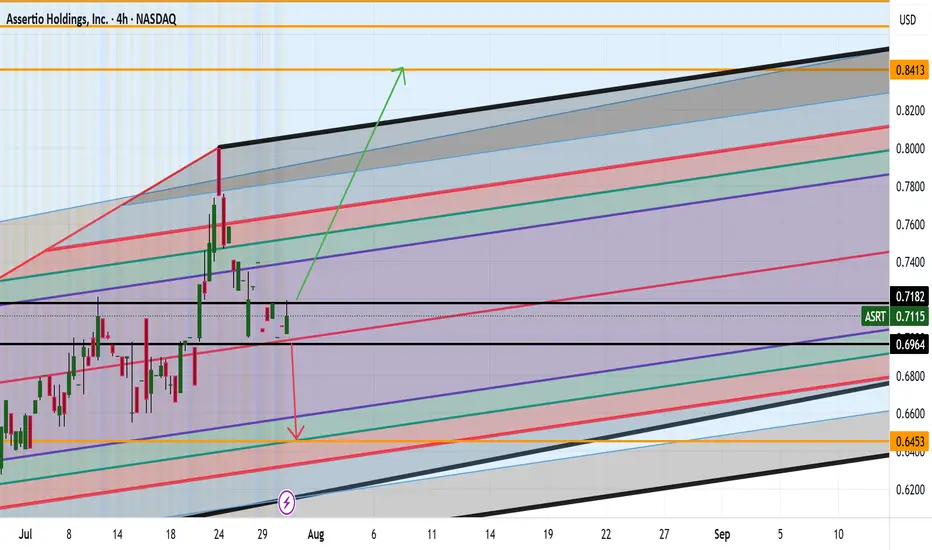
ASRT ARE WE HEADING TO .84CENTS AND HIGHER? Good afternoon Trading Family
So looking at ASRT we see two options here:
1) We break .71 cents high which then would give confirmation to a drive up to 84 cent range
2) We break below the .69 cent low which then would help us confirm a possible short down to .64 cents
Trade Smarter/ Live Better
Kris
SPOT Reversing at VWAP Support – Signs of Seller ExhaustionAfter a sharp drop, SPOT is showing early signs of reversal at a key anchored VWAP support zone. The intraday bounce occurred on low volume, which may indicate seller exhaustion rather than aggressive dip-buying.
Price is holding near the blue VWAP anchored from the April low, a level that previously acted as dynamic support. Although today’s bounce lacks volume strength (3.53M vs. 2.28M MA), the selling pressure appears to be cooling off.
If SPOT can reclaim $665–670 in the coming sessions with improving volume, a recovery toward $700+ is possible. However, failure to hold above $640 may resume downside momentum.
Indicators used:
Anchored VWAP (support holding from prior pivot)
Volume (low, signaling possible seller fatigue)
Price structure (early reversal after steep correction)
Entry idea: Watch for reclaim of $665
Target: $700–715
Stop: Below $638 or new low