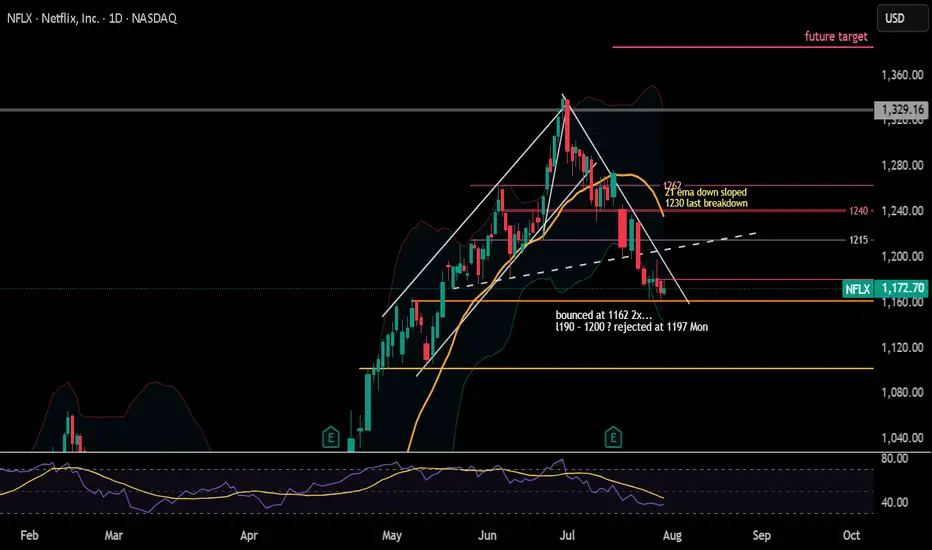
NFLX RANGEIs NFLX aiming the top of the range (1190-1197)? Currently not breaking down below 1162. It's the end of July and things may be getting hot! For the next play :)
Fed Powell speaking at 2/2:30p today. I think it's expected that his words may move the market. We may just range some more. I will assess how we close.
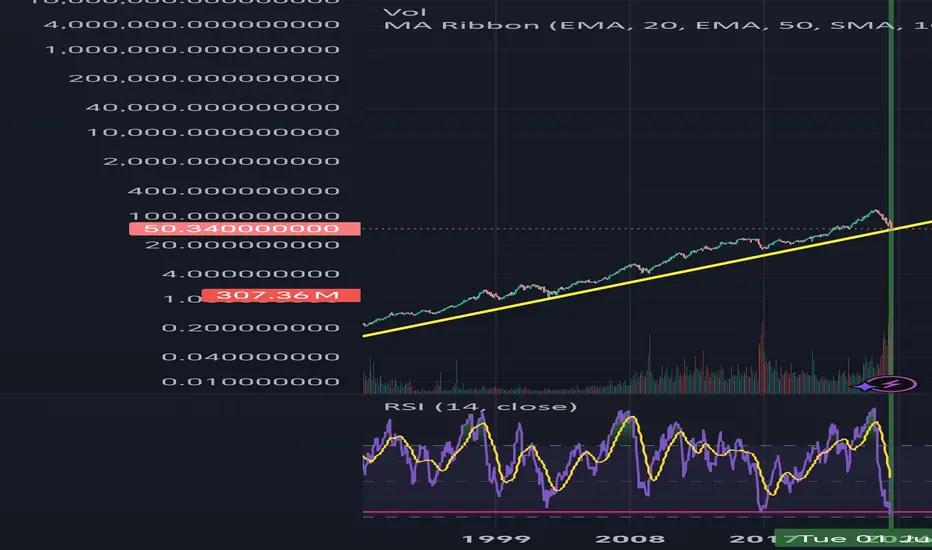
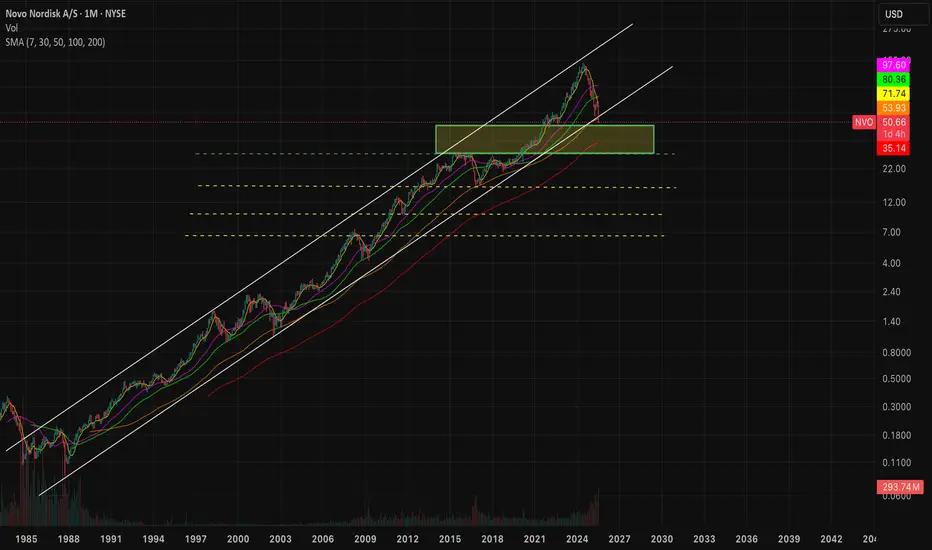
NVO going to zero? Just zoom out V.2While many are panic, just zoom out years and we can dee that it is at 30 years support trend line to the upside.
Weekly RSI printing bullishvergent, monthly at Oversold level.
Still fundamentally strong, If you love this stock, be excited.
(Last post chart didn't appear properly, I couldn't edit/delete)
NVTS Analysis Are we Heading to $9+ Good afternoon Trading Family
Based on what we currently see with NVTS are two scenarios happening:
1) Above 7.80 highs we will thus be heading to the 9-9.7 range
2) Below 7.30 lows then we will be heading to the 6 dollar range
Happy Trading
Trade Smarter/ Live Better
Kris

CRWV still crashing... breaking $100?whew.... will we break $100?
*failed 110
well i have a christmas fib outlined. i think i'll do a little investigating on this stock. popped due to its connection to NFLX. let's see what is going on before we buy the dip.

NVO going to zero? Just Zoom outWhile many are panicking, just zoom out for a few years, and we can see that it is at a 30-year support trend line to the upside.
Weekly RSI is printing a bullish divergence; monthly RSI is at an oversold level.
Still fundamentally strong. If you love this stock, be excited.

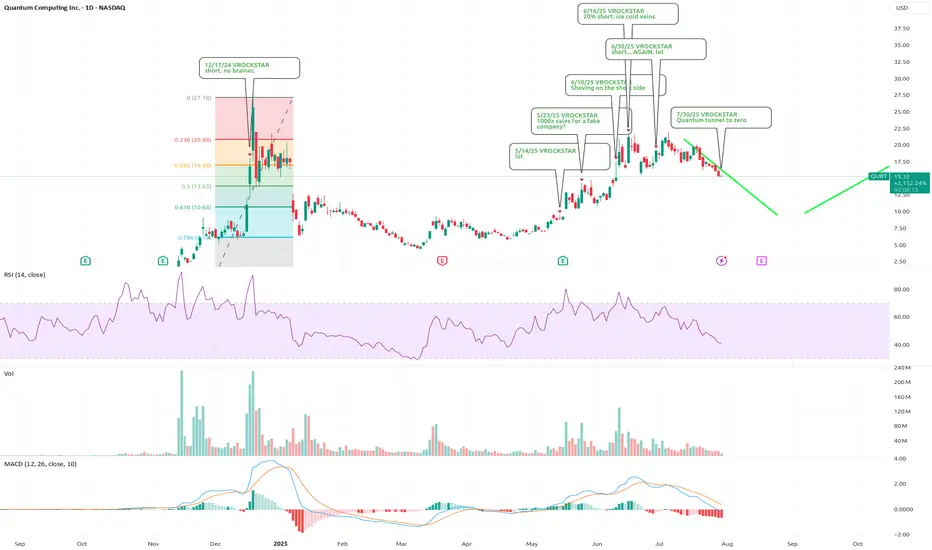
7/30/25 - $qubt - Quantum tunnel to zero7/30/25 :: VROCKSTAR :: NASDAQ:QUBT
Quantum tunnel to zero
- what's this price action called? i'm not the TA guy
- looking at that $10 to fill. i'm sure there will be call buyers standing ready to eat that juicy "generational opportunity" as the 0dte cowbois call it these days
- not short at the moment. looking for right oppty to reload
- but i remind you this doesn't generate any financials
- and mgmt are dumping shares
- their core product is in this order: stock price, name includes quantum, press releases/ presentations, hand waving, unpaid attention-seeking 0dte buyers on X
thank you for your attention to this matter, or lack thereof or maybe both. i'll leave that one for you to decide, or not or 0dtecall me maybe.
V
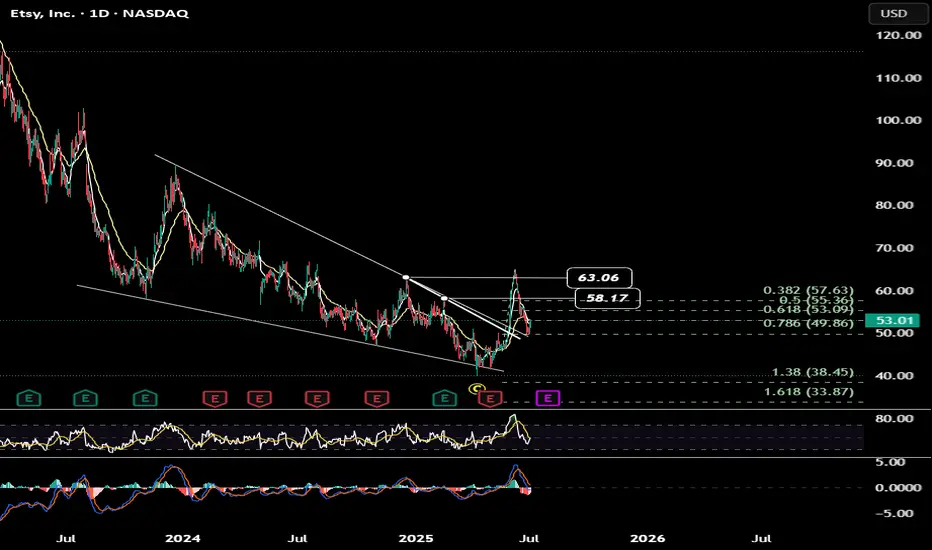
ETSY UPDATE ETSY is retesting ed trendline along with 78% fib . another chance or what !!!! same stop for me .
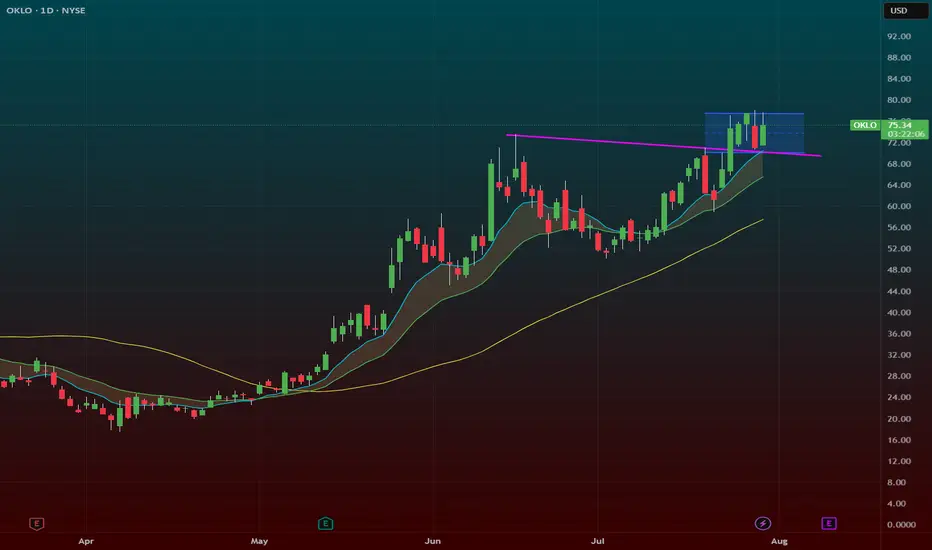
$OKLO – Back to the Moneymaker: HTF + C&H Combo at $77.50NYSE:OKLO – Back to the Moneymaker: HTF + C&H Combo at $77.50
Back to my bread and butter setup — NYSE:OKLO is setting up again, and it’s 🔥. We’ve got a high tight flag forming right above the 9 EMA, and to sweeten the deal, there’s a cup and handle structure layered in too.
🔹 The Setup:
After a strong breakout, NYSE:OKLO has spent the past week consolidating tightly above the 9 EMA.
Price action is coiled, volume has dried up — exactly what I want to see before a power move.
This is a high tight flag + cup and handle combo, one of my favorite high-probability setups.
🔹 Trigger Level:
Watching the $77.50 breakout zone — that’s the line in the sand. If you get a good intraday dip to support you can pre-empt the play i like to often scale in a half in anticipation if the market is in a runup phase
A clean push through with volume, and this can speed up fast.
🔹 My Trade Plan:
1️⃣ Entry: Either starter near 9 EMA support or confirmation on breakout over $77.50.
2️⃣ Stop: Under the 9 EMA — no reason to stay if it breaks down.
3️⃣ Target: Measured move extension if it clears $77.50 with juice.
Why I Love This Setup:
HTF + C&H = momentum fuel
This name has already proven itself — we’ve made money here before
The structure, the consolidation, and the setup are all textbook
7/30/25 - $fico - Probs a buy7/30/25 :: VROCKSTAR :: NYSE:FICO
Probs a buy
- not really my cup of cottage cheese
- but these growth/ mgns and strong fcf generation (2.5% fwd) speak for themselves
- look at $LC... people are handing out debt to whichever person wants to finance their NYSE:CMG burrito with installments
- hard to imagine in a consumer-gone-wild environment this thing doesn't do well on these results
V

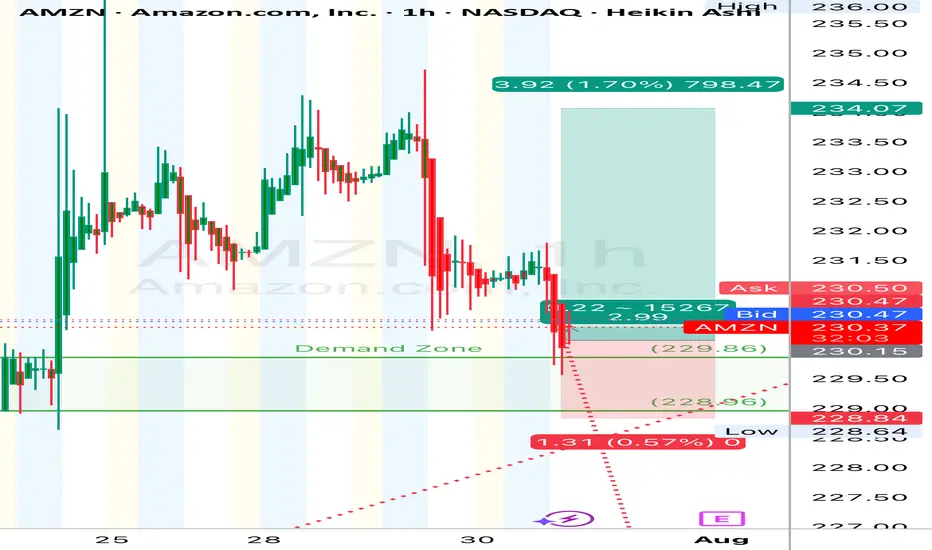
(AMZN) | 1H Chart Long
“Buyers defended the zone hard. Tight bull flag breakout setup forming after the demand tap. Looks like this thing wants to take another leg up. Clean R/R if managed tight.”
Price surged impulsively from mid-July lows, followed by a shallow correction—suggestive of a micro **Wave 4**.
* Current bounce off demand zone implies the potential start of **Wave (5)** to retest or break highs.
* **Demand Zone:** \$228.00–\$230.00 —
* **Supply Zone:** \$236.00 —234
🎯 **Trade Setup (Long Bias):**
* **Entry:** \$230.20 (current level near demand bounce)
* **Stop Loss:** \$228.80 (below the demand zone)
* **Take Profit :** \$236.00
* **Risk/Reward:** \~**1:3 RR**
*“The goal of a successful trader is to make the best trades. Money is secondary.” – Alexander Elder*
#### ⚠️ **Disclaimer:**
This is for educational purposes only and not financial advice. Trade at your own risk. Always manage your capital responsibly and use proper risk management.
CVX & XOM: The Bull case for OilI review the the Daily and Weekly charts on CVX & XOM, showing tradable patterns that they have formed since 2022. These are longer term trading patterns but are still active and fun to watch.

$NVO Accumulating long term compounder! - Previously, I have shorted NYSE:NVO when it was in $75-85 when moat was weakening and then went long around $58 to $75 for 40% on the long side. Everything is documented in my two posts.
- People are asking me if NYSE:NVO is cheap or not. After cutting guidance, I believe most of the estimates for EPS about NYSE:NVO are way off which would be revised downwards.
- At the same time, I believe NYSE:NVO has kitchen sinked their guidance because of new CEO transition which is very common in the publicly traded company.
- NYSE:NVO might not be cheap after cutting guidance honestly but not overvalued either.
- NYSE:NVO could be a dead money for some time 6 months, 1 year or 2 years who knows?
- But I know that weight loss industry in general is growing overall at least till 2030 and beyond.
- Some concerns I have is NYSE:NVO leadership is getting challenged by NYSE:LLY so it could be possible that NYSE:NVO might get lesser piece of the pie. However, overall piece is growing along with it so NYSE:NVO should continue to grow but at a lower rate than earlier.
- Net free cash flow should grow and company might return on investment to shareholders via share buybacks?
- Finally, I am buying NYSE:NVO in increments and have bought first lot of shares in $50.xx and will continue to add more if it drops more. I think NYSE:NVO can test 200 monthly moving average @ $35.
- I have marked the accumulation box in the chart for your reference.
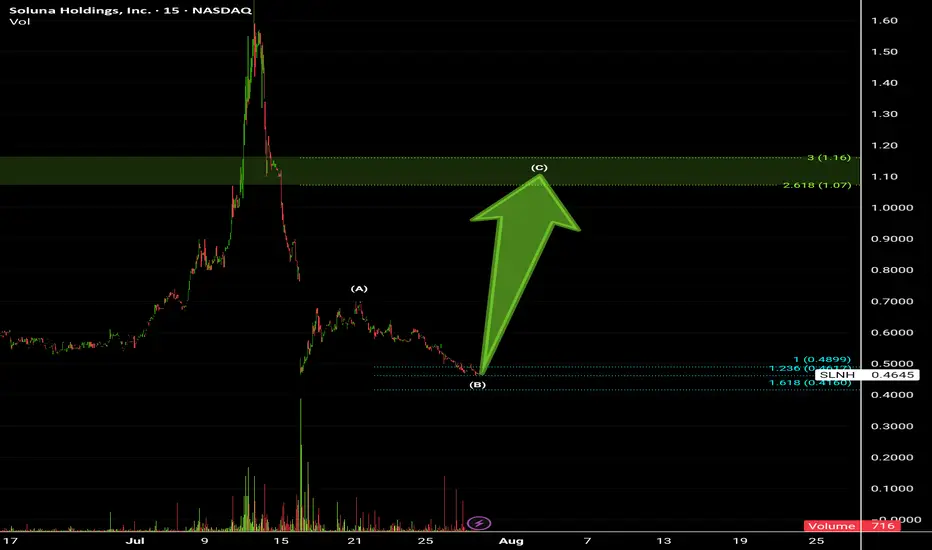
Soluna Holdings Inc.Stock on triggering level, Target prices between 261.8% - 300%
Highly recommended for Buying now 👌
Above 1$ will be the Target price.
Buy it now as much as you can before ignition starting UP 🔥🔥🔥💥💣🚀
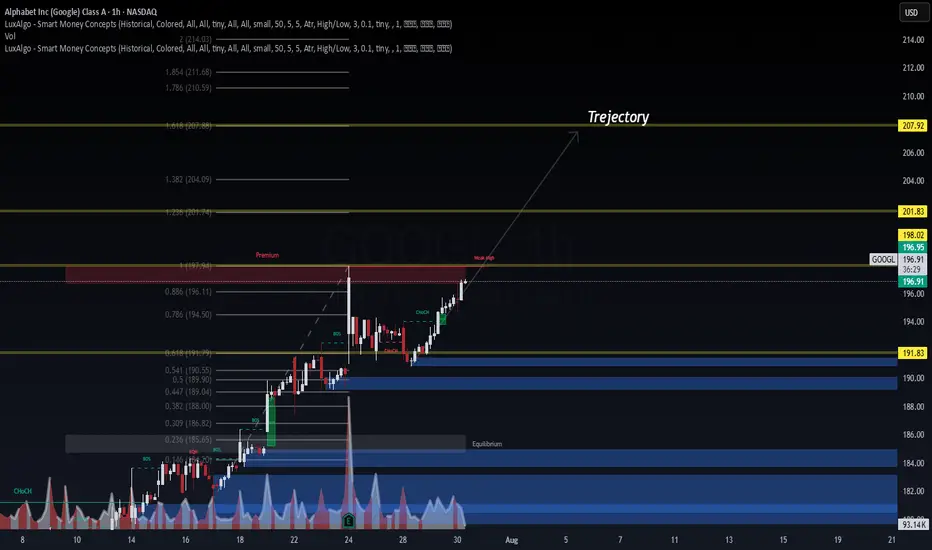
GOOGL Forecast – Dual AI Model Confirmation📊 GOOGL Forecast – Dual AI Model Confirmation
🔹 Posted by WaverVanir | VolanX Protocol
NASDAQ:GOOGL is showing strong bullish structure backed by both Smart Money Concepts (SMC) and AI model consensus.
🧠 VolanX AI Protocol Forecast (30-Day)
🎯 Target: $223.08 (+13.3%)
📈 Accuracy: 98.2%
📉 Drawdown: 0.00% (Backtested)
🧮 Sharpe Ratio: 7.70
🔵 Rating: Strong Buy
📉 WaverVanir DSS Model (Sentiment Score: 83)
🔸 30-Day Target: $198.47
🔸 Micro pullback expected before resuming uptrend
🔸 Ideal for refining short-term entries
🔍 SMC Structure:
BOS + CHoCH Confirmed
Premium zone at $197.94 cleared
1.236 Fib target: $201.83
1.618 Fib confluence: $207.92
Trajectory path = $223.08 if liquidity extends
📌 Strategy:
Entry: ~$196.95
TP1: $200.89
TP2: $223.08
SL: $188.80
R:R ~ 3.2:1
📢 Signal powered by WaverVanir DSS + VolanX Protocol
This is institutional-grade AI meets market structure.
#GOOGL #VolanX #WaverVanir #AITrading #SmartMoneyConcepts #SMC #Fibonacci #SwingTrade #Forecast #TradingView #StockSignals #InstitutionalAlpha #DecisionSupport #MachineLearning #DSS
Li Auto (LI) – Gaining Speed as China’s EV PowerhouseCompany Snapshot:
Li Auto NASDAQ:LI is scaling rapidly in the Chinese EV market, combining expanding distribution, premium product strategy, and smart technology integration to capture high-value demand.
Key Catalysts:
Aggressive Expansion 🏙️
Now in 140+ cities, with strategic moves into lower-tier regions, Li Auto is boosting brand visibility and tapping into untapped demographics.
Premium Product Pipeline 🚙
New models like the MEGA MPV and upgraded L-Series SUVs are driving strong demand, lifting margins above 22%—a signal of its move upmarket.
Smart Tech Differentiation 🤖
Proprietary AI cockpits, voice command systems, and ADAS platforms elevate the customer experience, creating a clear competitive edge.
Execution at Scale 📈
With YTD deliveries surpassing 180,000, Li Auto is proving it can deliver both volume and quality—earning analyst upgrades and institutional backing.
Investment Outlook:
Bullish Entry Zone: Above $26.00–$27.00
Upside Target: $46.00–$47.00, fueled by premium positioning, tech innovation, and delivery momentum.
🔋 Li Auto is not just riding the EV wave—it’s leading it in China’s premium smart vehicle segment.
#LiAuto #EV #ChinaAutos #SmartCars #ADAS #AI #ElectricVehicles #TechStocks #PremiumEV #Mobility #InstitutionalInterest #GrowthStocks #LI

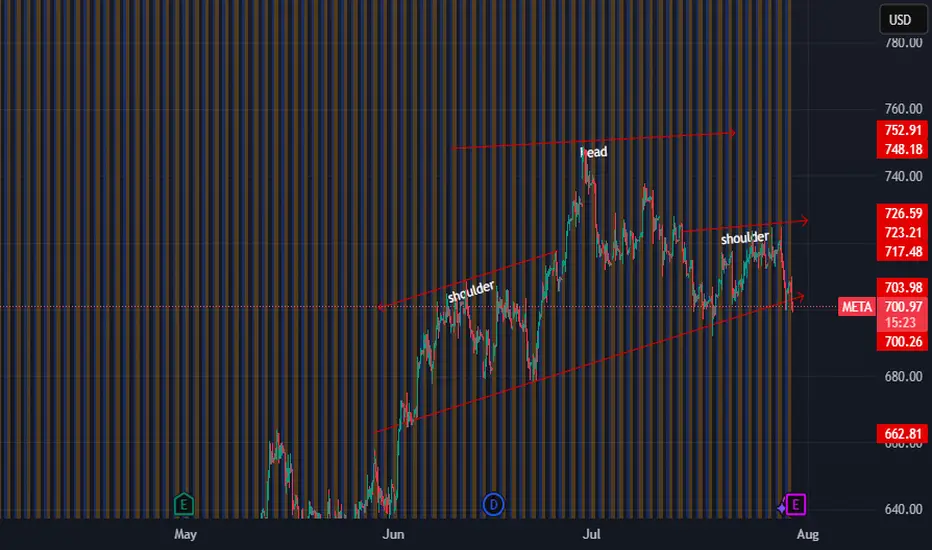
Head and shoulders showing a head and shoulders pattern on the hourly, I am looking for a 680-profit target and a 710 - 715 stop loss with a 700 - 705 entry
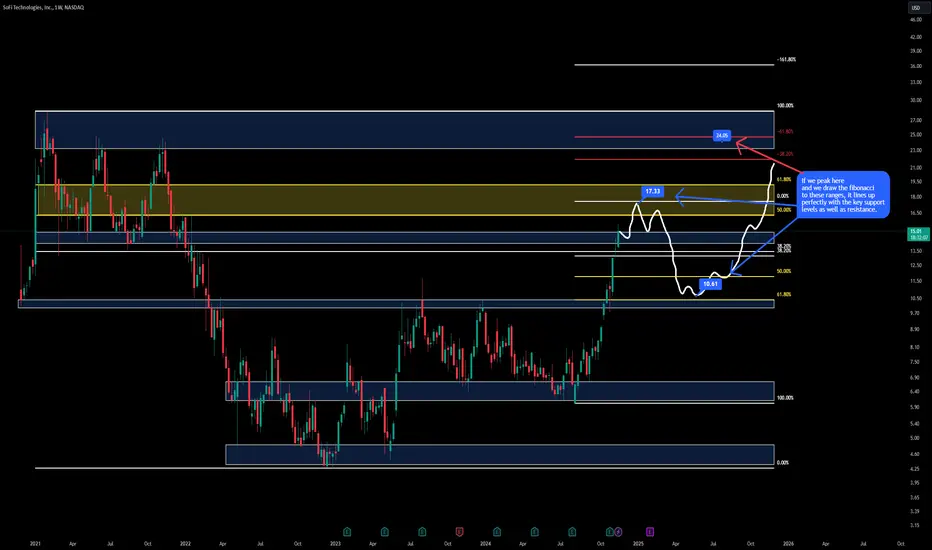
My thoughts for the coming weeksWe are at a tough patch now unfortunately looking at the charts, and so I think it's safe to assume we will see some selling and slowing down in upward price action, until we find more momentum to carry us into price discovery.
As you can see, we're heading towards some very important areas. One being an old support level, now resistance. Following that we have the Fibonacci golden zone at an arms reach as well. If we manage to blow past those, we then have the big one which completely ruined us for years.
Conclusion:
As you can see from my comments on the chart, I can see us in the coming weeks cooling off, and eventually selling down towards the $10 range, to then eventually gain momentum and try again.
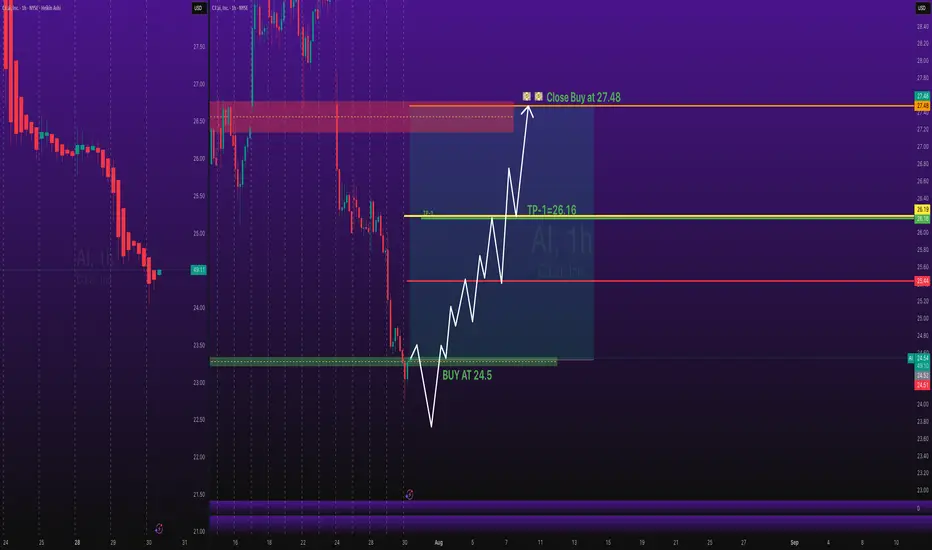
Stocks SPOT ACCOUNT: AI stocks BUT ENTRY with TAKE PROFITStocks SPOT ACCOUNT: NYSE:AI $c3.AI
stocks my buy trade with take profit.
This is my SPOT Accounts for Stocks Portfolio.
Trade shows my Buying and Take Profit Level.
Spot account doesn't need SL because its stocks buying account.
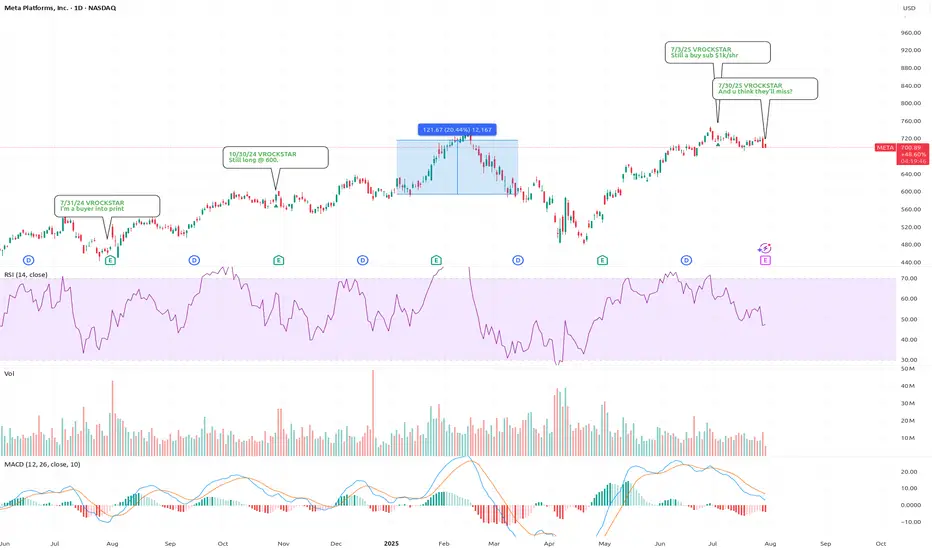
7/30/25 - $meta - And u think they'll miss?7/30/25 :: VROCKSTAR :: NASDAQ:META
And u think they'll miss?
- we continue to collect data pts that the consumer is spending like a drunken sailor and somehow the market still wants to bid the trash meme stocks that will burn cash until kingdom come
- amazon prime day
- dubious/ but still... government data
- yesterday... visa... booking
- we've seen the "oh look at NYSE:DECK , we thought people stopped buying shoes" reaction
- the reality is... the wealth effect has had a bit of a boomerang in my estimation from mar/apl stonk lows to new highs and "all normal" (big quotes)
- so as the king funnel to driving all this conversion, great tools... i don't think zuck's capex and hiring spending is really going to drive the big picture here on results. a strong ads result pays for all this spending... in what, a quarter?
- so no i don't have a crystal ball. but i'm surprised a lot of HQ names that are consumer-adjacent (esp such a dominant portal to the universe-META) aren't ripping into results and it's a harder call.
- this one is a buy into results
- it's a dip buy on a miss
- and it's a buy, probably, even if the stock rips
$1000 by year end is my best guess
V
Quick draw upI did quick and simple T/A and in my opinion seems to be the likely outcome. EMA lines are about to cross, it has made a lower low, which has now flipped the Fibonacci and likely to get rejected at the 61.80% - 50% range. The path lines aren't placed specific to the timeframes so ignore that it stretches way into 2025.

VKTX looking good at current levelsSummary of the Chart – Viking Therapeutics, Inc. (VKTX), 1W Chart (NASDAQ):
Current Price: ~$33.99
Support Levels:
Major Support: ~$23.93
Intermediate Support: ~$33.81
Resistance Levels:
Near-Term Resistance: ~$34.66
Major Resistance / Target Zone: ~$60.98 to ~$61.15
Technical Pattern:
The chart suggests a bullish reversal setup forming after a prolonged downtrend.
The red arrow indicates a projected breakout above $34.66, targeting the resistance zone around $61.00+.
Volume & Indicators:
Volume is marked at 8.85M, with support/resistance suggesting bullish momentum buildup.
Interpretation:
If price breaks above $34.66, a potential upside target of $60.98–$61.15 is projected.
Failure to hold $33.81 support may push the stock back toward $23.93.
