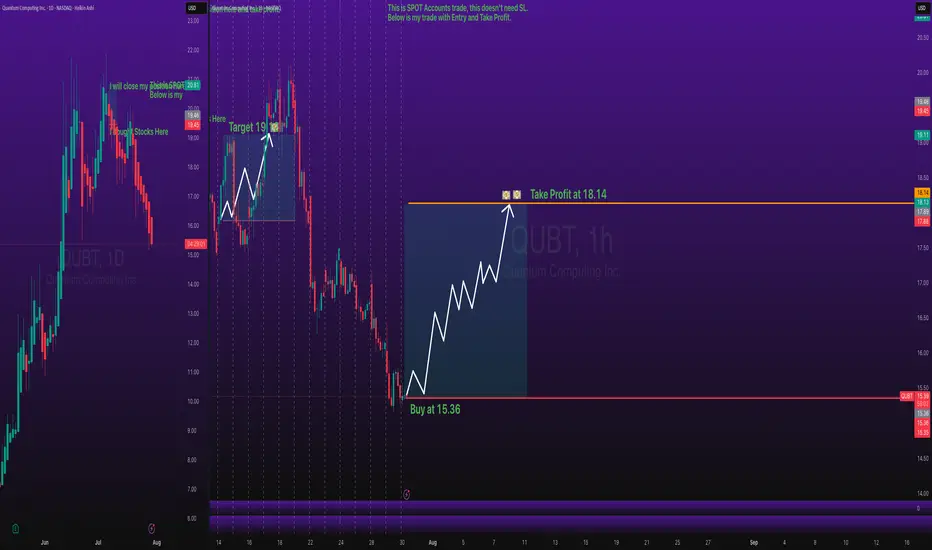
QUBT Stocks BUY Entry with Take Profit Level - Key ZonesStocks SPOT ACCOUNT: NASDAQ:QUBT stocks my buy trade with take profit.
This is my SPOT Accounts for Stocks Portfolio.
Trade shows my Buying and Take Profit Level.
Spot account doesn't need SL because its stocks buying account.
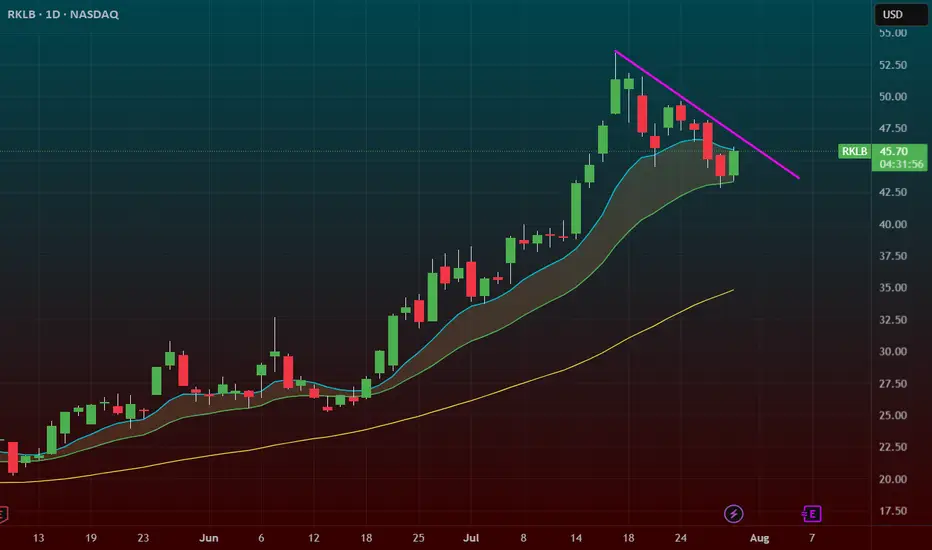
$RKLB – Momentum Pullback to 20 SMA with Trendline Break IncominRocket Lab ( NASDAQ:RKLB ) is setting up for a classic trend continuation move after a strong run. It just pulled back to the 20 SMA for the first time since breaking out over $35 — and it’s holding like a champ.
🔹 The Setup:
After peaking near $55, price pulled back in an orderly fashion on lower volume — a healthy correction.
Now we’ve got a hold at the 20 SMA, with a close back over the 9 EMA and a trendline break in progress.
This is where momentum tends to re-ignite.
🔹 Why It’s Powerful:
First 20 SMA test since the breakout = high probability bounce zone.
Lower volume on the pullback signals no panic selling.
A close over the 9 EMA + trendline = potential speed-up candle.
🔹 My Trade Plan:
1️⃣ Entry: Looking for confirmation over the 9 EMA and trendline.
2️⃣ Stop: Under the 20 SMA — tight structure, defined risk.
3️⃣ Target: Retest of highs near $55 with potential extension on breakout.
Why I Love This Chart:
NASDAQ:RKLB is a momentum name — when it moves, it moves fast.
The trend is intact, the pullback was clean, and now we have structure + volume setup.
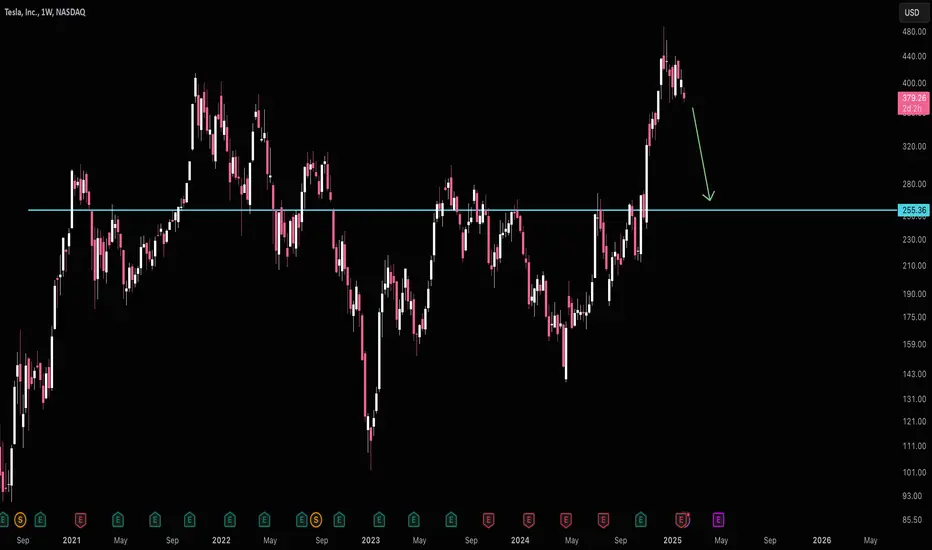
Tesla High Risk of $255Tesla is Stuck under $430 ATH resistance and at high risk of falling back to $255 support.
Tesla is no longer growing and Musk is polarizing and alienating their mostly progressive leaning customer base. This stock simply makes zero sense for a 200 pe ratio.
NIKE Confirms A Bullish Reversal With An Impulsive RecoveryWe talked about Nike on July 10 with our members, where we mentioned and highlighted a completed higher degree ABC correction in wave IV on the monthly and weekly charts.
Today we want to represent a closer view, as we see a five-wave impulsive recovery away from the lows on a daily chart. It actually confirms the bottom and bullish reversal, but since it can be trading in 5th wave that can stop around 80-85 area, we should be aware of a three-wave corrective setback soon. It can slow down the price back to the open GAP, so ideal buy zone is in the 70-60 area. Invalidation level is at 52.
Highlights:
Direction: Up, but watch out for a correction
Structure: Impulse, Wave 5 in final stages
Support: 70 / 60

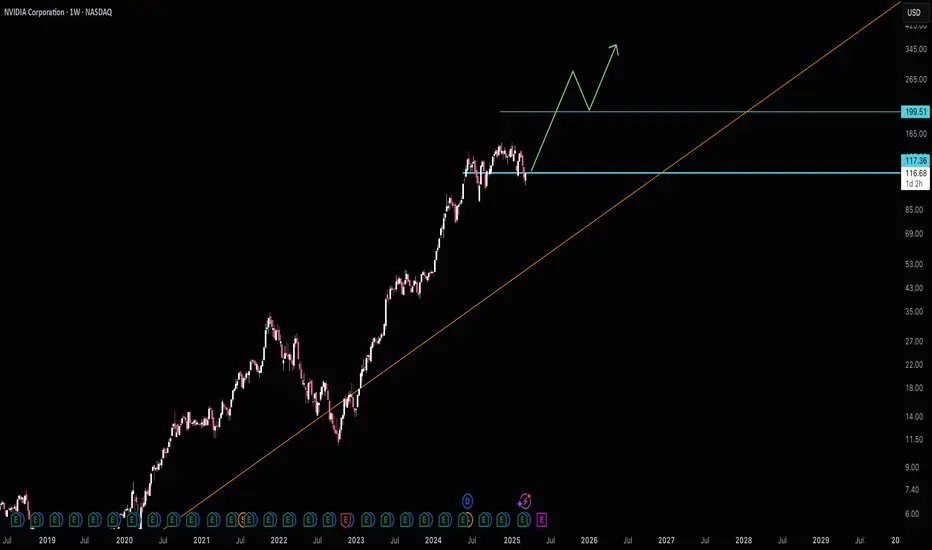
Nvidia Just Under Major SupportNvidia seems to have been pulled down by the Dow just like Apple as both are just under major support. I'm sorry for my previous Nvidia chart that drew support near 140, I recognize where I screwed up, but this chart should be good. Fortunately actual 117 support wasn't that far below and my NVDA isn't too in the red.
NVDA has the lowest revenue multiple in years right now. I know it's well off it's long term trend line, but it's growth rate is unlike anything it's ever been so expecting a steeper trend line to appear makes a lot of sense. Eventually I would imagine we'll get back to that trend line, but not anytime soon.
The Dow hitting major support should finally lift NVDA and the others that have been dragged down like AAPL and AMZN.
Good luck!
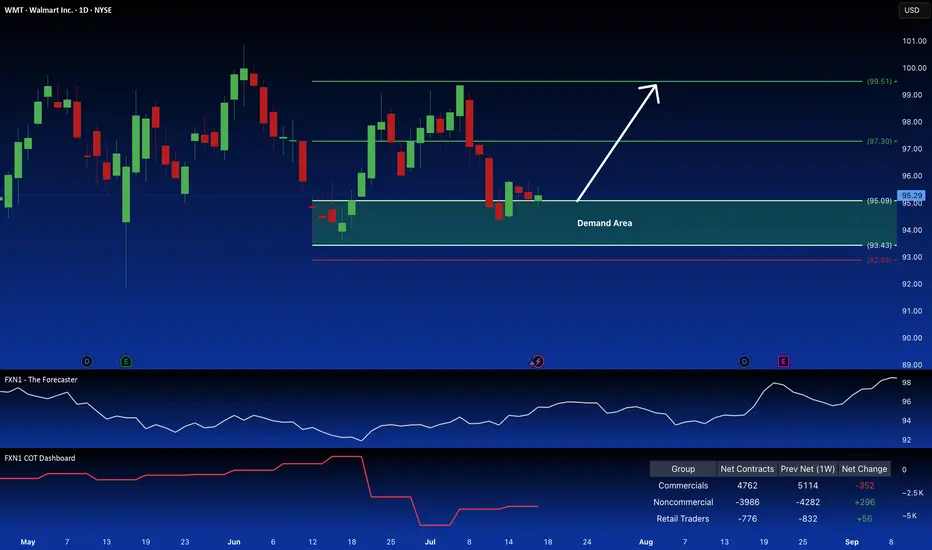
Walmart: Long Position Attractive on Demand ZoneWalmart Inc. presents a compelling long opportunity. The price action is reclaiming a key demand zone, suggesting a continuation of the current uptrend, a pattern reinforced by seasonal factors. Further bolstering the bullish case is the observed increase in large speculator positions.
✅ Please share your thoughts about WMT in the comments section below and HIT LIKE if you appreciate my analysis. Don't forget to FOLLOW ME; you will help us a lot with this small contribution.
Mean Reversion Trade: UPS1. RSI in oversold region
2. Price likely to rebound back the the mean
Trade Rules:
Entry Trigger - RSI has cross below oversold region, enter limit buy at close price
Exit Trigger - Close at market when close price cross above exit trigger (Red step line)

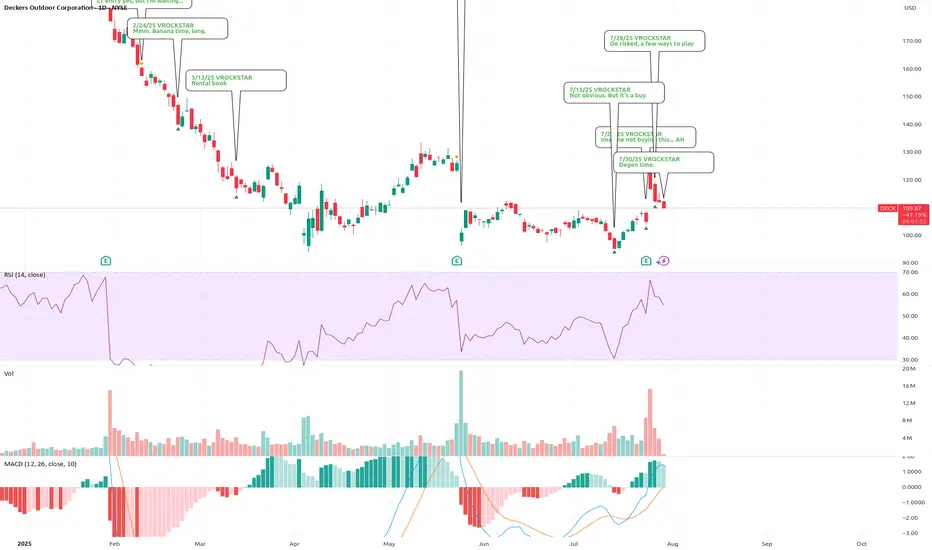
7/30/25 - $deck - Degen time.7/30/25 :: VROCKSTAR :: NYSE:DECK
Degen time.
- look at the last NYSE:ANF report... and tell me you're not noticing the exact same pattern. massive rip. massive gap fill retrace.
- do we re-test pre-report levels mid to low $100s?
- that's what keeps me buying ITM leaps here, but going quite large
- i'm trying to figure out w/ $V report, consumer spending... all consistent w my views, why this doesn't become just the most obvious winner into 2H and '26
- so i'm buying myself some time w/ these expires and ITM
- but it's degen time.
V
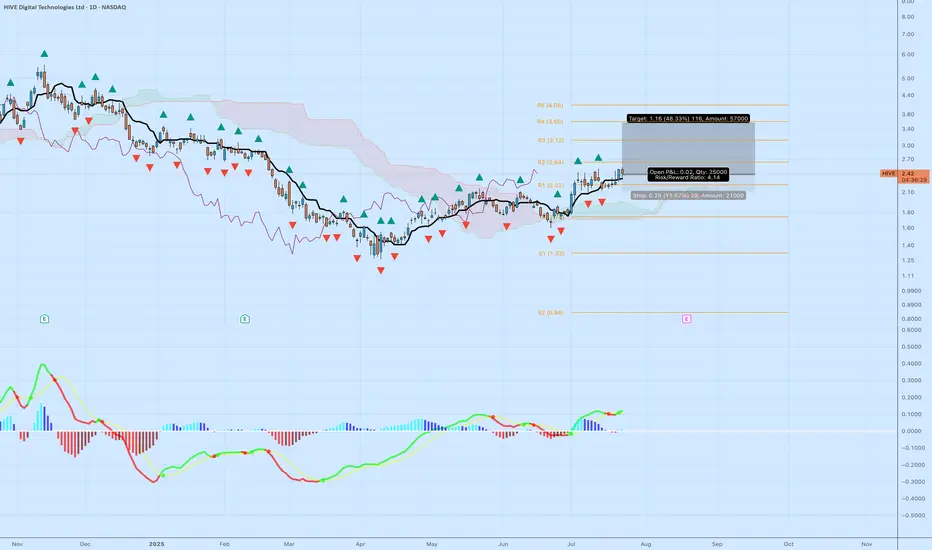
HIVE – Bullish Breakout Above Cloud with MACD and Fractal HIVE Digital Technologies ( NASDAQ:HIVE ) is showing a textbook trend reversal after months of basing. Price action has cleared the Ichimoku cloud with conviction, printing a bullish MACD signal and confirming structure with repeated fractal support.
Setup Breakdown:
Price above cloud and holding above R1 pivot (2.22)
Bullish MACD crossover with rising histogram and momentum curve
Multiple bullish fractals printed from the consolidation base
Entry off the breakout with clean support structure below
Target near R3 at 3.12 offers 48%+ upside with defined risk
Trade Details:
• Entry: $2.42
• Stop: $2.14
• Target: $3.58
• Risk/Reward: 4.14
• Quantity: 25,000 shares
This breakout lines up with broader crypto strength and interest in blockchain infrastructure. HIVE is well-positioned as a data center and digital asset play with rising institutional attention.
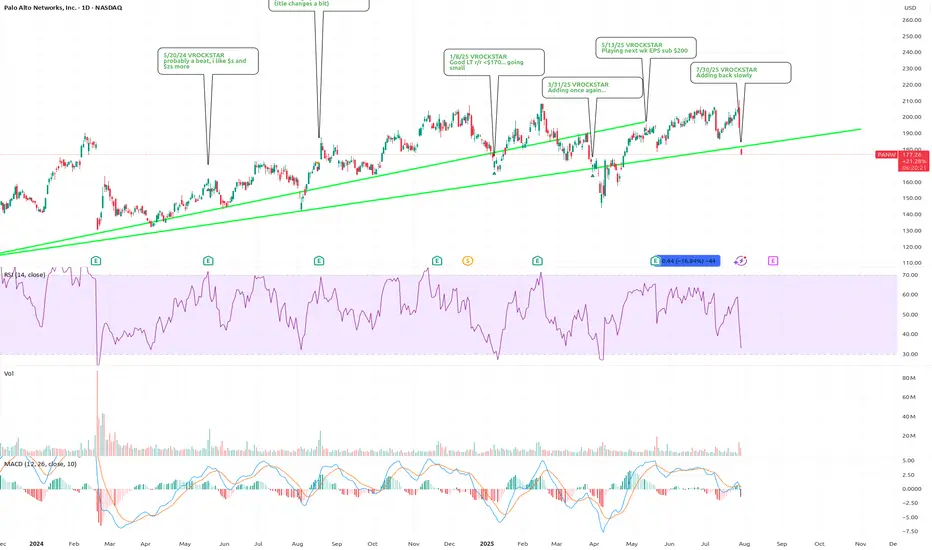
7/30/25 - $panw - Adding back slowly7/30/25 :: VROCKSTAR :: NASDAQ:PANW
Adding back slowly
- leader is extending it's lead w/ NASDAQ:CYBR
- NASDAQ:CYBR was a top 3 name for me in the sector
- so yeah, i'm buying ITM leaps here, slowly
- welcome back to the long book NASDAQ:PANW
V
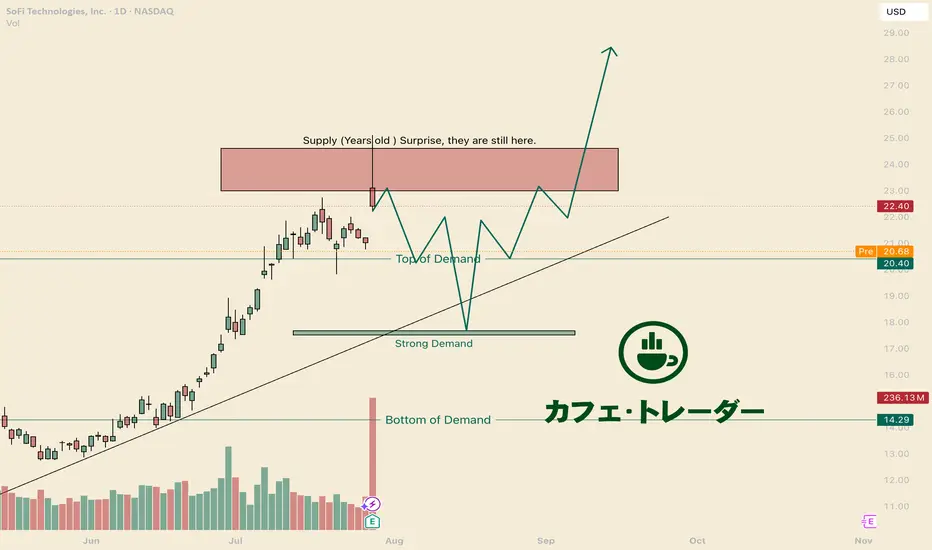
Scared? Become a BuyerHello I am the Cafe Trader.
With heightened interest in SOFI, I am seeing many worried posts, and skepticism. Before taking profits early, consider these levels fist.
Years Old Supply.
This Supply zone (marked in the red box) has been sitting here for years. It is no suprise that we get a dynamic reaction at this level.
Welcome to the Range
Now that you know there is a seller sitting there, If this doesn't jump back up and close above 24.71 by friday, expect to be sitting in a range for months.
Bulls are in Control
Even with that massive reacion, All previous bulls are still in tact and ready to accumulate more. Top of demand will fae the most pressure, but there are alot of buyers at that strong demand level. Be patient, and you can get great pricing.
Long Term
For those looking to get into SOFI, I have some prices that should line up with your personal sentiment.
FOMO Aggressive = $21.67 ( i dont recommend)
Aggressive = 20.40
Good price = 17.50 - 17.75
STEAL - 7.50-9.50
That's all for SOFI. Comment below if you want to see any other analysis!
Happy Trading
@thecafetrader
Boeing Company (BA) Long Setup Boeing Company (BA) Long Setup
Probable **Wave (5)** upside impulse from the recent \$225.26 low.
* Wave (4) looks complete — bullish structure shift starting from LL.
* Price is now breaking minor resistance, building momentum for continuation.
* **Demand Zone:** \$224.00–\$226.00 — proven bounce area, high-volume rejection
* **Supply Zone:** \$242.70–\$243.00 — last bearish engulfing + strong wick rejection
* RSI still recovering from **bullish divergence** on LL.
* **Entry:** \$227.75 (current consolidation near breakout)
* **Stop Loss:** \$224.00 (beneath recent low and demand)
* **Take Profit :** \$243.00 (supply zone)
* **Risk/Reward:** \~**3.0 R**
“In trading, the moment you think you’ve figured it out, the market humbles you.” – Mark Douglas*
#### ⚠️ **Disclaimer:**
This chart analysis is for educational purposes only and not financial advice. Always do your own research, manage risk, and trade responsibly.
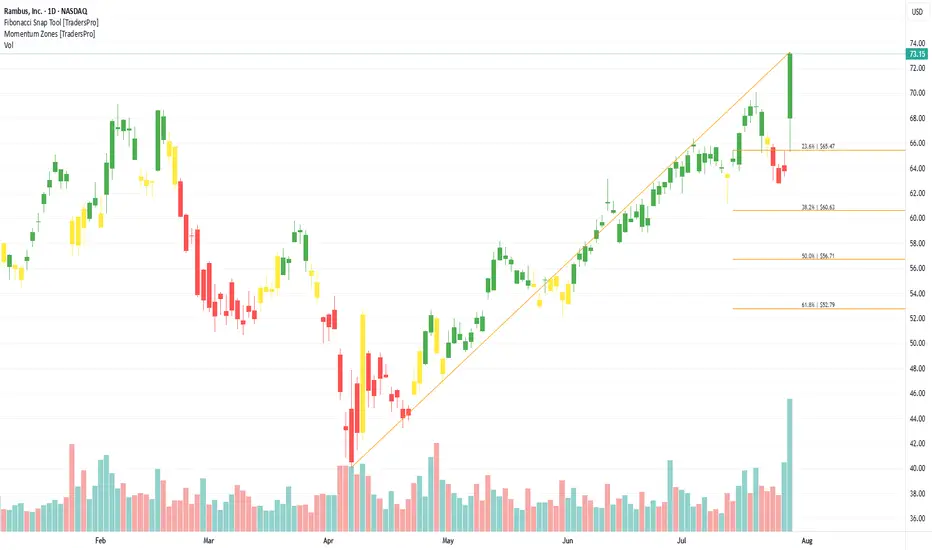
Rambus, Inc. (RMBS) Expands AI and Cloud SolutionsRambus, Inc. (RMBS) is a leading semiconductor and technology solutions company focused on high-speed memory interfaces, security IP, and advanced chips that power data centers, AI, and cloud computing. Known for innovation in high-performance computing, Rambus helps meet the growing demand for faster data processing and secure data transfer. The company’s growth is fueled by rising AI adoption, next-gen server technology, and the increasing need for data security worldwide.
On the chart, a confirmation bar with climbing volume signals strong buyer interest. The price has entered the momentum zone after moving above the .236 Fibonacci level. A trailing stop can be set just below this Fibonacci level using the Fibonacci snap tool to lock in gains while allowing more room for upward movement.
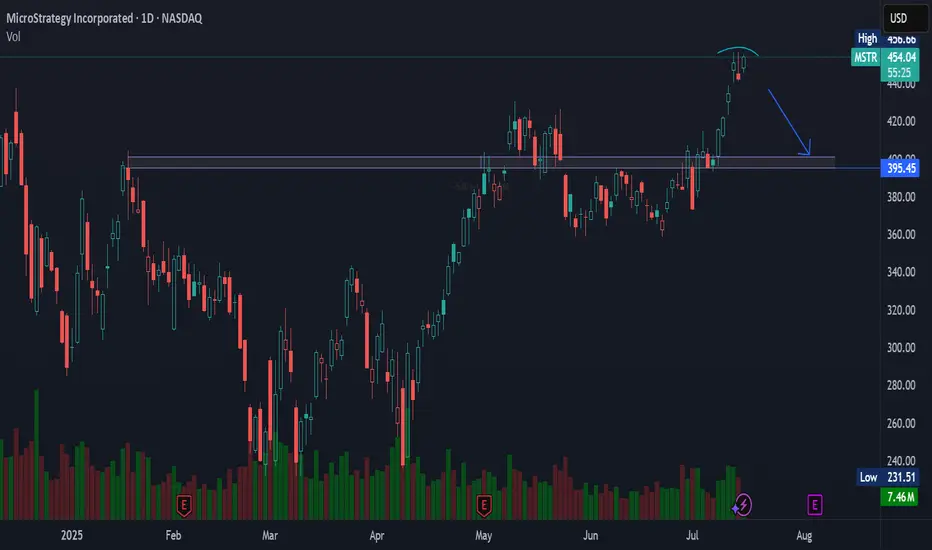
MSTR NASDAQ:MSTR looks like it’s gearing up for a pullback — eyes on the $395 level for a potential retest.
Watch the support. 👀📉
#MSTR #Bitcoin #Stocks #Tech #Trading
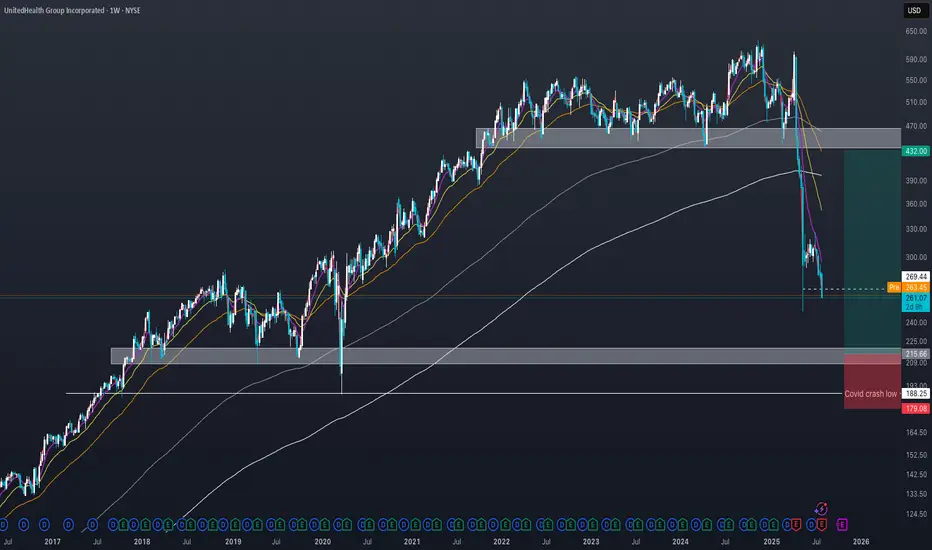
UNH in trouble? Key support at $250 before deeper dropDear traders and followers,
the UnitedHealth group chart has been in a clear downtrend since mid-April, with a potential bottom forming around $250. If this level breaks, the next strong support lies in the $200–220 zone. This is my preferred entry zone
A stop-loss below the COVID crash low is advisable to manage risk. The stop-loss should be mental and only triggered if a weekly candle closes below the low.
Fundamentally the stock faces uncertainty due to ongoing lawsuits and potential policy changes under a Trump administration.
While UNH remains a strong long-term investment, the road back to the $400 level will likely be slow and challenging, requiring patience and resilience from investors.
MSFT & META Daily Trade SetupsIn this update we review the recent price action in Microsoft & Meta and identify the next high-probability trading opportunities and price objectives to target. To review today's video analysis clcik here!

BA: Boeing down on better than expected results! 30-07-2025Yesterday we get Boeing earnings report which came better than expected, but the stock down more than 4% as the company is not expected to make positive profit or free cashflow before 2026. No dividends currently paid, so there is nothing attractive to me now.
Disclaimer: This content is NOT a financial advise, it is for educational purpose only.

UnitedHealth (UNH) Shares Plunge Following Earnings ReportUnitedHealth (UNH) Shares Plunge Following Earnings Report
Yesterday, prior to the opening of the main trading session, UnitedHealth released its quarterly results along with forward guidance. As a result, UNH shares dropped by over 7%, signalling deep disappointment among market participants. According to media reports:
→ Earnings per share came in at $4.08, missing analysts’ expectations of $4.48.
→ Revenue guidance was set at $445.5–448 billion, falling short of the anticipated $449.07 billion.
→ Concerns were further fuelled by rising costs and declining profitability, which the company attributed to the continued impact of Medicare funding cuts.
Consequently, the UNH share price dropped to its lowest level of 2025, last seen on 15 May.
Technical Analysis of UNH Stock Chart
In our end-of-May analysis, we updated the descending channel on the UNH stock chart and highlighted that following the recovery from the May low (marked by arrow 1), sellers could regain control. Since then:
→ Throughout June, the share price exhibited signs of supply-demand equilibrium around the psychological $300 level.
→ However, after an unsuccessful rally that formed peak A (which now resembles a bull trap), the balance shifted in favour of the bears. The price began to slide lower along the median line of the descending channel (illustrated by arrow 2).
This pattern was a red flag, particularly against the backdrop of a broadly rising equity market since the beginning of summer. Even if the bulls had hope, yesterday's candle could have completely extinguished it:
→ The session opened with a wide bearish gap.
→ During the day, bulls attempted a recovery, but failed — the candlestick closed at the daily low, leaving a long upper wick, a classic sign of selling pressure.
In this context, we could assume that:
→ Bears may seek to extend their advantage and test the year’s low;
→ The bearish gap area (highlighted in purple), reinforced by the descending channel’s median line, could act as resistance during any potential recovery.
At the same time, the $250 psychological level appears to be a strong support zone. This is backed by the 15 May bullish pin bar formed on record trading volumes — a potential sign of institutional interest in accumulating shares of this healthcare giant in anticipation of a long-term recovery.
This article represents the opinion of the Companies operating under the FXOpen brand only. It is not to be construed as an offer, solicitation, or recommendation with respect to products and services provided by the Companies operating under the FXOpen brand, nor is it to be considered financial advice.

NVO Could Bounce Back Soon ?!NVO dropped hard (over 20%) mainly because of a legal issue. I think this is temporary and will get solved with time. The stock is now super oversold and sitting on strong support around $52–53.
• Entry: $52–54
• Target 1: $56.90
• Target 2: $66.40
• Stop Loss: $50
If the issue clears, we could see a strong rebound and possibly a full recovery of this drop.

Tesla Builds Toward Fair Value GapFenzoFx—Tesla (#TSLA) bounced from the ascending trendline and closed yesterday's session at the volume point of interest, the $322.3 mark. This level is above the monthly VWAP, meaning bulls are gaining, and bears are losing money.
That said, we expect the uptick in momentum to resume, targeting $338.9, and if this level is breached, the stock will likely aim to fill the Fair Value Gap at $350.0.

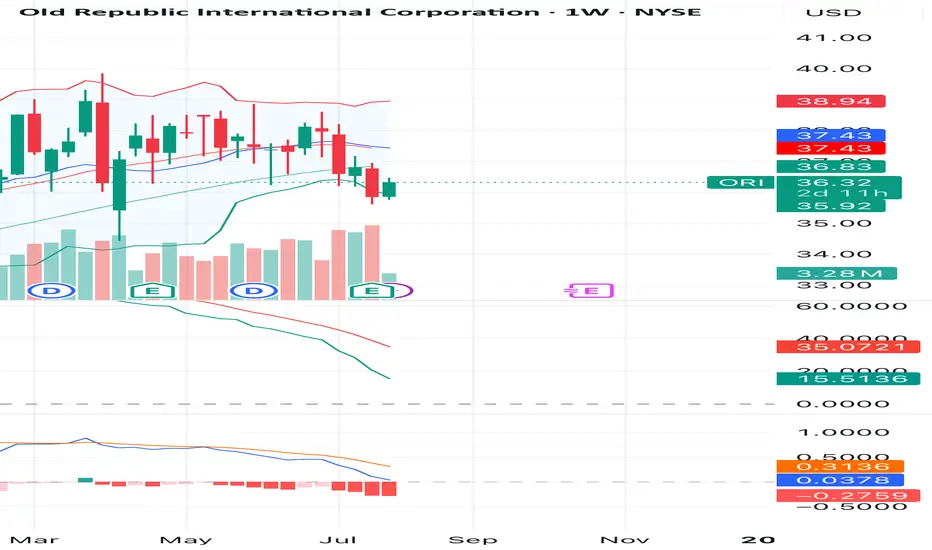
ORI Might Move Up SoonI feel like ORI could make a move soon. It bounced from the support area around 35.9 and closed above it with good trading volume. If the momentum continues, we might see it push toward 37 or even 38.
• Target: 37 – 38
• Stop Loss: below 35.5
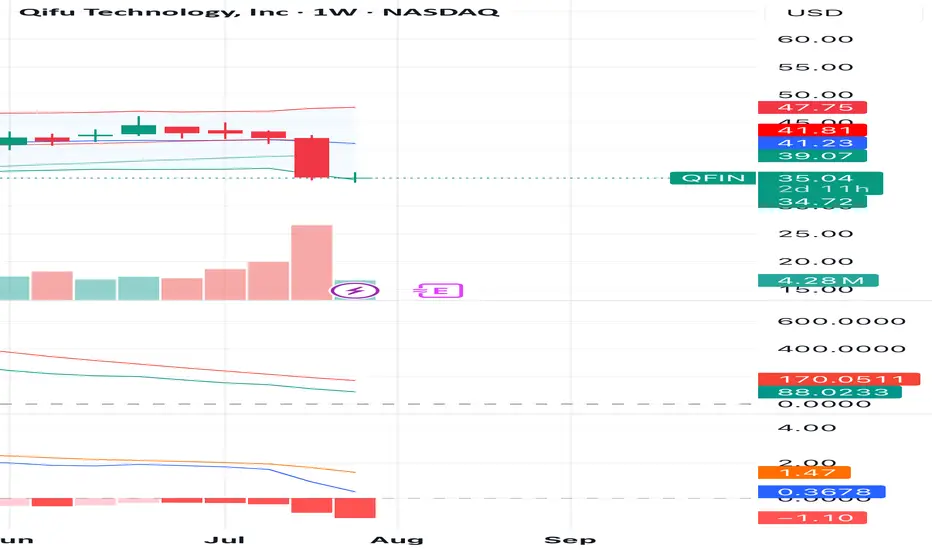
QFIN – Oversold Levels Could Trigger a Technical ReboundQifu Technology (QFIN) experienced a sharp sell-off, bringing the stock down to $35, which aligns with a key support zone near $34.70. The heavy selling volume suggests capitulation, and historically, such moves are often followed by short-term technical rebounds.
From a technical standpoint:
• The stock is now trading well below major moving averages, indicating an oversold condition.
• MACD and RSI are deeply negative, which could attract buyers looking for a mean reversion bounce.
• Support is holding near $34.70, making it a potential entry zone for a rebound.
Trade Idea:
• Entry: Around $35
• Target 1: $39.00
• Target 2: $41.20
• Stop Loss: $34.00
If the stock maintains support this week, we could see a recovery toward the $39–$41 range as sellers exhaust and buyers step in.
SIGI – Potential Reversal and Bullish Momentum AheadSelective Insurance Group (SIGI) is showing early signs of a potential bullish reversal after a sharp sell-off. This week, the stock has rebounded strongly from recent lows, closing above the $81 mark with increased trading volume, indicating renewed buying interest.
From a technical perspective:
• The strong bounce from support near $80 suggests that selling pressure is easing.
• Bullish volume has emerged following the recent earnings dip, showing accumulation by buyers.
• Momentum indicators (MACD & RSI) are starting to stabilize, which often precedes a short-term price recovery.
• Price is attempting to reclaim the mid-range of the Bollinger Bands, signaling potential for a push toward upper resistance levels.
Trade Idea:
• Entry: Around current levels ($81)
• Target 1: $86.90
• Target 2: $88.80
• Stop Loss: $80.70
If bullish momentum continues, we could see SIGI retesting the resistance zone around $87–$89 in the coming sessions.
