NVDA Rejection From Supply! July 30NVDA Rejection From Supply! Will Gamma Walls Trap Bulls Below 178? 🔥
🧠 GEX-Based Options Outlook (1H GEX Chart)
NVDA currently trades around $176, just below the key Gamma Wall at $178, which aligns with the Highest Positive NETGEX zone and a Call Wall cluster between $178–$180. This setup suggests that any move above $178 will face strong gamma resistance, and market makers will likely hedge by shorting, making it harder for price to rally.
* GEX Zones Overview:
* Strongest Call Walls: $180, $182.5, $185
* Gamma Wall: $178 (Major resistance)
* PUT Walls: $170, $167.5, $165 (Defensive zones)
* IVR is very low at 11.5, and IVx is near average at 40.8 — implying premiums are cheap, and buyers of options may benefit if volatility spikes.
📉 Bias: Neutral-to-Bearish short-term unless NVDA cleanly reclaims $178 with volume.
💡 Options Suggestions:
* Put Debit Spread: Buy 175 Put / Sell 170 Put (limited risk, targeting a move to GEX7 zone)
* Call Credit Spread: Sell 178 Call / Buy 182.5 Call (fade the resistance zone with defined risk)
* Directional Put: Buy 175 Put for potential flush to 172 or lower if GEX support fails
📊 1-Hour Intraday Technical Analysis
Market Structure & Smart Money Concepts:
* A clear Change of Character (CHoCH) occurred after price failed to hold the ascending trendline from July 24–29.
* Break of Structure (BOS) at $176.75 confirmed the shift from bullish to corrective.
* Price is now under the order block rejection zone (highlighted pink) and has respected a bearish supply reaction.
Support/Resistance:
* 🔻 Resistance: $176.75 (previous BOS), $178 (Gamma Wall)
* 🟢 Support: $172.94 (FVG zone) and strong PUT wall at $170
* Critical liquidity zone sits between $165–$168 — this is a potential magnet if downside accelerates.
EMA 9/21 Status:
* Bearish crossover already triggered.
* Price now trades below both EMAs, reinforcing bearish short-term control.
Volume Analysis:
* Last few red candles show increasing sell volume — institutional exit or short entry likely occurred.
🔀 Scenarios to Watch
Bullish Intraday Setup:
* If NVDA reclaims $176.75 with strong momentum and breaks above $178 (Gamma Wall), potential to squeeze to $180 and $182.5.
* Entry: $177.20+ reclaim
* Stop: $175.90
* Target: $179.65 → $182.50
* ⚠️ Needs strong volume and VIX relief to work
Bearish Intraday Setup (High-Probability):
* Price stays below $176 → fade any retest of $176.75
* Entry: $175.90 or below
* Stop: $177.30
* Target 1: $172.94
* Target 2: $170
* Extended: $167.5 if GEX support collapses
📌 Final Thoughts
NVDA just triggered a bearish shift in structure after a strong run. With IV still low and GEX pressure mounting at the $178 level, the setup leans more toward bearish-to-sideways chop unless bulls reclaim key resistance. Ideal strategy is to fade into resistance and scale out near the lower GEX walls.
This analysis is for educational purposes only and does not constitute financial advice. Always do your own research and trade responsibly.

Will $222 Hold or Are We Heading for $215 Flush? July 30AMZN Breakdown in Progress!
🔍 GEX Insights & Options Trading Thoughts (1H Perspective)
Amazon (AMZN) is transitioning from a distribution phase into a potential gamma-driven selloff, and the current GEX setup confirms that bias. The GEX walls are sharply stacked on the downside, while call walls remain heavy above current price—creating strong overhead pressure.
🔸 Gamma Exposure Breakdown:
* Highest Positive GEX (Call Resistance):
* $236 → this is where market makers lean short, and we see strong rejection wicks from this zone.
* 3rd Call Wall: $236
* 2nd Call Wall: $242.5
* GEX Flip Zone / Transition Area: $231–227.5
* Below this = gamma turns negative, increasing downside velocity
* PUT Walls:
* $225 = 3rd PUT Wall (-20.13%)
* $220 = Major PUT Support (-26.16%)
* $215 = 2nd PUT Wall (-22.2%)
The positioning suggests a gamma gravity pull toward $225 → $222, with high risk of flush to $215 if $222 breaks.
🔸 Options Setup Suggestions:
* Bias: Bearish
* Ideal Option Play:
* Aug 2 / Aug 9 $225P or $220P
* Enter on failed retest of $231
* Exit partial at $225, full at $222 or $215
* Avoid chasing puts too late—look for retest rejection near $231–232
If you're conservative, watch for a break and close below $227.5 to confirm further drop before entering.
🧠 1H Intraday Technical Analysis (TA)
Market Structure:
* AMZN broke below the ascending trendline, showing a clean CHoCH (Change of Character) after price rejected $236 twice—clear sign of distribution.
* BOS → CHoCH sequence confirmed, showing the shift from bullish to bearish order flow.
* Price is now trapped below the former support zone ($231.5), which has turned into supply.
Supply & Demand Zones:
* Supply Zone (Resistance): $234.5–236
* Micro Supply (Retest Area): $231.5–232.5
* Demand Zone (Support): $223–222
* Next Key Demand: $215
* If $222 fails, there’s minimal liquidity support until $215
Volume & Confirmation:
* Volume profile shows declining participation on upside pushes, followed by heavy sell volume candles post-CHoCH.
* This supports the idea of institutional distribution above $234.
🧭 Trading Outlook
🔻 Bearish Intraday Play (Favored):
* Entry 1: Retest rejection at $231.5–232
* Entry 2: Breakdown below $227.5
* Target 1: $225
* Target 2: $222.5
* Target 3: $215 (if panic flush triggers)
* Stop Loss: Above $234
🔼 Bullish Reclaim (Less Likely):
* Needs to reclaim $234.5 with strength
* Would target $236, $240
* Not supported by GEX or volume—low probability
🧠 Final Take:
AMZN is now trapped beneath heavy call walls and has shifted structure with a confirmed CHoCH. GEX shows negative gamma territory below $227.5, creating a slippery slope toward $222. The option market is positioning for further downside while intraday structure aligns for a potential flush into lower demand zones. Unless bulls reclaim $234+ with volume, this setup remains bearish biased with favor to PUT side trading.
🛑 This breakdown is for educational purposes only and does not constitute financial advice. Trade at your own risk and always manage your positions carefully.
TSLA Rejection at Supply! Breakdown & Options Outlook. Jul 30🔍 Technical Analysis (1H Chart)
TSLA failed to hold above the mid-supply zone around 330–335, rejecting cleanly after forming what looks like a double top on the 1-hour chart — a bearish reversal pattern. Price has since made a CHoCH (Change of Character), confirming shift in market structure from bullish to short-term bearish.
We now see price hovering just above 320, which aligns with GEX and SMC support zones. Volume on the rejection candle was higher than average, confirming strong selling pressure.
A bearish BOS (Break of Structure) also aligns with the double top, adding conviction that bulls are weakening.
🧠 GEX & Options Sentiment (Options GEX Chart)
* Highest Gamma Wall (Call Resistance): 338.48
* Current Price: 325.78
* Gamma Weak Zone: 325–335
* PUT Wall (Support): 300
* IVX avg: 51.5 (neutral/low vol), IVR: 6.2
* Call/Put Sentiment: Balanced — Calls: 49.5%
GEX sentiment shows TSLA is pinned in a gamma transition zone, stuck between heavy resistance above and decent put support near 300–310. That’s your battlefield.
🎯 Trading Scenarios (1H View – Swing)
Bearish Setup
* Entry: Below 319 confirmation
* Target 1: 310
* Target 2: 300 (GEX put support)
* Stop: 326 (above CHoCH zone)
* Bias: 🔻 Until demand zone or reclaim of 330
Bullish Reclaim Scenario
* Entry: Above 330 with volume
* Target: 338 then 345
* Stop: 324
⚡ 15 Min Intraday Scalping Outlook
* Bias: Bearish unless reclaim 326+ with strong volume
* Expect short-term bounces off 315 or 310 for scalp CALLs
* VWAP resistance will be key intraday
* Keep an eye on MACD crossover + OB (Order Block) entries on micro pullbacks
🎯 Suggested Options Play
For Bearish Move (if 319 breaks):
* 🛑 Buy TSLA Aug 2 PUT 320 or 315
* 🎯 Target IV expansion near 305
* Tight stop — re-evaluate above 326
For Bounce from 310–315 Zone:
* 🎯 Buy TSLA Aug 2 CALL 320 if strong reversal + OB entry
* Scale out near 325–328
* Risk defined: below 310
🔚 Summary
TSLA shows weakness after forming a double top and CHoCH at the 330–335 level. Gamma levels suggest pressure toward 310–300 unless bulls defend fast. Watch the reaction at 319–320 for short entry, or at 310–315 for scalping bounce setups.
Disclaimer: This analysis is for educational purposes only. Always do your own research and manage risk accordingly.

GOOGL Approaching Inflection Point! Jul 30GOOGL Approaching Inflection Point! Will It Hold Above 195 or Break Down to 190? 🚨
GEX Options Sentiment Overview (1H Chart)
GOOGL's current price hovers around $195.30, right under a cluster of heavy Call Walls:
* 197.5 is the 3rd Call Wall (65.53%)
* 200 is the 2nd Call Wall (88.34%)
* 205-210 shows diminishing gamma influence but still has meaningful hedging overhead
Meanwhile, downside Put Support levels are more scattered:
* 190 marked as HVL and near a GEX neutral zone
* 187.5 sits on PUT Support (-22.57%)
* 180 aligns with the 3rd Put Wall
The GEX magnet appears strongest between 195–197.5, while 190 acts as a gamma floor and volatility trigger if breached. Overall GEX sentiment is neutral-to-bullish short-term, with dealers possibly pinned until a gamma release.
Options Strategy Thoughts:
* Bullish: Consider a short-term debit call spread (195C/200C), targeting a gamma squeeze above 197.5 if market flows support continuation.
* Neutral-leaning-bearish: Sell credit spreads like 200C/205C if GOOGL gets rejected at 197.5 zone and starts to compress below 194.50.
IVR is low at 16.7, while IVx is elevated near 31, suggesting buying premium could still pay off if price breaks key gamma levels fast.
Intraday Technical Analysis (1H Chart)
The 1-hour chart shows clear structure and breakout momentum:
* Break of Structure (BOS) confirmed above 194.70 on July 29
* Strong upside rally retested and held trendline support
* Price is consolidating in a tight box between 194.9–195.5, forming a potential bullish flag/channel
* Fair Value Gap (FVG) has formed near 192.5, unfilled — could serve as liquidity target if price dips
Key Support Levels:
* 194.03 (mid-level retest zone)
* 192.58–190.85 is a demand cluster and previous ChoCH zone
Key Resistance Levels:
* 197.5 is both a key psychological and GEX resistance level
* 200 is strong resistance based on Call Wall and prior swing highs
Price Action Outlook:
* As long as GOOGL holds above 194, the bullish bias remains intact.
* A breakout above 195.50 with volume opens the door toward 197.5 and potentially 200.
* A drop below 194 signals potential pullback to 192.5 or even deeper liquidity sweep toward 190.
My Thoughts for Tuesday's Setup:
* Scalpers: Watch for breakout retest at 194.90–195 zone. A strong 1H candle close above 195.50 with volume confirms scalp-long opportunity to 197.5.
* Swing traders: Risk-to-reward favors long above 194 with stops under 192. Targets: 197.5 → 200.
* Options: If GOOGL rejects 197.5 again, fading with cheap OTM puts targeting 190–192.5 could reward well, especially into August expiration.
Disclaimer: This analysis is for educational purposes only and does not constitute financial advice. Always conduct your own research and manage risk appropriately before trading.

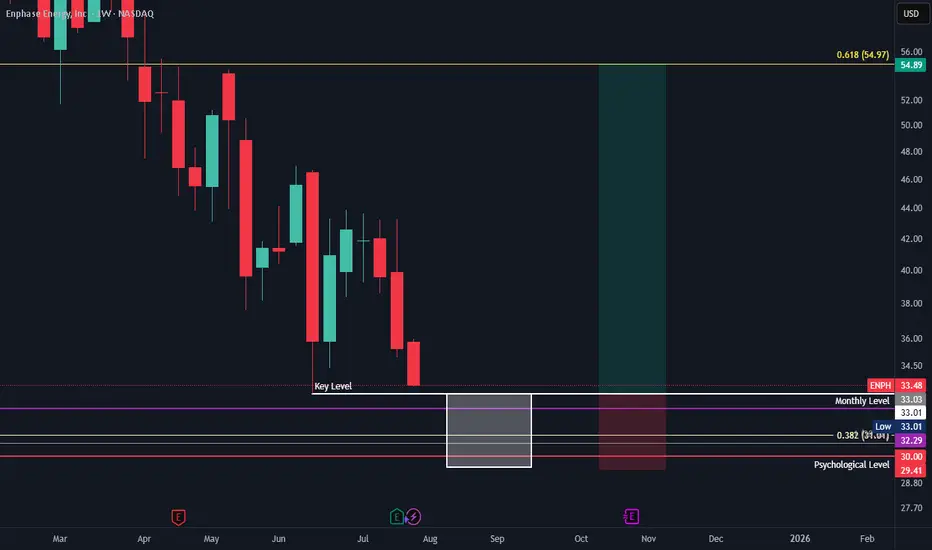
Enphase potential swing long zoneWe have a little zone of confluence. With the 0.382 macro retracement from ATL/ATL stacking with the 1 to 1 fib trend from ATL coming in around 32. You have have monthly level and the pyschological 30 level. 1 way to approach the long would be to see price go below previous low/key level and look for some strength in terms of closing a daily or weekly candle back above.
Why Did Novo Stock Fall So Sharply YesterdayNovo Nordisk shares plunged nearly 20–23% on July 29, 2025, marking its worst trading day since Black Monday in 1987.
Significant Downgrade of 2025 Financial Outlook
The company revised its sales growth forecast for 2025 down to 8–14%, from its prior guidance of 13–21%, and reduced expected operating profit growth from 16–24% to 10–16%. This adjustment was attributed to weaker-than-expected demand for Wegovy and Ozempic, and rising competitive pressures
#TheWallStreetJournal
I will start my accumulation using DCA, but will be happier to start buying this stock heavily from $47 zone.
trade with care.
I look forward to connecting with you

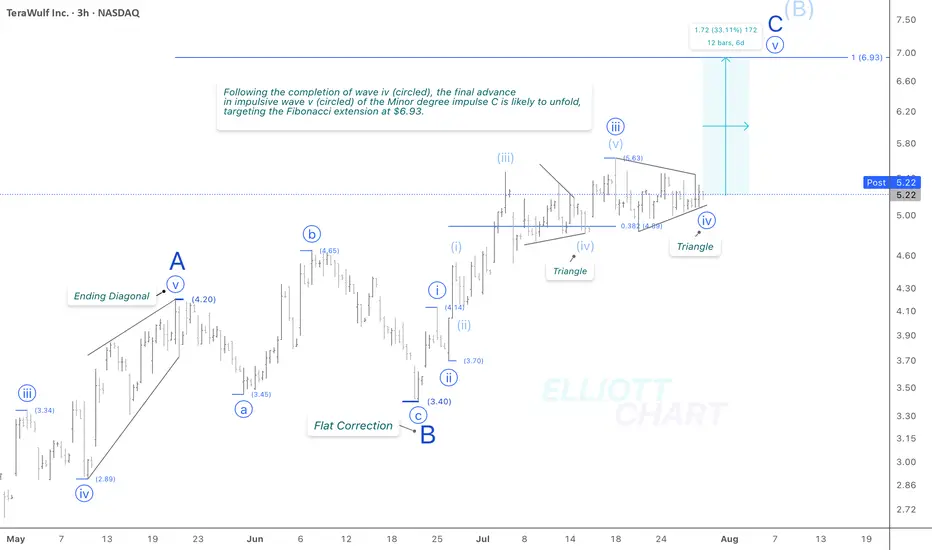
WULF / 3hNASDAQ:WULF continued to consolidate sideways today, in line with expectations, with no material change to the broader outlook. The narrowing price action supports the current wave structure—specifically, a completed triangle in wave iv (circled), likely preceding the anticipated final advance of approximately 33% in wave v (circled) of the ongoing Minor degree wave C.
The Fibonacci extension target at 6.93 remains valid.
Trend Analysis >> Upon completion of Minor degree wave C, the countertrend advance of Intermediate degree wave (B), which has been unfolding since April 9, is likely to give way to a decline in wave (C) of the same degree. This downtrend might begin in the coming days and potentially extend through the end of the year!!
NASDAQ:WULF CRYPTOCAP:BTC BITSTAMP:BTCUSD MARKETSCOM:BITCOIN
#CryptoStocks #WULF #BTCMining #Bitcoin #BTC
New Setup : $HTZNASDAQ:HTZ is showing again a new bullish crossover. The previous ones brought a HUGE return !
The setup is ready here

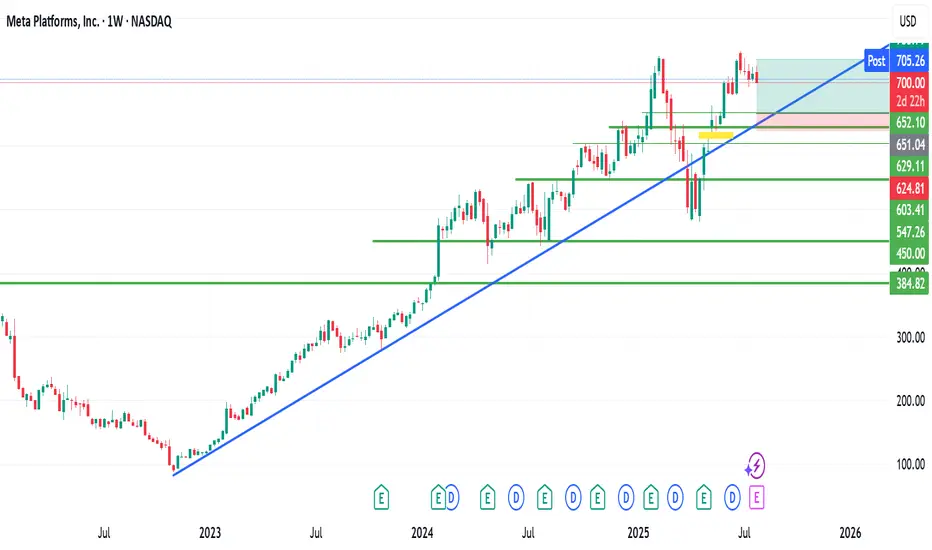
Is this possible with METAIs this possible with META?
META stock is currently trading at $700.
My technical view as shown on the chart, is looking at a possible retracement to around $650.
The question is ''Is this possible?
If it ever gets to this forecasted zone, I will accumulate massively.
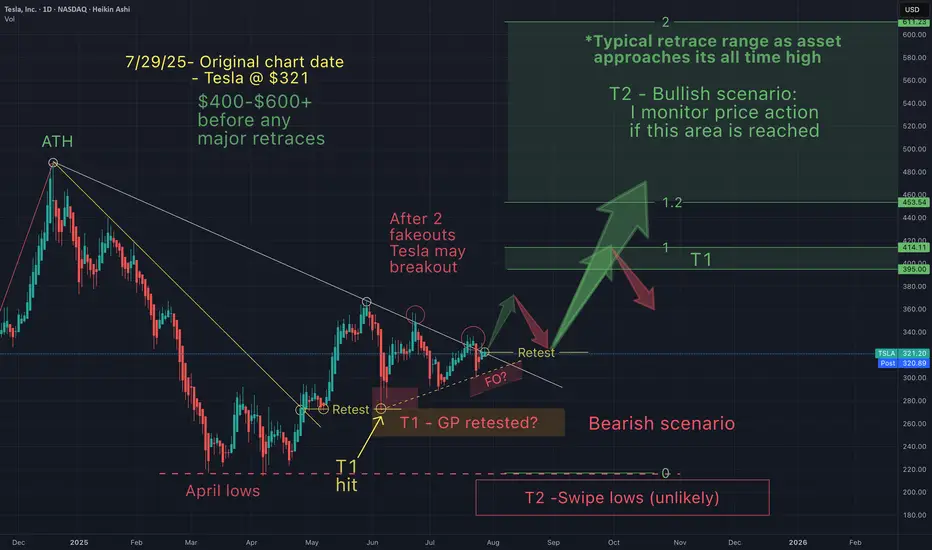
Tesla - A story of an underdogSeveral of the Mag 7 are getting over heated, so I like to look at the ones that haven't caught up.
Since I don't have a crystal ball, I must consider the bearish and bullish scenarios.
As an investor I must pivot accordingly as one of these scenarios gets invalidated.
So on my charts you'll always see both scenarios. Today I'm leaning towards the bull.
Tesla just needs a narrative shift (ie -new invention etc), & price action changes in a heart beat.
Yet, price action really has less to do with the news making Elon a hero, then a villain and then back and forth...but moreso to do with price action patterns that just keep repeating.
So if we don't get a dead cat bounce, I believe Tesla could eventually head towards it's ATH, if this bull market continues.
QuickTrade : KHCThe 15 minutes chart shows our Setup.
Bullish crossover, bullish Alert, Positive price action.
Ready to catch it with Earnings coming !

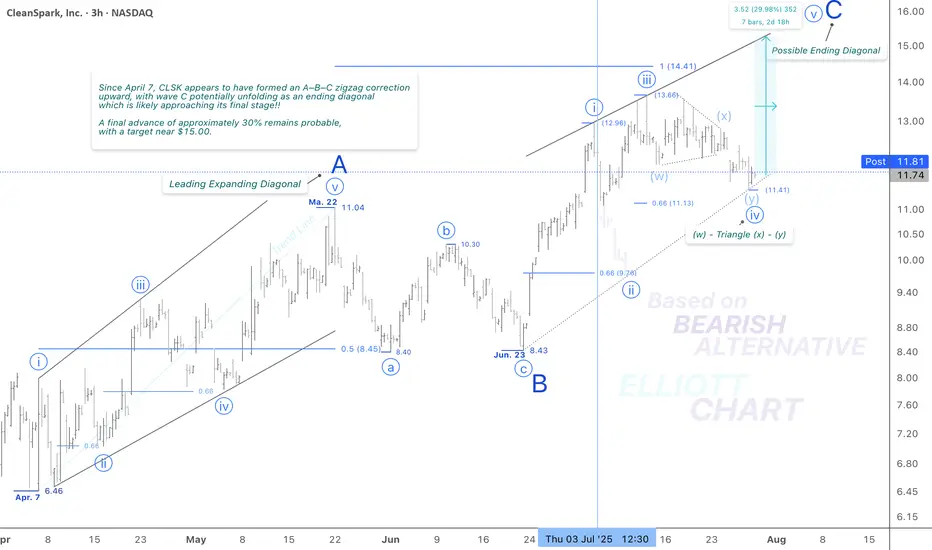
CLSK / 3hThe modest and unexpected 2.5% decline in NASDAQ:CLSK today suggests a potential shift in the wave iv (circled) corrective structure—from the previously identified to a more complex combination.
This adjustment still fits within the context of the ending diagonal pattern in Minor wave C and reflects a deeper, yet corrective, move down. The overall outlook and wave structure remain unchanged.
Wave Analysis >> As illustrated in the 3h-frame above, Minor wave C—completing the corrective upward move of wave (B)—appears to be unfolding as an ending diagonal, now likely in its final stages. Within this structure, the Minute wave iv (circled) has formed a correction. A final push higher in Minute wave v (circled) is now expected, which would complete the ending diagonal pattern of wave C, and in turn, conclude the countertrend advance of wave (B).
Trend Analysis >> Upon completion of the potential ending diagonal in Minor wave C, the broader trend is anticipated to reverse to the downside, initiating the final decline in Intermediate wave (C). This bearish phase may extend through the remainder of the year.
#CryptoStocks #CLSK #BTCMining #Bitcoin #BTC
NASDAQ:CLSK CRYPTOCAP:BTC BITSTAMP:BTCUSD MARKETSCOM:BITCOIN
New Setup : WRBConslidation area at $68-$69 with emas that are now flat.
The hourly chart looks good to me without earnings right now.
An action higher will create a enw ATR Alert as well
Ready To catch it !

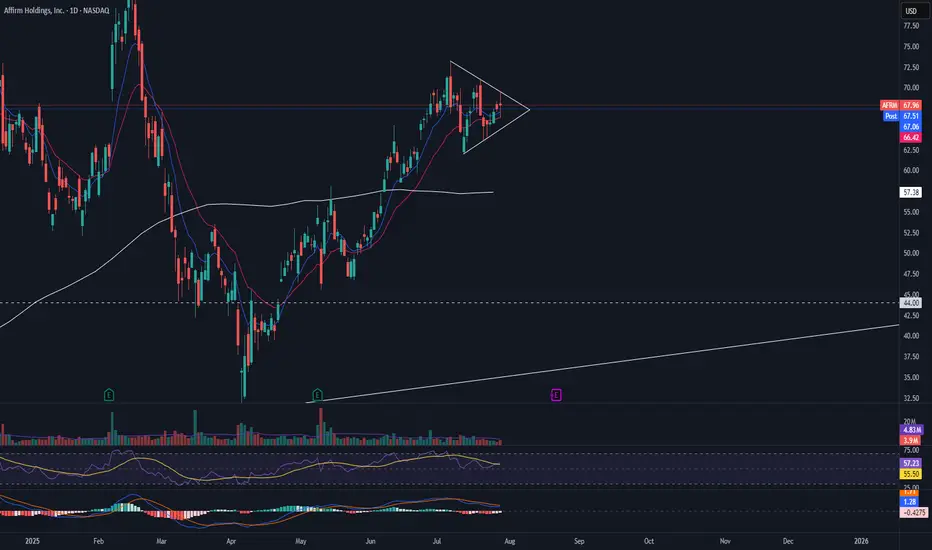
AFRM pre earnings triangleAFRM is currently in a symmetrical triangle with RSI and MACD beginning to show the pattern may come to an end. I would want to see this triangle break with volume before entering a long position.
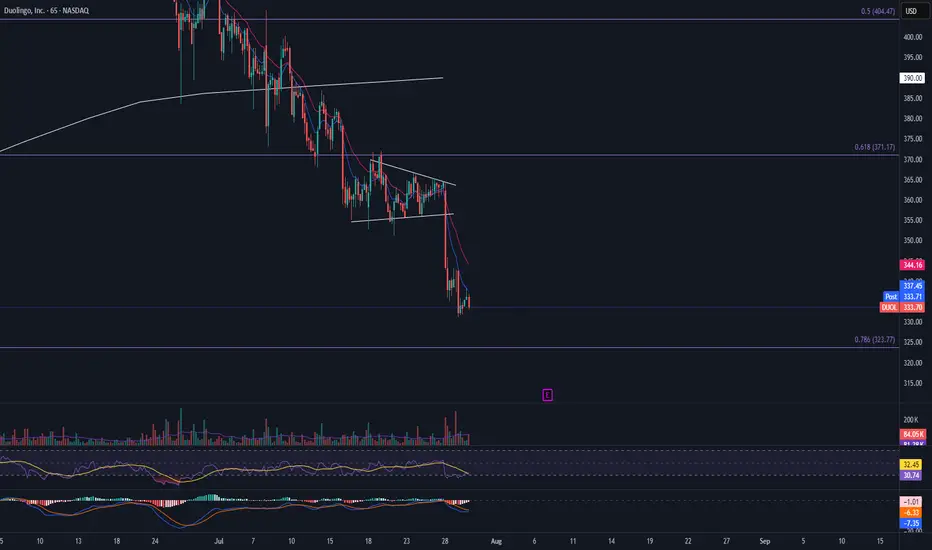
DUOL Bear Flag Break
DUOL has broken the bear flag down and continuing its move towards the 786 FIB level. I would want to see a bounce off this level and then a following close above the 9 EMA on the daily chart.
New Highs Will Be DelayedThis is how it's going to be. You can disagree and be against it all you want, but much more consolidation in price will occur first over the long term, before a proper bull run returns.

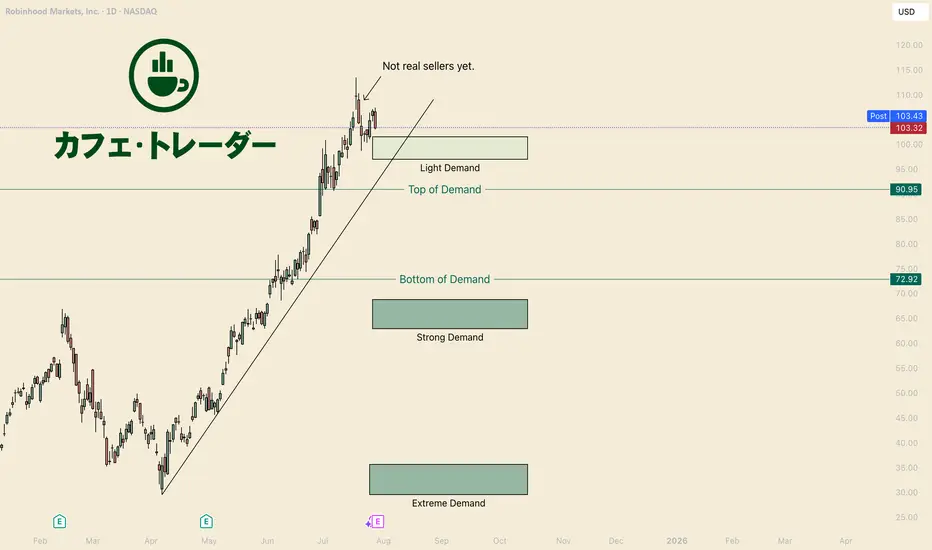
How to Buy HoodHello I am the Cafe Trader.
Since visiting that Extreme Demand back in April, Robinhood has essentially moved strait up.
If you have not seen my previous post on HOOD, we were able to identify EXACTLY where the buyers were. I strongly encourage you take a look at that article.
Today I'm going to give you a Short Term and Long Term perspective.
Short Term
What we do Know
"Light Demand" have the most aggressive Bulls, but we have to assume that they are the most fragile .
We know this selling hasn't been shown to be an aggressive Bear yet. This also assumes there is no reason to short this until sellers gain some control.
1) With these things in mind: Until the trend breaks or bears close below the "Light Demand" zone, II find no reason, and would even say its daring to short HOOD.
2) Yes it's overextended when it comes to a channel, a fib, an MA... No one can confidently tell you where the top is. Unless you are looking at the footprint seeing an absurd amount of absorption IMO.
With these things in mind, all I can say is to be patient, and wait for the market to give you more information that you can do something with.
Day Traders like myself will have the best odds to make intra-day plays, but that's not this articles focus.
Long Term
If you got in early and you are still holding, Great work!
for those who feel like they missed the move, or are looking to add some to your long term, don't worry we are position you for success.
This list of areas is according to your personal sentiment. The "Good Price" is where I think they best position is going to be.
Hyper Aggressive = 97.50 - 101.50 (Light Demand)
Aggressive = 91 (Top of Demand)
Good Price = 62 - 68.5 (Strong Demand)
STEAL = 31.50-36.50 (Extreme Demand)
Exciting times for HOOD! I am bullish myself, and I hope to see better and bigger things from Robinhood.
Thank you for reading, Follow for more evaluations and live trades.
Happy Trading!
@thecafetrader
United Health - The perfect time to buy!⛑️United Health ( NYSE:UNH ) finished its massive drop:
🔎Analysis summary:
Over the past couple of months, United Health managed to drop an incredible -60%. This drop however was not unexpected and just the result of a retest of a massive resistance trendline. Considering the confluence of support though, a bullish reversal will emerge quite soon.
📝Levels to watch:
$250
SwingTraderPhil
SwingTrading.Simplified. | Investing.Simplified. | #LONGTERMVISION

WING Earnings Play (2025-07-29)
**🍗 WING Earnings Play (2025-07-29)**
**🔥 Oversold Setup + 88% Beat Rate = Opportunity**
**🎯 Trade Plan**
• **Stock**: \ NASDAQ:WING
• **Type**: Call Option (LONG)
• **Strike**: \$290
• **Entry**: \$19.20
• **Target**: \$38.40
• **Stop**: \$9.60
• **Expiry**: Aug 15, 2025
• **Entry Time**: Before earnings (AMC 7/30)
• **Confidence**: 72%
• **Expected Move**: ±5%
• **IV Rank**: 75 (Elevated)
**📊 Why WING?**
✅ **RSI = 19** (deeply oversold)
✅ 88% earnings **beat rate** (last 8 Qs)
✅ 17.4% **YoY rev growth**
✅ Volume up 1.28x avg
📈 Setup for **volatility crush + upside surprise**
**⚠️ Risk/Reward = 2:1+**
Cut below 50% premium loss. Target double on upside earnings breakout.

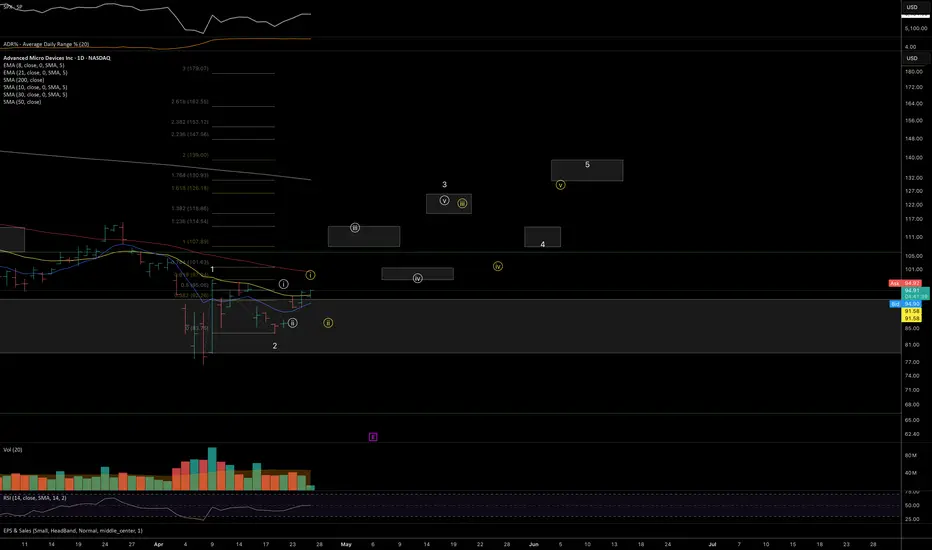
AMD: Potential Mid-Term Reversal from Macro SupportPrice has reached ideal macro support zone: 90-70 within proper proportion and structure for at least a first wave correction to be finished.
Weekly
As long as price is holding above this week lows, odds to me are moving towards continuation of the uptrend in coming weeks (and even years).
1h timeframe:
Thank you for attention and best of luck to your trading!
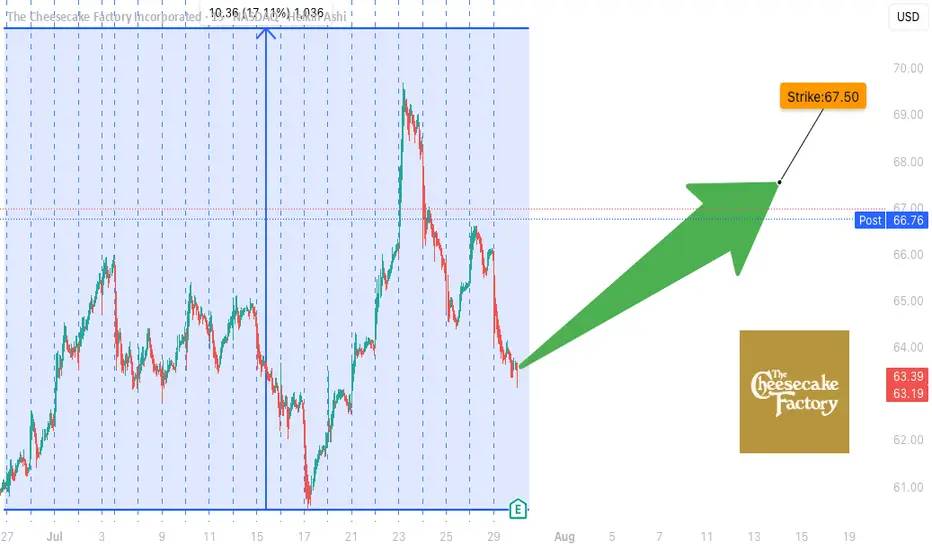
CAKE Earnings Trade Setup (2025-07-29)
**🍰 CAKE Earnings Trade Setup (2025-07-29)**
🎯 **Bullish Bias** | Confidence: **72%**
💡 **Historical Beat Rate: 88%** | Strong pre-earnings drift
**📊 TRADE DETAILS**
• **Instrument**: \ NASDAQ:CAKE
• **Strategy**: Buy CALL
• **Strike**: 67.50
• **Entry**: \$1.45
• **Target**: \$2.90+
• **Stop**: \$0.72
• **Expiry**: 2025-08-15
• **Timing**: Pre-earnings close (AMC)
**📈 Setup Rationale:**
✅ History of positive earnings surprises
✅ Stock above key MAs with room to run
⚠️ Margin pressure & mixed options flow = manage risk closely
**🔥 Risk/Reward: \~2:1+**
Cut early if earnings miss. Target 200%+ return on surprise beat.
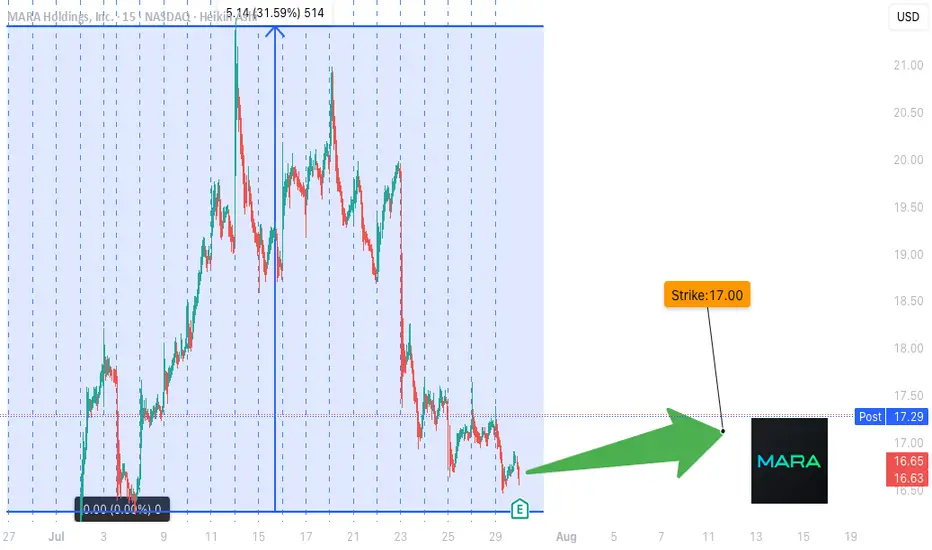
**MARA Earnings Setup – TradingView Breakdown**
🚨 **MARA Earnings Setup – TradingView Breakdown** 🚨
📅 *Earnings Play for 07/29/2025*
🎯 *Strike: \$17.00 Call | Exp: 08/01/2025*
💰 *Premium: \$0.59 | Target: \$1.18*
📈 *Conviction: 75% Bullish*
🔹
---
🧠 **What’s the Setup?**
MARA just raised \$950M to expand BTC holdings 💥
Revenue YoY growth: **+29.5%** 📊
Margins still rough: **-46.7% profit**, but potential catalyst is 🔥 if BTC pumps.
---
🧨 **Options Flow Is Heating Up**
👀 Massive open interest on **\$17 Calls**
🤏 Put/Call Skew slightly bullish
🧮 IV low despite high beta (6.55) = **cheap volatility play**
---
📉 **Oversold + Coiled Tight**
📉 RSI: 38.57 (Oversold)
📍 Support: \$16.50 | Resistance: \$17.50
💣 Sitting at key technical inflection pre-earnings.
---
🔮 **Trade Idea**
🎯 *Buy \$17C @ \$0.59*
🚀 Target: \$1.18 (2x gain)
🛑 Stop: \$0.30
📆 Exit within 2 hrs post-ER to avoid IV crush
---
📊 **Risk/Reward**
💰 Max Loss: \$59
📈 Potential Gain: \$118
⚖️ R\:R = 2:1
---
🔥 **Why It Could Go Viral**
✅ Bitcoin bullish narrative
✅ High beta + cheap IV = explosive setup
✅ Oversold technicals + earnings catalyst
---
🔁 **Like & Save this if you're playing MARA ER 🔥**
\#MARA #EarningsPlay #OptionsTrading #BitcoinStocks #TradingView #ShortSqueeze #CallOptions #HighBetaSetup #CryptoStocks #EarningsSeason #MARAAnalysis #TradingStrategy #Fintok #Finfluencer
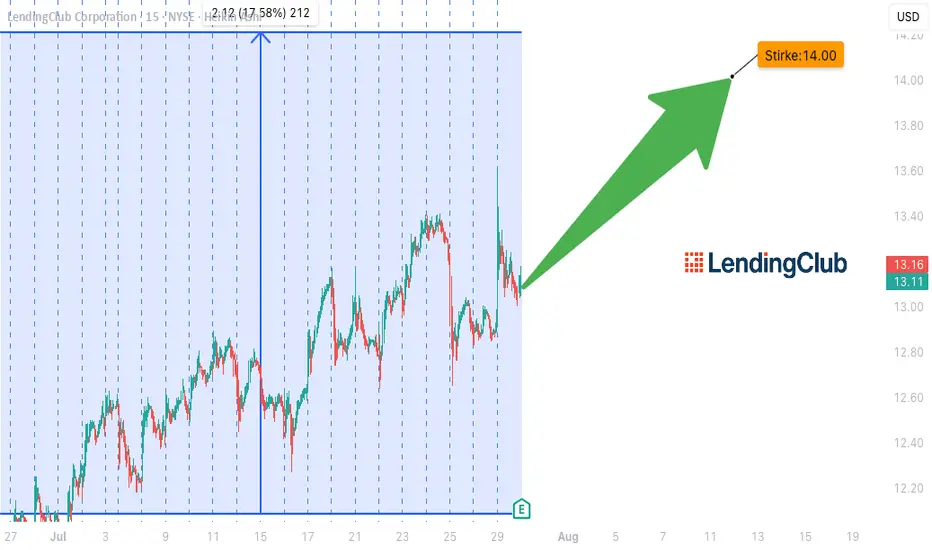
LC EARNINGS PLAY – STRIKE WHILE IT'S HOT!**
🚨 **LC EARNINGS PLAY – STRIKE WHILE IT'S HOT!** 🚨
📅 **Earnings Season Heat Check: LC | Jul 29**
💰 **Positioning for a Post-Earnings POP!**
---
🔥 **The Setup:**
LC’s earnings momentum is real –
📈 TTM Rev Growth: **+13.1%**
💹 EPS Surprise Rate: **150% avg**
📊 75% Beat Rate History
💵 Analyst Consensus: **Strong Buy (1.8/5)**
---
📉 **Technical Tailwind:**
✅ Price above 20D + 200D MA
✅ RSI: **60.07** – room to run
📈 Volume Spike: **+61% above 10-day avg**
🚀 Options flow targeting **\$14 CALLS** w/ OI: **864** / Vol: **737**
---
📌 **TRADE IDEA**
🎯 Buy: **\$14.00 Call @ \$0.70**
📆 Exp: **Aug 15, 2025**
🎯 Target: **\$2.10** (Risk/Reward = 1:3)
🛑 Stop: **\$0.35**
---
⚠️ **Earnings Risk:** IV crush real.
🎯 Exit within 2 hours **post-EPS** if no move.
Macro tailwinds + financial sector rotation = 🚀 fuel.
**Beta = 2.45** → Big move potential incoming!
---
🧠 Confidence Level: **75%**
⏰ Timing: Pre-Earnings Close
🧾 Model-Driven Strategy | No Hype, Just Edge.
---
💥 Let’s ride the LC earnings wave – \$15+ in sight! 💥
\#LendingClub #LC #EarningsPlay #OptionsTrading #TradingView #StocksToWatch #CallOption #Fintech #SwingTrade #EarningsHustle #BullishSetup #IVCrush #EarningsGamma #ShortTermTrade