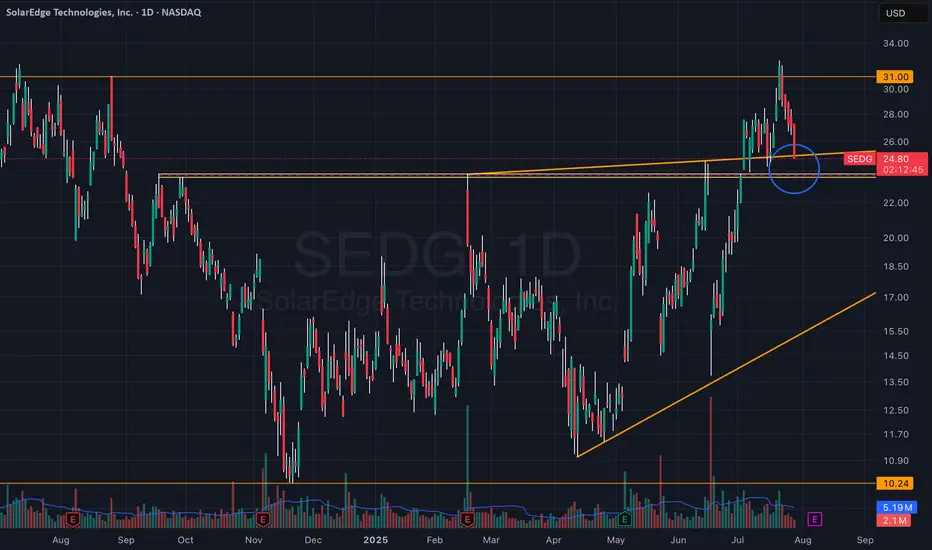
Slowly, surely.I've been trading the range for a while now, so when's it time to actually hold this obviously important technology stock?
Maybe when the RSI doesn't look like garbage. Until then, THE ZONE!

SOFI Breakout to 30$SoFi Technologies is primed for a major rally. The weekly chart is displaying a classic cup and handle formation, which is one of the most reliable bullish patterns in technical analysis. With the handle nearing completion, the stage is set for a breakout—often marking the start of strong upward moves as traders and investors take notice.
What gives this technical setup extra weight is SoFi’s recent earnings performance. The company delivered robust results, surpassing analyst expectations and showcasing significant growth in its key lending and technology divisions. This mix of a textbook bullish pattern and solid fundamentals sets the stock up for a rapid advance, making a $30 target look more achievable in the near term. As momentum builds, both the technical traders and fundamentals-focused investors could fuel the next leg higher for SoFi.

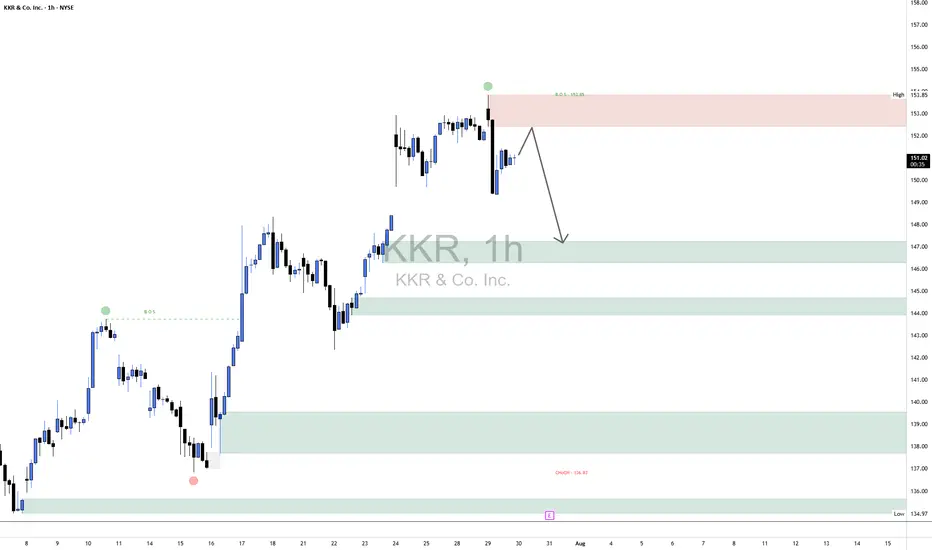
KKR Short1. Market Structure Context
Trend Prior to CHoCH: Bullish structure with higher highs and higher lows.
CHoCH (Change of Character): Occurred at $136.83 — a key higher low broke, indicating a possible trend reversal from bullish to bearish.
BOS (Break of Structure): Confirmed at $153.85, marking a shift to lower highs and supporting bearish continuation.
2. Key Supply & Demand Zones
🟥 Supply Zone (Resistance):
$153.05 – $153.85
Price previously distributed here before dropping.
Acts as a liquidity trap for late buyers and resistance for pullbacks.
🟩 Demand Zones (Support):
Zone 1: $147.00 – $148.00 → Minor demand; short-term reaction likely.
Zone 2: $144.50 – $146.00 → Historical pivot with volume; moderate demand.
Zone 3: $138.00 – $142.00 → Consolidation base; strong prior bullish impulse.
Zone 4: $134.00 – $137.00 → Final defense; includes the CHoCH at $136.83 and expected reaction if deeper retracement occurs.
3. Current Price Action (Bordered Region Focus)
Price currently trades around $151.06, beneath the key supply zone.
The market rejected supply and showed a bearish reaction.
Expectation: A pullback to ~$153 may occur, targeting trapped liquidity, before resuming bearish movement.
Next targets:
Primary: $147.50 (Demand Zone 1)
Secondary: $144.50 if breakdown intensifies.
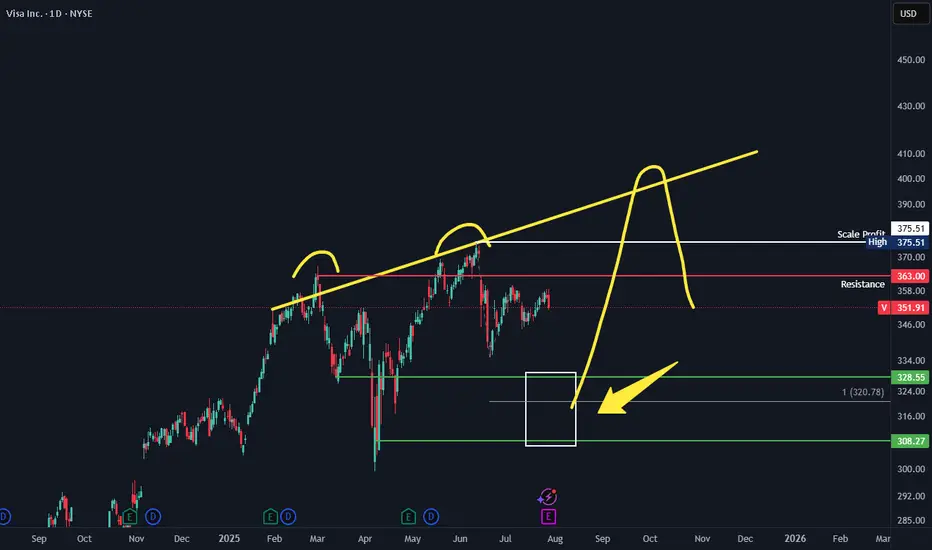
VISA 3 peaks and a dump. Should VISA pullback to the lower support zone. Look to swing long back to ATH with the big target of around 400 where 1 can look to swing short. The typical 3 peaks and a dump setup.
TSL PatienceTSL Fractal. Another several months of accumulation until December 2027 Chop then Parabolic. Chop Chop Chop. Dollar Raising Risk Off. Bitcoin Topping. Dollar Bottoming.

MRNA: Bullish Setup Ahead of Earnings & FOMCMRNA: Bullish Setup Ahead of Earnings & FOMC
Moderna (MRNA) appears to have found a bottom near $23.50, based on recent price behavior. Following that level, the stock began accumulating, suggesting renewed buying interest. This was confirmed when MRNA decisively broke above $28.50, signaling a shift in momentum.
The company is scheduled to report earnings on 01 August 2025. While there is a chance the results could be positive, even a miss may not result in a significant downside move. The real market risk lies with the upcoming FOMC meeting and interest rate decision tomorrow.
Depending on the tone of the Fed and rate guidance, MRNA should take the price direction. I expect the price to remain supported above the $28.50 zone, even in a pullback scenario.
Bullish targets I’m watching: $37.50, $44.50, and $48.50.
PS: In my view, using Call Options with longer expiration dates offers better risk management. You don’t need to put your entire account at risk in one trade. Call Options let you control exposure in a better way.
You may find more details in the chart!
Thank you and Good Luck!
PS: Please support with a like or comment if you find this analysis useful for your trading day

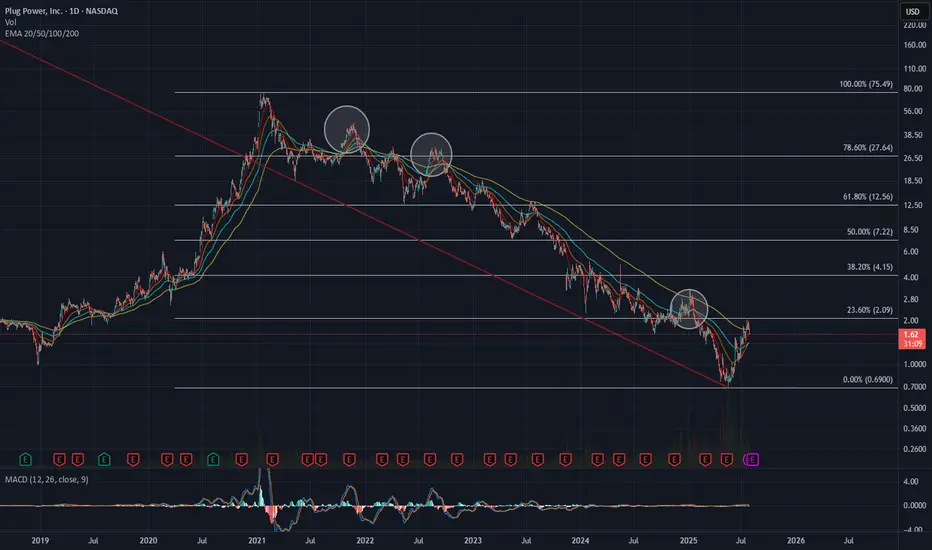
Plug Power (PLUG): Recovery Play or Terminal Decline?Plug Power Inc. (PLUG) , a company focused on green hydrogen and fuel cell technologies, stands as one of the most emblematic examples of a boom and bust cycle in the speculative clean energy sector.
It reached an all-time high of USD 75.49 in January 2021 , driven by market enthusiasm over the energy transition. However, since then, the stock has collapsed by more than 99% , hitting a low of USD 0.69 on May 16, 2025 . It currently trades below USD 2, reflecting a massive loss in market capitalization and deep investor distrust.
🧮 Fundamental Analysis
1. Business Model
Plug Power develops integrated systems for the generation, storage, and distribution of green hydrogen, mainly targeting logistics, mobility, and high-energy industrial sectors.
2. Financial Issues
Persistent losses: the company has been unprofitable for years. In 2024, it posted a net loss of over USD 700 million.
High operating costs and poor efficiency in hydrogen project execution.
Accounting concerns: the SEC flagged accounting issues in 2021 and 2022, further damaging institutional confidence.
3. Capital Dilution
Plug has repeatedly financed its operations through equity offerings, significantly diluting shareholders. Recent rounds were issued at very low prices, worsening the drop in share value.
4. Cash Position
As of June 2025, the company requires new capital to continue operations, facing the risk of issuing more shares or convertible debt under unfavorable terms.
⚠️ Key Risks
Delisting risk if the stock doesn’t remain above USD 1.00 in the short term.
Bankruptcy risk (Chapter 11) if no strategic financing or partnerships are secured.
The green hydrogen sector is still not cost-competitive without subsidies, and competition is fierce (Air Liquide, Linde, Bloom Energy, etc.).
✅ Opportunities
Potential to secure strategic alliances with utilities, automakers, or industrial partners.
Ongoing green subsidies from the U.S. and EU may offer short-term support.
Much of the negative outlook seems already priced in: current market cap is around USD 1.8 billion, with physical assets and contracts still in place.
📉 Technical Analysis
From its all-time low of USD 0.69, PLUG staged a strong rebound, gaining +294% to reach USD 2.03 on July 21, 2025 . It now trades in a consolidation zone between the 23.6% (USD 1.71) and 38.2% (USD 1.52) Fibonacci retracements , which may act as short-term technical support.
This is a high-risk, high-volatility stock , capable of generating outsized returns — or total losses. Strict risk management is essential.
Repeated Rejections at the 200-EMA
The 200-day exponential moving average (EMA 200) has acted as a dynamic resistance throughout PLUG’s multi-year downtrend. Over the past three years, the stock has attempted to break above it on at least three occasions — in 2022, 2023, and 2025 — but failed each time.
The most recent attempt, in July 2025, ended with a reversal after reaching USD 2.10, which also coincides with the 23.6% Fibonacci retracement from the all-time high. Unless the stock breaks above the 200-EMA with strong volume and an ascending price structure, the bearish trend remains intact.
🧠 Speculative Position
We are currently positioned with a bullish options strategy targeting a speculative upside:
📈 Buy CALL USD 2.00 (exp. January 16, 2026)
🛡️ Sell CALL USD 5.00 (same expiration)
→ This forms a Bull Call Spread, limiting downside risk while maintaining a favorable risk/reward ratio.
🧾 Conclusion
Plug Power is no longer a fundamentally sound investment , but rather a high-risk speculative play , comparable to a synthetic long-term call option . If the company survives, restructures its balance sheet, and secures strategic partners, the upside could be substantial — but the risk of total capital loss remains very real .
🧭 Suitable only for experienced traders with speculative capital and disciplined technical execution.
7/29/25 - $pen - It's a LT buy... seems "reasonable" into print7/29/25 :: VROCKSTAR :: NYSE:PEN
It's a LT buy... seems "reasonable" into print
- medical device company... peripheral thrombectomy products
- it's never been cheap, probably for a good reason
- about 3% fcf yield... mid teens growth... "not" health insurance (which i think is probably part of what's happening here... the read thru from perhaps pricing/ maybe?)
- the way i see this: it's a winner, it's insulated from money changer games (insurance), it's solving real world challenges
- so i'd ideally like to dip buy here... unclear if i'll play the print
- but ultimately i'd expect this stock to head higher. LT winner.
V

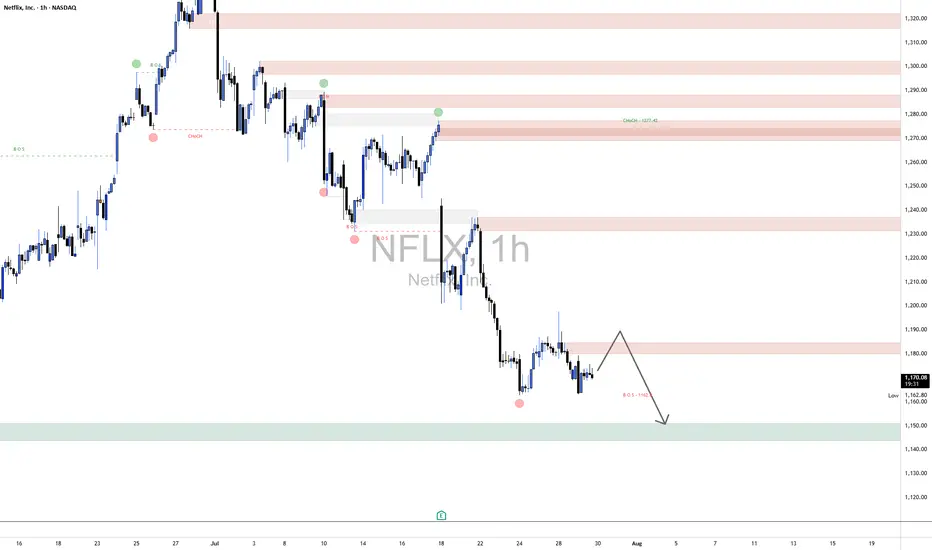
NFLX Short1. Market Structure Overview
The broader market structure has shifted bearish following a Change of Character (CHoCH) around 1277.42, where price broke below a prior higher low, suggesting a possible trend reversal. This was later confirmed by multiple Breaks of Structure (BOS) at lower levels, especially the key BOS at 1162.8, which solidified bearish intent. Each BOS has been followed by continued selling, showing strong bearish momentum and weakening buyer control.
2. Supply and Demand Zones
Several major supply zones (resistance) are present, especially at 1340–1330, 1300–1290, 1277–1260, and most immediately at 1185–1175, where price is currently reacting. These zones have previously shown strong rejections and are likely to cap bullish retracements.
On the demand side (support), the primary demand zone lies at 1130–1110, which acted as a prior accumulation base. A deeper demand area also exists near 1100–1090, which could serve as a last-resort support if price breaks lower.
3. Price Action Within Key Border
Currently, price is hovering around 1173.99, inside the lower supply zone of 1185–1175. The structure suggests a potential short-term retracement to this zone before continuation lower. If price rejects here again, the expectation is for a move toward the 1130–1110 demand zone. However, a strong breakout and hold above 1185 could open the path for retesting higher supply levels like 1225–1245.
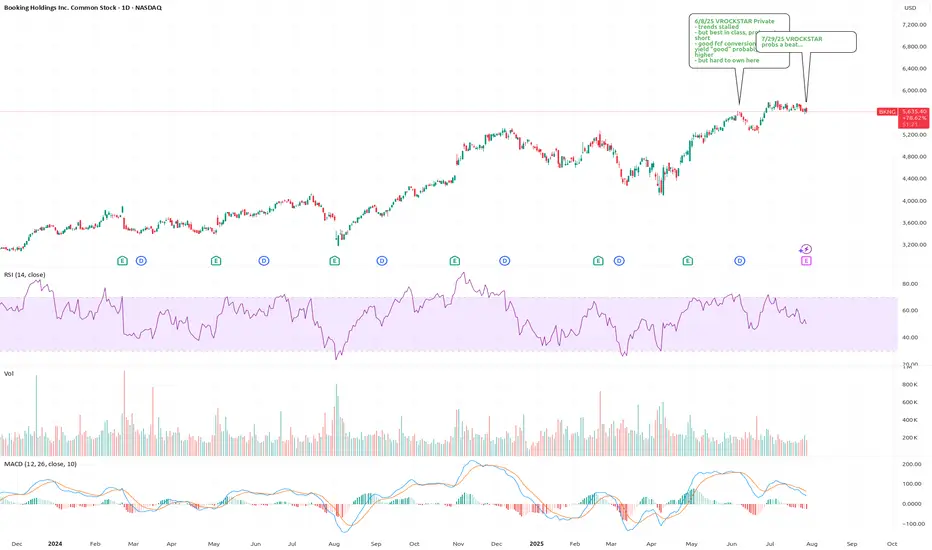
7/29/25 - $bkng - probs a beat...7/29/25 :: VROCKSTAR :: NASDAQ:BKNG
probs a beat...
- while everyone's happy to pay 150x for PLTR... there r a lot of consumer names that seem to be trapped in trump tariff paralysis.
- what happened... is trump... caused a dip... consumer spending paused... then nothing happened... and all that pent up demand came right back in the last quarter... most consumer names are demonstrating just this
- so while on any given consumer name there r specifics that i'm not tuned into... and also some biz models r ostensibly better than others e.g. bkng > abnb
- at 5% fcf yield, leadership position... not even 30x PE
- i just don't get what's not to like here, remember: own the consumer interface (these r the winners in the next 5 yrs... not the backend/ not the saas... the person who owns the interface wins)
V
7/29/25 - $v - Probs a buy, just not for me7/29/25 :: VROCKSTAR :: $V
Probs a buy, just not for me
- over 3% fcf yields, growing, consumer spending well
- over time (probably long duration) I think the biz model probably gets eroded, but also mgmt has done a nice job evolving, perhaps they keep up with the times etc.
- don't think anything is broken here
- all else equal a nice barometer for the consumer names in my portfolio (deck, lulu)
- i'd guess stock is higher on this print
- just have too many other things going on to play this $666 bn EV
V

Intel looks to want $13Intel looks to be waiting below $24 resistance for $13 support. I wouldn't short it at it's current price, but I would be patient and wait for $13 if you're looking to buy. Good luck!

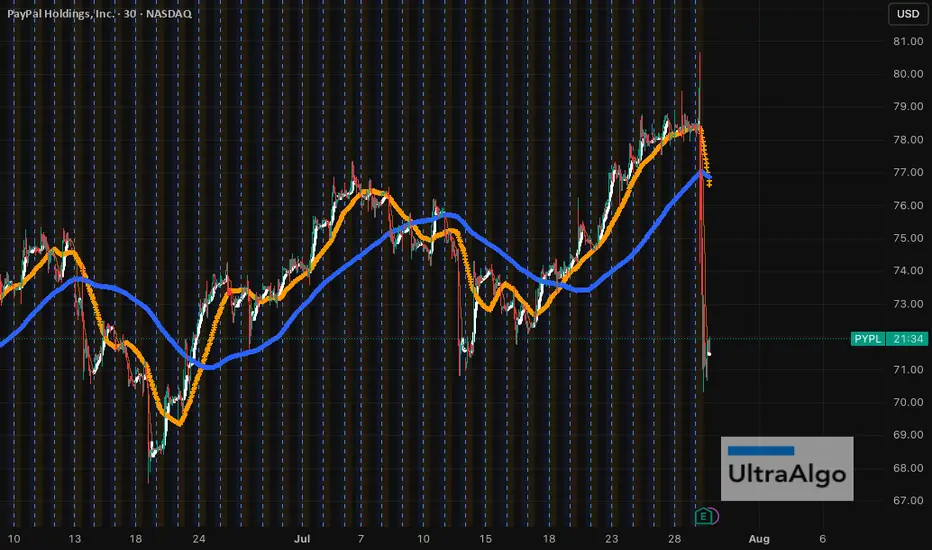
$PYPL - nice value gap just formed. Any takers?NASDAQ:PYPL smashed through the $75 resistance a week ago, signaling strong bullish momentum. Holding above the 50 SMA, the stock is poised for further gains. Then earlier 10% dip from mixed signals. UltraAlgo flagged it early, giving traders a heads-up of a potential Buy signal in the making. Charting tomorrow’s giants with UltraAlgo.
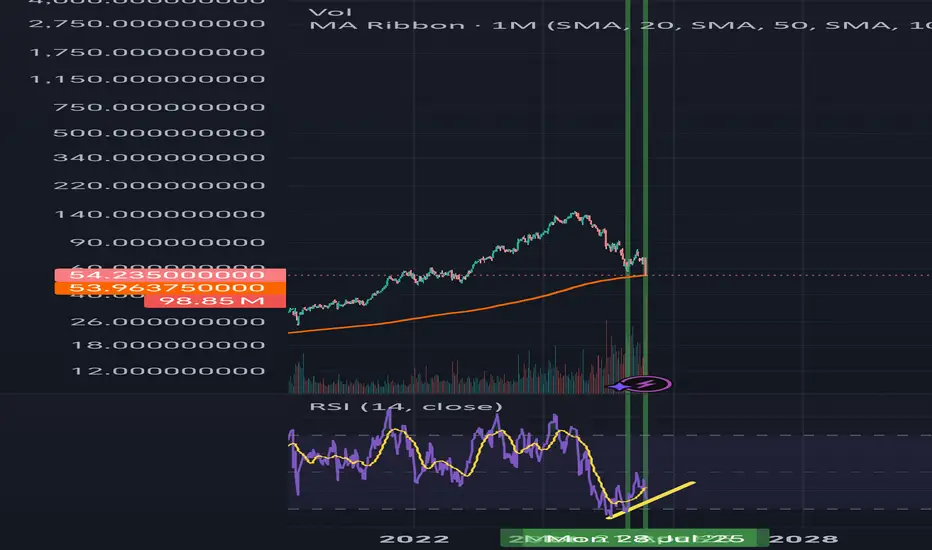
NVO-All InNVO currently at the all time historical 100 monthly SMA trendline, with Weekly bullish divergent on the RSI
This is a rare price structure, with fundamentally great risk to reward. Expecting a trend reversal soon.
Pray this will played out as planned.
😬🙏
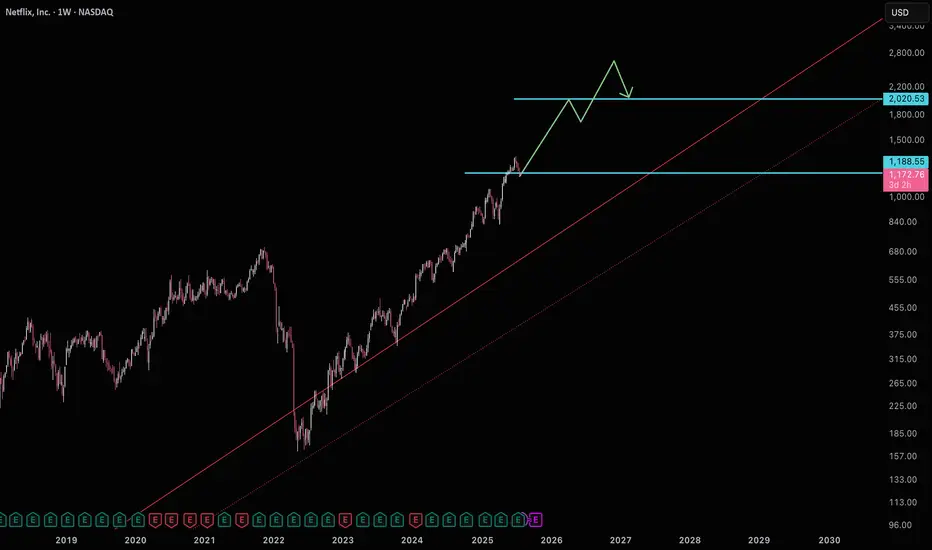
Netflix building support for $2000Netflix is currently sitting on support getting ready for a move to $2000.
Good luck!
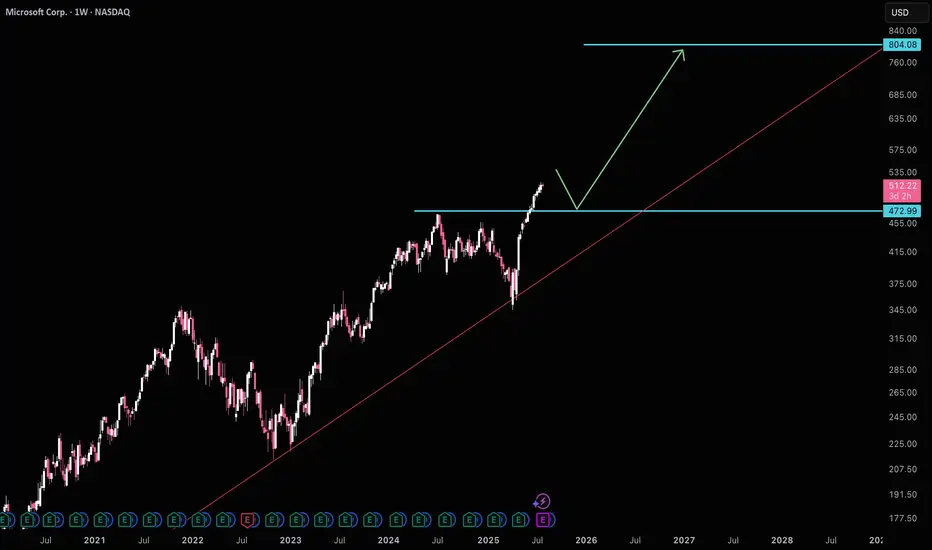
Mircrosoft wants to pullback to $470MSFT is likely to test $470 support before making it's move to $800. Another thing to be weary about is ratio MSFT/AAPL is at historical avg highs, which usually signals a bias towards AAPL. Waiting for $470 is a good idea before getting long again.
Good luck!
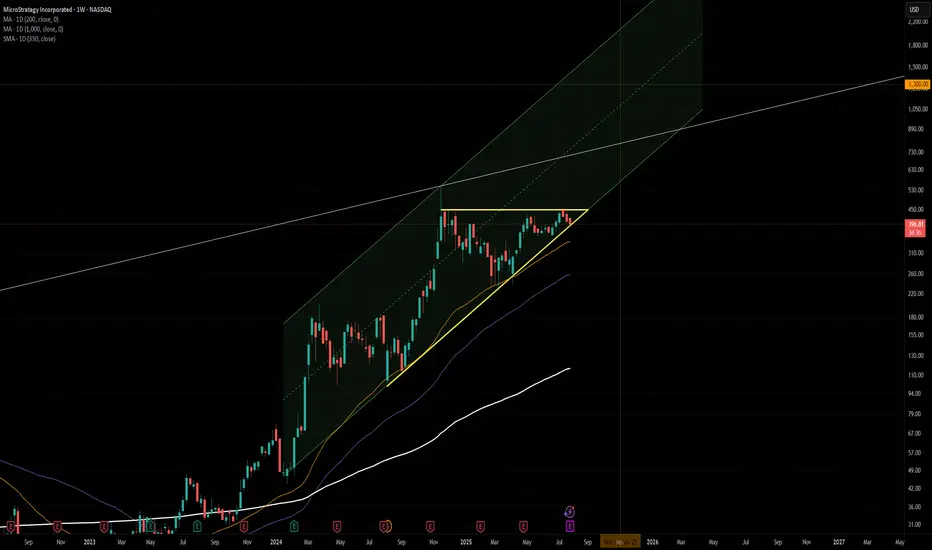
$MSTR Weekly Ascending TriangleMicroStrategy has been consolidating within a textbook ascending triangle pattern, with a clear resistance around $520 and rising higher lows forming solid support. Price action remains inside a strong bullish channel, hugging the 50-week MA and riding above the 200/350 MAs.
A breakout above $520 could trigger a strong continuation toward the upper bounds of the channel, with potential long-term targets around $1300 if momentum aligns with Bitcoin strength.
Watching for volume confirmation and weekly close above resistance for validation. Breakdown below the yellow trendline would invalidate the setup.
VST | Long | Trend Continuation with Correction Setup (Aug 2025)VST | Long | Trend Continuation with Correction Setup (Aug 2025)
1️⃣ Quick Insight: Vistra Corp. has been in a strong uptrend, making new highs. We are now looking for a healthy correction to position for continuation, as "the trend is your friend."
2️⃣ Trade Parameters:
Bias: Long
Entry: $151 (waiting for a corrective pullback)
Stop Loss: $128
Take Profits:
TP1: $167
TP2: $197
TP3: $205
Extended Target: $206+ if momentum sustains through the trend channel
3️⃣ Key Notes:
Vistra is a leading U.S. integrated electricity and power generation company with ~41,000 MW of generation capacity. The stock has surged over 175% in the past year, currently near its 52‑week high of $207. Analysts’ 12‑month consensus price target is $185, though recent developments like the PJM capacity auction results and Perry nuclear plant extension could fuel more upside.
The company is heavily investing in renewables and storage ($700M+ in 2025), growing nuclear capacity, and expanding credit facilities. Despite its high P/E (~30× vs sector avg. 12–13×), its strong ROE (>80%), buybacks, and utility-scale investments support long-term upside.
4️⃣ What to Watch:
Q2 2025 earnings on Aug 7, 2025 for forward guidance
Progress in solar, battery storage, and nuclear expansions
Market reaction to any correction or consolidation near highs
Macro utility sector sentiment and commodity price trends
📊 Outlook: The near-term consensus suggests a pullback toward $185 is possible, but the longer-term uptrend remains intact, especially if growth momentum continues.
Please LIKE 👍, FOLLOW ✅, SHARE 🙌 and COMMENT ✍ if you enjoy this idea! Also share your ideas and charts in the comments section below! This is best way to keep it relevant, support us, keep the content here free and allow the idea to reach as many people as possible.
Disclaimer: This is not financial advice. Always do your own research.

Watching the Retest — $23.5 Target Still ValidStructure remains intact.
Still tracking price action toward the $23.5 zone.
Currently in a retest — stay tuned.
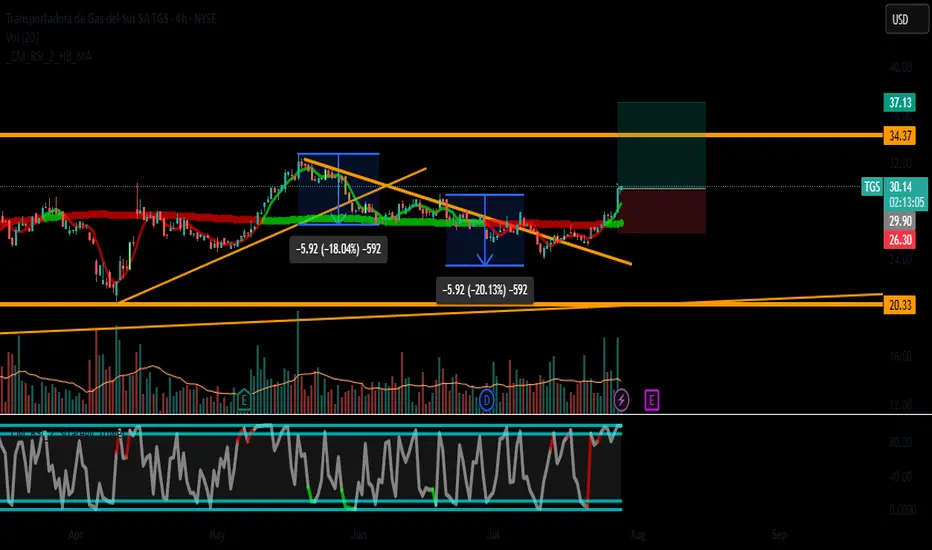
TGS (TGS Ltd.) – Breakout Play with Strong Upside Potential🚀 Trade Idea: TGS (TGS Ltd.) – Breakout Play with Strong Upside Potential
📈 Entry: $29.90 (Breakout above resistance)
🛑 Stop Loss: $26.30 (Below key support & SMA-50)
🎯 Take Profit: $37.13 (~24% upside, near next resistance zone)
📊 Risk-Reward Ratio: 1:3 (Favorable setup)
🔍 Analysis Breakdown
📊 Technical Setup
Trend: Daily trend is consolidating, but 4H/1H show bullish momentum.
Key Levels:
Support: $26.30 (SMA-50 & recent swing low).
Resistance: $30 (psychological level, previous highs).
Indicators:
MACD (4H): Bullish crossover, supporting upside.
RSI (Daily): ~65 (neutral, no overbought signal yet).
Volume: Increasing on upward moves (confirms interest).
💰 Fundamental Backing
Strong Revenue & Earnings Growth (See previous analysis).
Undervalued Metrics (P/B, P/S) suggest room for expansion.
Low Debt (Score: 10/10) reduces downside risk.
🎯 Why This Trade?
✅ Breakout Play: A close above $30 confirms bullish continuation.
✅ Strong Fundamentals: Earnings growth supports higher valuation.
✅ Low-Risk Entry: Tight stop below support.
⚠️ Key Risks:
Failure to hold $30 could lead to retest of $26.30.
Market-wide pullback could delay momentum.
📉 Trade Management
Add-on: Consider scaling in above $31.50 (confirmation of trend).
Trailing Stop: Move SL to $28.50 after hitting $33.
📌 Final Thought: TGS has strong upside potential if it breaks $30. The 1:3 R/R makes this a high-conviction trade.
👨💻 Let me know your thoughts in the comments!
#TGS #Breakout #Stocks #Trading #Investing
Disclaimer: Not financial advice. Do your own research before trading.
SLA Moderate Bullish Setup – Weekly Play for 08/01 Expiry
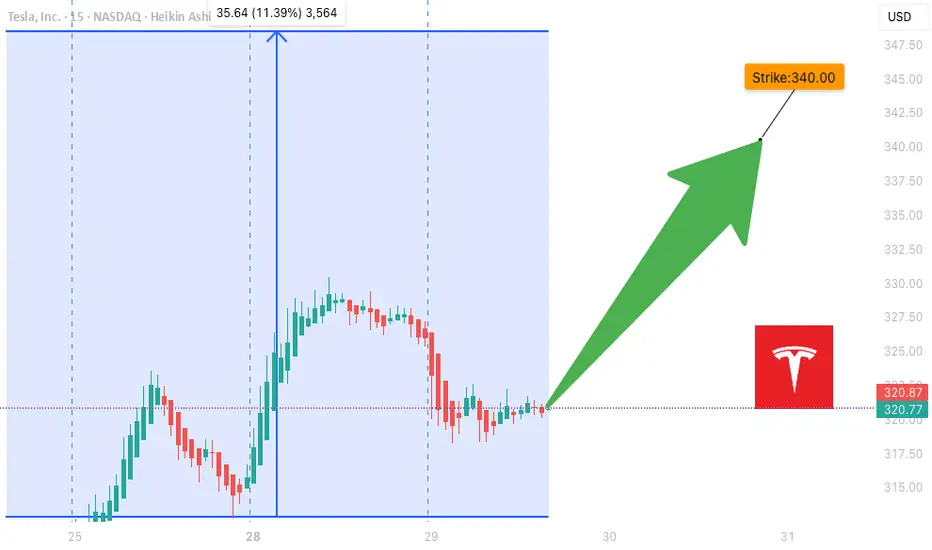
## ⚡ TSLA Moderate Bullish Setup – Weekly Play for 08/01 Expiry
🎯 *"Volume confirms it. RSI supports it. Time to strike—or stand by."*
---
### 🔍 Market Intelligence Snapshot:
📊 **Consensus**: Moderately Bullish
📈 **Weekly RSI**: Rising
📉 **Daily RSI**: Still Neutral (momentum building)
📉 **VIX**: Low → Great environment for call buying
📦 **Volume**: Strong institutional activity across models
---
### ✅ Recommended Trade Setup:
**TSLA \$340 CALL (Exp: Aug 1)**
💰 *Entry*: \~\$0.88
📈 *Target*: \$1.38
🛑 *Stop*: \$0.35
📆 *DTE*: 3 Days
🎯 *Entry*: Market Open
⚖️ *Confidence*: 65%
---
### 🔧 Model Blended Strategy Notes:
* Meta & Anthropic: Suggest ATM/ITM (\$327.50–\$330) → safer, higher cost
* Google & xAI: Prefer \$340–\$342.50 for a better risk/reward
* DeepSeek: Targets \$320 but with heavier premium
🧠 *Takeaway*: \$340 offers a balanced shot — affordable, but still responsive to upside flow.
---
### ⚠️ Risk Notes:
* ⏳ Time Decay → Quick exits = better outcomes
* 📰 External news or earnings reactions = watch for sudden volatility
* 🎯 Position size = keep light due to only 3 DTE
---
### 📊 TRADE SNAPSHOT (JSON):
```json
{
"instrument": "TSLA",
"direction": "call",
"strike": 340.0,
"expiry": "2025-08-01",
"confidence": 0.65,
"profit_target": 1.38,
"stop_loss": 0.35,
"size": 1,
"entry_price": 0.88,
"entry_timing": "open",
"signal_publish_time": "2025-07-29 10:16:14 UTC-04:00"
}
```
---
### 🧠 Quick Captions for Social:
* “TSLA bulls waking up? \$340C looks lit for the week 📈🔥”
* “Call volume surging. RSI rising. Low VIX. This \ NASDAQ:TSLA 340C might run 💥”
* “Risk-managed breakout shot — in and out fast 🎯”
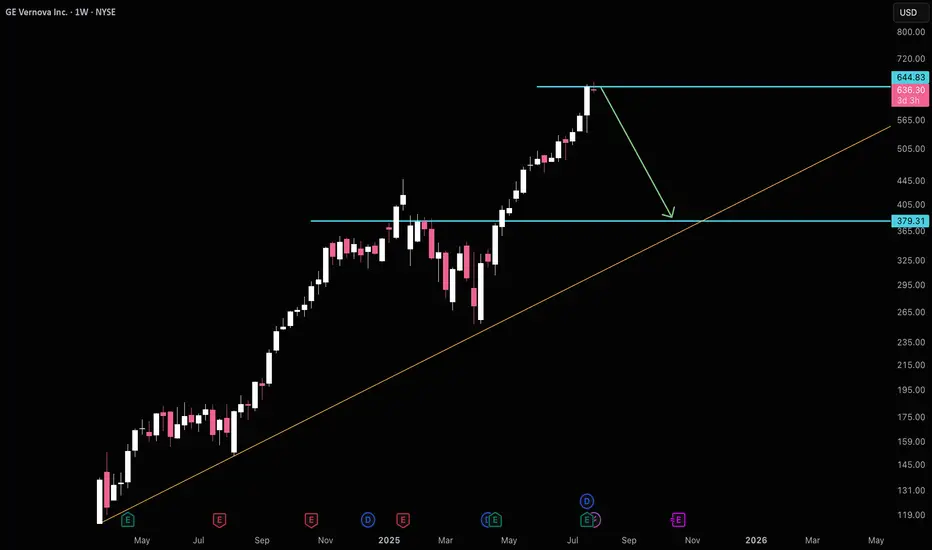
GEV High Risk $380GEV has a high risk of $380 at the moment. Obviously don't bet against the trend, especially while the S&P still has a lot of room to run, but it's an easy area to open some insurance for a potential fall to $380.
Good luck!
NVDA Bullish Weekly Trade Setup** – 2025-07-29
📈 **NVDA Bullish Weekly Trade Setup** – 2025-07-29
🚀 *"Momentum meets money flow!"*
### 🔍 Market Snapshot:
* 💥 **Call/Put Ratio**: 2.47 → Bullish sentiment confirmed
* 🧠 **RSI**: Rising on Daily & Weekly → Momentum building
* 🔕 **Low VIX**: Favors call strategies (cheap premiums)
* ⚠️ **Caution**: Light volume = soft institutional backing
---
### 🔧 Recommended Options Trade:
**🟢 NVDA \$182.50 CALL (Exp: Aug 1)**
💰 *Entry*: \~\$0.53 (Mid)
📈 *Profit Target*: \$0.69 – \$1.06
🛑 *Stop Loss*: \$0.32
📆 *DTE*: 3 days
🔄 *Entry Timing*: Market Open
✅ *Confidence*: 75%
🔥 *Theta & Gamma Risk*: Elevated — manage position size!
---
### 💡 Why This Trade?
✅ RSI Strength across timeframes
✅ Flow favors upside
✅ Cheap premium in a low-volatility regime
🟡 Just watch that volume…
---
📊 **TRADE SNAPSHOT (JSON):**
```json
{
"instrument": "NVDA",
"direction": "call",
"strike": 182.50,
"expiry": "2025-08-01",
"confidence": 0.75,
"profit_target": 1.06,
"stop_loss": 0.32,
"size": 10,
"entry_price": 0.53,
"entry_timing": "open",
"signal_publish_time": "2025-07-29 11:59:10 UTC-04:00"
}
```
---
📣 **Taglines for Sharing:**
* "NVDA setup is 🔥—momentum + flow = GO!"
* "Gamma risk is real—but so is this profit window 💸"
* "Short-term sprint or fade? This call has range."
