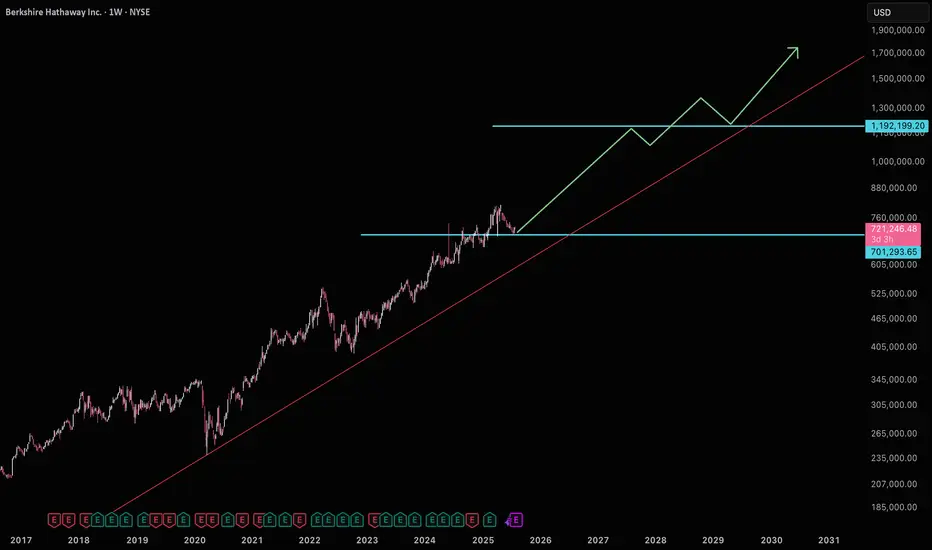
BRK.A on it's way to $1.2mm sitting on strong supportBerkshire is not far off it's long term trend sitting near major support. It's poised to start it's move to $1.2mm where next resistance is. Good luck!
OceanPal Inc.Stock on triggering level now .
Target price above 3$
Positive Powerful wave on its way now any moment 💯
Highly recommended for Buying now as much as you can 🔊 👍

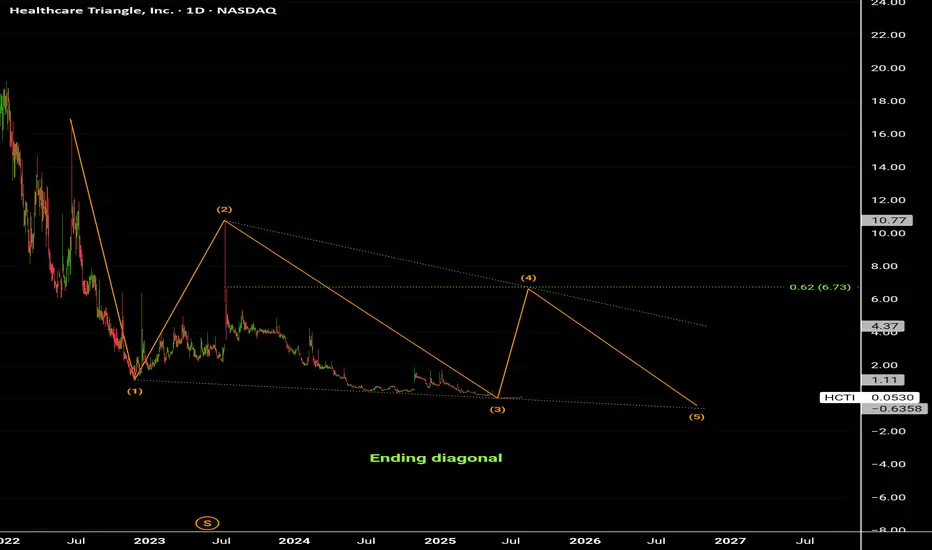
Healthcare Triangle Inc.Stock on Triggering mode . And Target price 6.73$ ( D ) .
At that level a distribution level will reach .
Highly recommended for Buying Now , as much as you can 🔊 👍
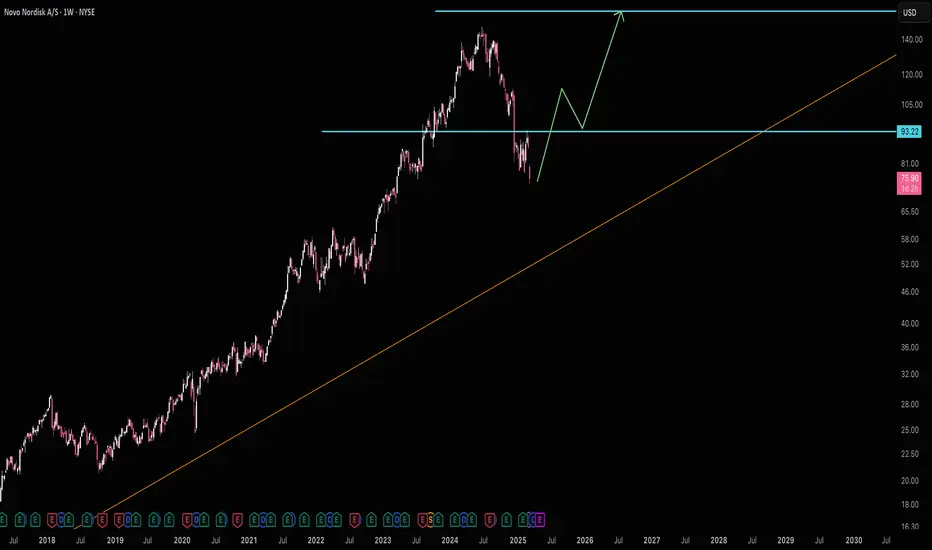
Novo Nordisk on Fire Sale!This megaphone pattern below support makes me think this 20pe ratio stock is looking to reclaim support and run back up to $158.
Good luck!
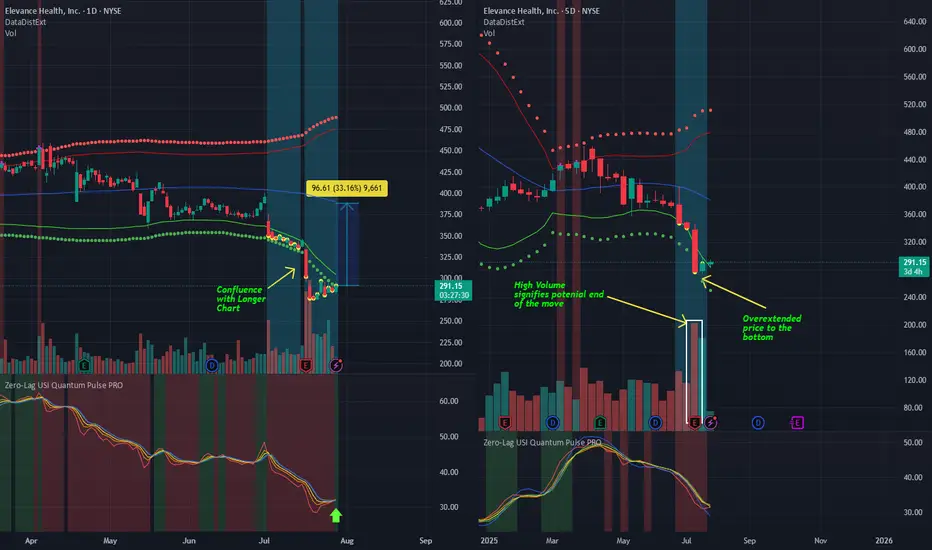
Potential 33% gain in ELVELV has a potential for a reversal for potentially 33% gain.
Using the Data Distribution with Extreme Clusters custom indicator, we can see that the stock is overextended on both the 5D chart (longer term) and 1D (shorter term) chart.
The last weekly bar ended up on a very high volume. Looking at the trends, one thing that is often noticeable, is that moves end and begin on large volume. Since it is down 40% off its highs, coupled with large volume, there is a possibility that the stock will reverse.
Zero-Lag USI on 1D chart is showing a buy signal as the background changed to green, while Zero-Lag USI on 5D chart is showing a black background, which means that there is a possibility that momentum of the stock may change.
Niagen Breaks Out: Eyes on $15–17 as Momentum TargetsNiagen Bioscience ( NASDAQ:NAGE ) is in vertical price discovery mode, pushing into new highs with strong trend momentum, but with RSI at 78.66 and a flattening MACD histogram, it’s nearing a classic short-term exhaustion zone
Technical Breakdown
1. Price Action – Parabolic Advance
Price is climbing in a near-vertical channel from the $5–6 range in March to now $12.95 — a 2x+ move in just a few months. No clear resistance above = price discovery, but these steep climbs often invite sharp mean reversion when momentum fades. No signs of topping yet, but late buyers risk being exit liquidity if volume dries up.
2. RSI – Deep Overbought
RSI is at 78.66, right near the extreme threshold (>80) where pullbacks are common. Note the last RSI spike above 80 in April led to a sharp correction. If RSI rolls while price makes new highs, that’s bearish divergence risk — an early signal of topping.
3. MACD – Still Positive, But Slowing
MACD lines are bullishly stacked, but the histogram is flattening — a signal that momentum is stalling. A bearish MACD crossover here would confirm that this rally leg is losing energy.
4. Volume – Watch Closely
Volume data is light on this chart, but recent candles don’t show a volume climax — suggesting this may not be euphoric yet, but it’s close. One high-volume reversal candle near the top could flip sentiment fast.
Fibonacci Extension Setup
We'll anchor the extension to the March 2025 low and the recent pre-breakout high, using the most relevant and aggressive up-leg:
Swing low: ~$5.00 (March 2025)
Swing high: ~$11.50 (May 2025)
Pullback low: ~$9.00 (early May dip before this new breakout)
Extension Targets
1.0x $11.50 Already cleared (prior high)
1.272 $13.25–13.50 Short-term upside target, within reach
1.618 $15.00–15.25 Primary extension / high-conviction zone
2.0 $17.00 Stretch target in euphoric continuation
These levels line up well with psychological round numbers and the measured strength of the rally.
What Would Validate These Targets?
RSI stays above 65–70 (healthy overbought, not divergent)
MACD avoids bearish crossover and histogram turns back up
Breakout continuation above $13.25 with volume
What Would Invalidate?
Sharp rejection from $13.25 or $14 with divergence
RSI dropping below 65 while price stalls
Bearish MACD crossover + red candle volume spike

Cognyte Software is breaking outCognyte Software (CGNT) just cleanly broke out above long-standing resistance around $11, and the structure suggests it wants to start a new bullish leg higher.
Let’s break down where it might go, using a technically grounded roadmap:
Why This Move Looks Like the Start of a New Rally
1. Structure Shift
That $11 level was a ceiling going back multiple quarters. The breakout was impulsive and clean, with closing strength and solid volume. This suggests accumulation beneath resistance is now turning into trend expansion — classic phase 2 breakout in market structure.
2. MACD & RSI Still Supportive
MACD is still positive and has not crossed bearish, just flattening — typical of mid-trend pauses, not reversals. RSI at 76 is overbought, but not diverging, which means momentum is still valid. CGNT is acting like it wants to run, not roll.
Where Can It Go?
We'll project using:
A) Measured Move
Previous range (Feb–May): $8.00 → $11.00 = $3 range
Breakout above $11 → Target = $14.00
B) Fibonacci Extension (Breakout Leg)
Using swing low ($7.50) to pre-breakout high ($11.00):
1.618 Fib extension = ~$13.25
2.0 extension = ~$14.50
These targets align well with the measured move, giving us $13.25–14.50 as a logical upside zone if the trend holds.
C) Psychological & Round Numbers
$12.00 is the next short-term magnet
Then $13.50–14.00 as medium-term targets
What Invalidates the Move?
Breakdown below $10.80 (failed breakout = trap)
RSI divergence + MACD crossover
Weak follow-through volume
Godspeed.

EVER LongIf we get a pull back this is a pretty good risk reward, but it will probably break this range and head towards 33$
SL at 23.74

Soluna Holdings Inc.Stock nearly completed wave b of Expanding Flat correction.
Side C will start up soon 🔊
Target price above 9 $ .
Highly recommended for Buying 👌 and wait .

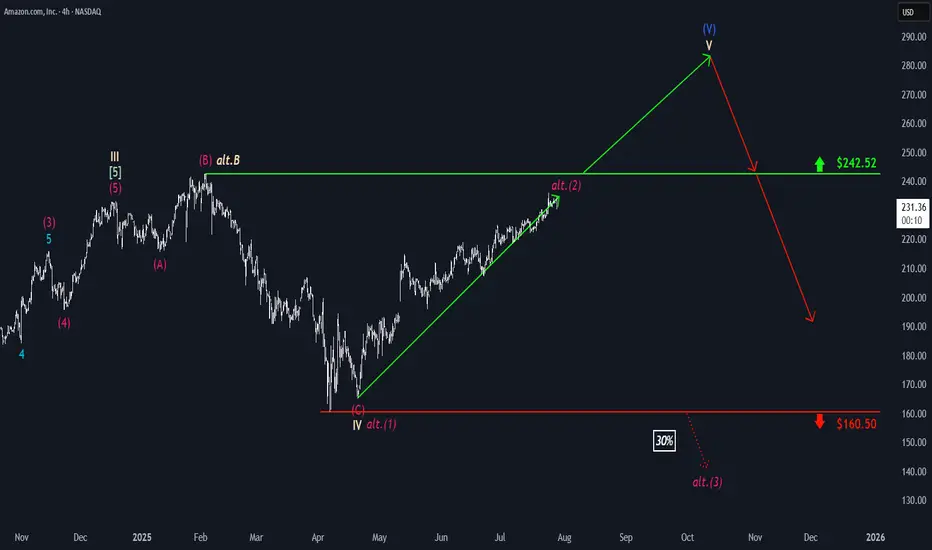
Amazon: Extending the Rally...Amazon maintaines its strong upward momentum. As this trend continues, the large blue wave (V) is expected to complete well above the resistance level at $242.52. However, an alternative scenario with a 30% probability remains on the table: in this case, the magenta corrective wave alt.(2) would peak below the $242.52 resistance, and a significant pullback below support at $160.50 would be anticipated afterward. In this scenario, the high of beige wave alt.B would have been set at $242.52, after which the stock would enter the broader downward movement of wave alt.C .
📈 Over 190 precise analyses, clear entry points, and defined Target Zones - that's what we do (for more: look to the right).
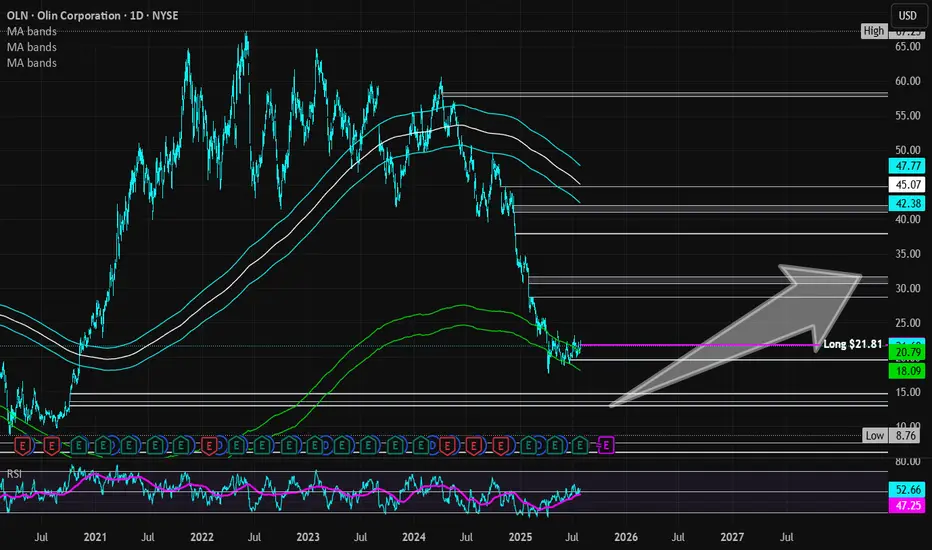
Olin Corporation | OLIN | Long at $21.81Olin Corp NYSE:OLN is currently trading within my "crash" simple moving average area (green lines on the chart). Historically, the price trades within this area for the company, consolidates, and then moves up. After today's earnings, which were relatively positive, the stock may gain some traction and move up. However, I am cautious a media-heightened economic downturn could send NYSE:OLN (a global manufacturer of chemical products and ammunition) to $13 to close the existing price gaps on the daily chart. Regardless, it's a strong company that has been trading on the US stock exchange since the mid-1970s - it's seen rough times before. While 2025 is likely to be a tough year, future earnings projections predict robust earnings growth. Time will tell...
Thus, at $21.81, NYSE:OLN is in a personal buy-zone with noted caution if there is an economic downturn down to $13 a share. The price gap around $19 may also be closed in the near-term.
Targets into 2028:
$28.00 (+28.4%)
$31.50 (+44.4%)

Chapter 3: The Big Gap Fill (RGTI) Chapter 3: The Big Gap Fill
After the luminous victory of the Alienoid Bulls in Chapter 1, the quantum lattice began to warp. Unbeknownst to them, the Mech Bears had not been defeated—only waiting, recalibrating, and evolving.
Hidden in the deep recesses of the 7D stackspace, a new war protocol had been activated: Project GAP-FILL.
Forged from the remnants of collapsed timelines and corrupted trading algorithms, the Mech Bears returned with upgraded plasma scythes, vortex cannons, and distortion shields—engineered specifically to slice through fractal bullish momentum.
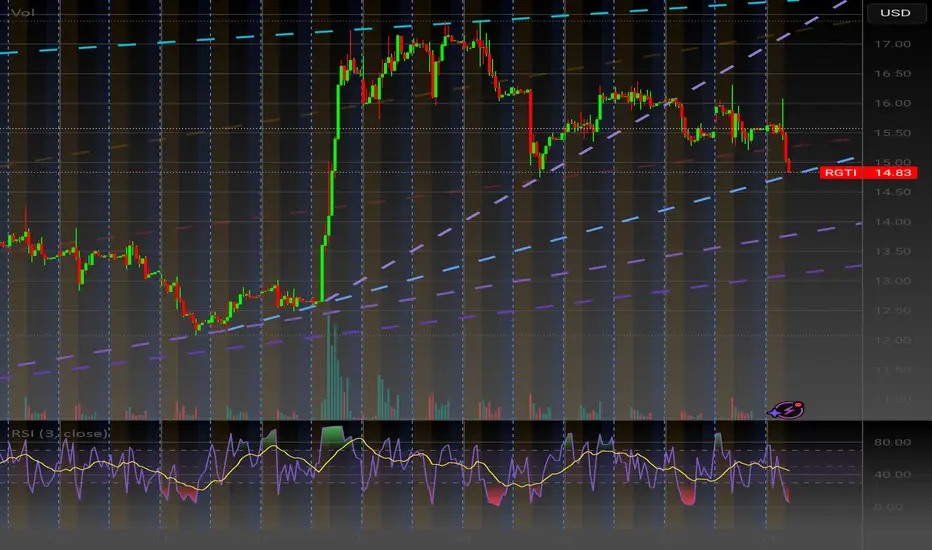
Their mission: rupture the vertical trajectory of the Bulls by targeting the exposed gap at $14.87 .
And they struck with precision.
The plasma walls cracked. Alienoid defenders were torn apart, pixel by pixel. Charts trembled. RSI indicators bled below the midline. Volume spikes echoed like sirens through algorithmic space.
The Bulls fought valiantly, but their entangled rally code had become predictable. Their once-pristine yellow pathways had begun to fade under the purple-fanged teeth of the Bears' synthetic sell walls.
$14.87 was now no longer just a price—it was a battlefield scar.
It pulsed in red, flickering like a dying star, as algorithms calculated:
→ Bounce? An emergency quantum surge from sector Theta-12 might catch the fall.
→ Or further dip? Toward the gravitational pull at $13.80... or even deeper, toward the haunted zone beneath $12.60.
Whispers from the quantum feed rippled across timelines:
“If the Bulls can't re-stabilize above $14.87, the mech horde will breach the next support sector.”
The volume candles crackled, RSI skidded down through 30, and the future became uncertain.
The Alienoid Bulls retreated to regroup, wounded but not broken, preparing for what many called…
The Great Reversal War. NASDAQ:RGTI
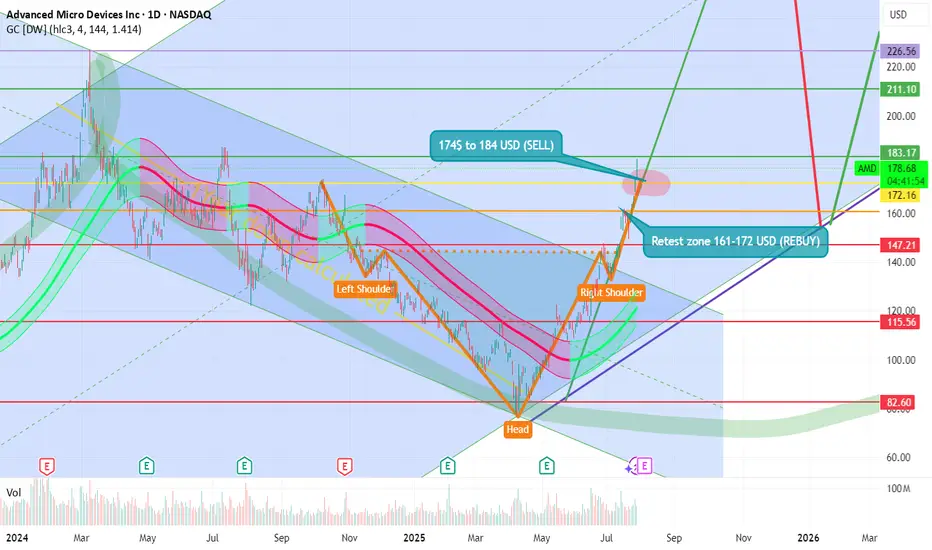
AMD we have made it at 170 USD guys! TSXGANG! 📊 AMD Stock Technical Analysis
🧠 Head and Shoulders Pattern
- This chart shows a classic head and shoulders formation:
- Left Shoulder: First peak around ~$172
- Head: Highest peak near ~$183
- Right Shoulder: Second peak returning to ~$178
🔎 This pattern often signals a potential reversal in an uptrend—investors might expect selling pressure ahead if confirmed.
📉 Sell Zone 📍
- 💸 Highlighted zone: $174–$184 USD
- 🚨 Considered an overbought region—ideal for profit-taking or short positions
Current price: $178.82 USD 📌 (+$5.16 / +2.97%)
This price lands right in the sell zone, suggesting caution as upside might be limited short-term.
🔄 Retest Zone (Support) 📍
- 🛡️ Marked between $161–$172 USD
- 🤝 A potential buy zone where price could stabilize or rebound
If AMD pulls back, this is where buyers might re-enter the market for long positions.
🧪 Trend Indicators & Sentiment
- 📈 Recent bullish move (+2.97%) shows strength—but could also be testing resistance
- 🔁 Watch for confirmation of either a breakout above $184 or a pullback to retest support
- 🧭 Overall sentiment looks cautiously optimistic but technically fragile near the upper resistance
🧠 Final Thoughts 💬
This chart analysis suggests AMD may be approaching a turning point. Traders should keep an eye on volume, macro tech trends, and market reactions in the coming sessions.
The information and publications are not meant to be, and do not constitute, financial, investment, trading, or other types of advice or recommendations.
Thank you!
Subcribe to TSXGanG! 🧠🎯
NVO-Bought more hereDoubled down right here,
Testing the all time support trendline 100 monthly SMA.

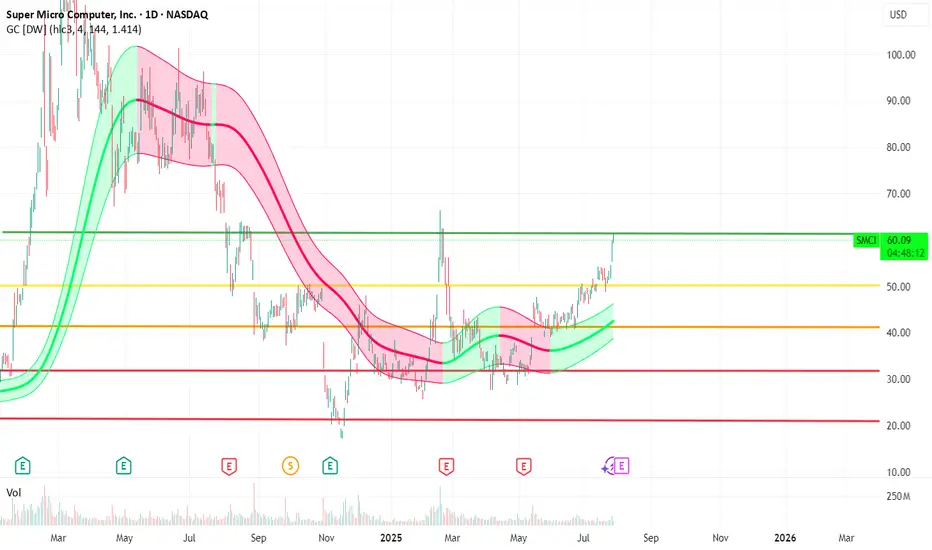
SMCI is at 60$ USD WE have made it. TXSGanG- 📈 The current price is around $60.11, so it’s very close to the trigger.
- 🧭 Technical indicators (based on TradingView): Moving averages and oscillators are neutral to slightly bullish.
🎯 Sell Zone: $65 to $73 USD
- 🟡 $65: A middle-ground target for those looking to optimize without too much risk.
- 🔴 $73: Ambitious target, marked on your chart with a green arrow. Ideal for more patient investors or those confident in the trend.
🔍 Fundamental Context
- 📉 The stock has seen a sharp correction in recent months, but the current rebound could mark a reversal if confirmed by volume.
🧠 Suggested Strategy
| Price Level | Recommended Action | Emoji |
| $50–60 | Gradual buying / Swing trade | 🛒 |
| $60–65 | Partial profit-taking | 💰 |
| $65–73 | Full exit or trailing stop | 🚀🔚 |
The information and publications are not meant to be, and do not constitute, financial, investment, trading, or other types of advice or recommendations.
Thank you!
Subcribe to TSXGanG! 🧠🎯
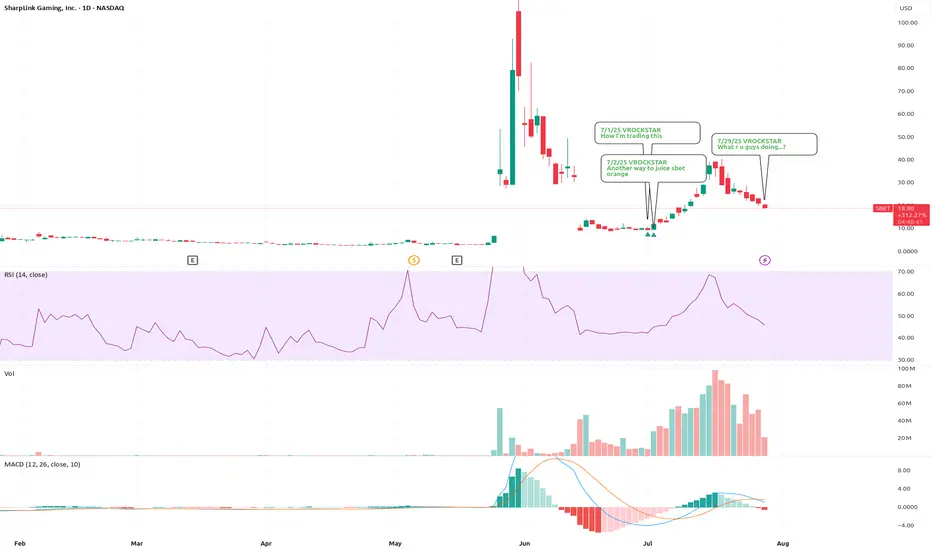
7/29/25 - $sbet - What r u guys doing...?7/29/25 :: VROCKSTAR :: NASDAQ:SBET
What r u guys doing...?
- feels like i'm always in early, out early
- but here we are, buying AMEX:BMNR in the 30s post market, halving that in the run this AM... adding it back
- you all realize that NASDAQ:SBET 's mnav is pretty close to 1 right?
- i just don't get it, perhaps it's all these call options, negative gamma
- "yes" eth is expensive, could pullback got it
- but as a treasury vehicle, esp of this size, you'll likely see 2...3...4x mnav at end of cycle as borrow are in MSD rates and yield here ("ROE") in bank terms based on underlying CAGR is minimally DDs... but realistically in the 20s...30s...40s... e.g. justifying this 2+ x mnav
- so you do you
- but i'm back and buying all the way back to $15 and below where in my estimation you'd be buying eth at a discount? lol
V
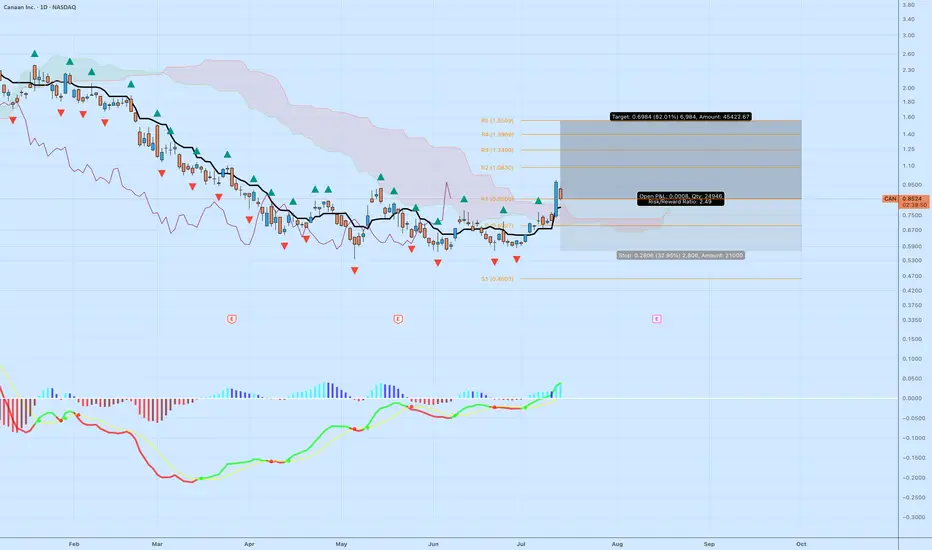
CAN Long: Bullish Reversal Setup with Upside Potential to 1.55Canaan Inc. ( NASDAQ:CAN ), a key player in Bitcoin mining hardware, has endured a steep downtrend throughout 2025, sliding from peaks near 3.50 down to recent troughs around 0.80 amid crypto sector headwinds. However, the chart is flashing signs of exhaustion and a potential bullish reversal, with price stabilizing and momentum indicators turning positive.
Technical Analysis:
Price Action and Structure: After a series of lower highs and lows, the stock has bounced from support near 0.80, with the latest close at 0.8503 showing buyer interest. Price is pushing against a descending trendline (red down-arrows) and exiting a consolidation cloud (likely Ichimoku Kumo, shaded purple), which could transition from resistance to support on a sustained breakout.
Key Levels:
Support: Immediate floor at recent lows (~0.80), with deeper support at S1 (0.4603) if selling resumes.
Resistances: Layered overhead including R1 (1.0666), R2 (1.0830), R3 (1.2409), R4 (1.3969), and R5 (1.5669). Targeting the higher end near 1.55 aligns with extension toward R5 for a stronger move.
Indicators:
The lower panel oscillator (resembling MACD with red/green bars and lines in red, green, yellow) displays a bullish crossover: green line above red, histogram shifting from red (bearish) to blue/green (bullish). This suggests momentum divergence and potential for upside continuation.
Volume spikes on recent upticks reinforce buying pressure.
Trade Setup:
Entry: Enter long at current levels around 0.85, or wait for a close above cloud resistance (~0.90) for confirmation.
Target: Take profit at 1.55 (near R5 confluence), offering approximately 82% upside from entry based on chart projections and historical patterns.
Stop Loss: Place below key support at 0.57 to account for volatility, providing room for minor pullbacks while protecting capital.
Risk/Reward Ratio: About 2.5:1 (reward of 0.70 vs. risk of 0.28 per share), a solid setup for the potential reversal in this high-volatility stock. Size positions to risk 1-2% of total capital max.
Invalidation: Exit if price breaks decisively below 0.57, signaling downtrend resumption toward lower supports.
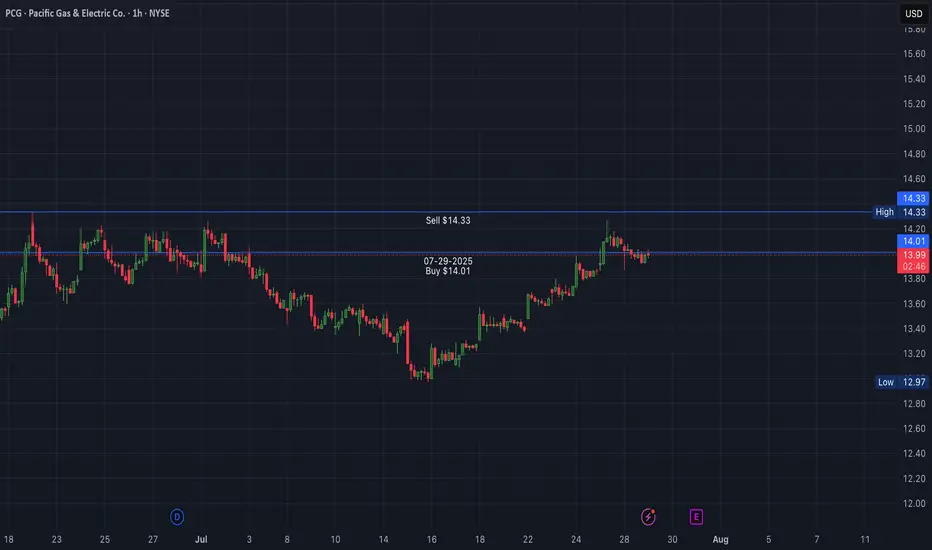
07-29-2025 BUY PCG PCG earnings in 2 days before the market open. Analysts expect EPS of $0.32
BUY $14.01
SELL $14.33
ASK $0.32
2%
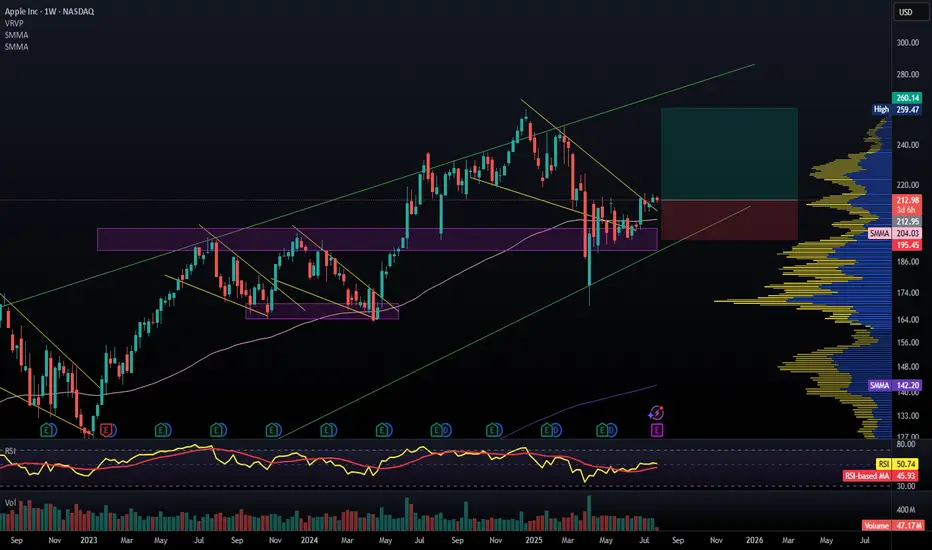
Apple repeating pattern to ATHA pattern I've used multiple times with Apple, looks like the same setup as April 2024 earnings.
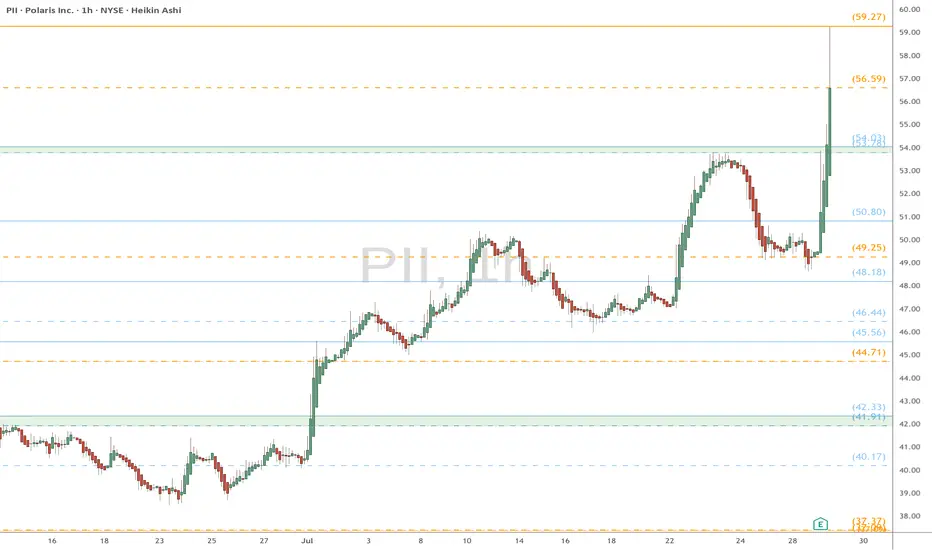
PII eyes on $59.27: Golden Genesis may give a Dip-to-Fib entryPII earnings report spiked it into Golden Genesis at $59.27
Looking for a dip to enter on the strength of earnings.
Golden Covid below at $56.59 or green zone around $54
BMNR - Gaps to fill before lift offAMEX:BMNR is in competition to become the single largest ETH treasury globally with a slightly different twist - staking for a 2-5% annual return + performance.
Just like NASDAQ:SBET , AMEX:BMNR are diluting their stock to raise capital to additional purchases. This was announced a couple of weeks ago and has not yet concluded.
I expect the gaps to be filled before it really takes off.
Ideally the first gap completes at $7.92 which would be a perfect 61.8 fib retracement (EWT Target), however, if we go this low, I naturally would expect the lower gap to be taken out or at least entered.
Lower gap: $5.10 to $6.13
Higher gap: $7.92 to $12.30
If this plays out, it will be a generational buying opportunity. Like buying NASDAQ:MSTR at $11.
Cathie Wood ( CBOE:ARKK ) also made large purchases of this stock via several of her ETF's. If we follow her trend of poor buying decisions from a technical perspective, then we can certainly expect a large discount on this stock. History has a tenancy of repeating itself.
Not financial advice.
