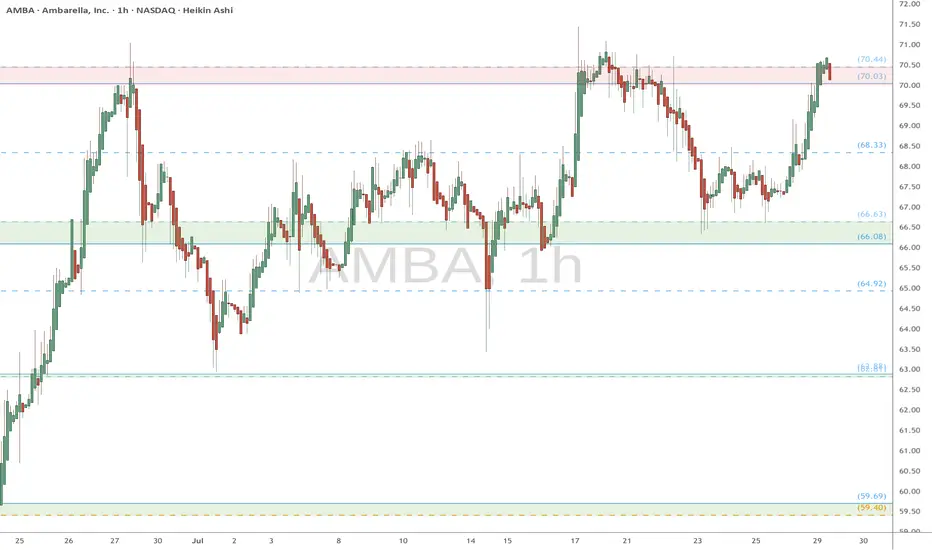
AMBA watch $70.03-70.44: Proven resistance holding up new highs AMBA has been trying to float upwards with the market tide.
Currently struggling against a proven resistance $70.03-70.44
Looking for a Break-n-Retest ideally or Dip-to-Fib for entries.
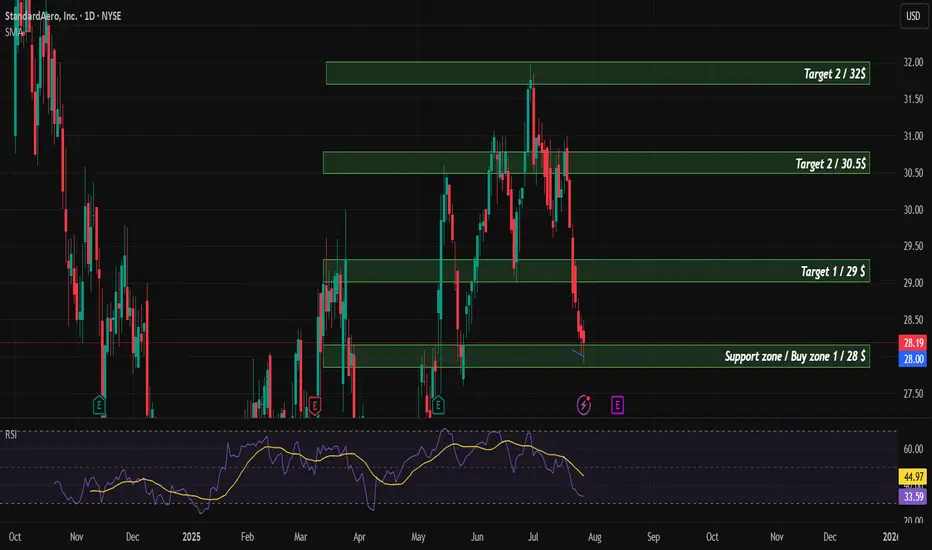
SARO Buy/LongTechnical analysis of the company. According to financial indicators, the company is currently undervalued and is supported by SMA200. The target price for the company is $35.
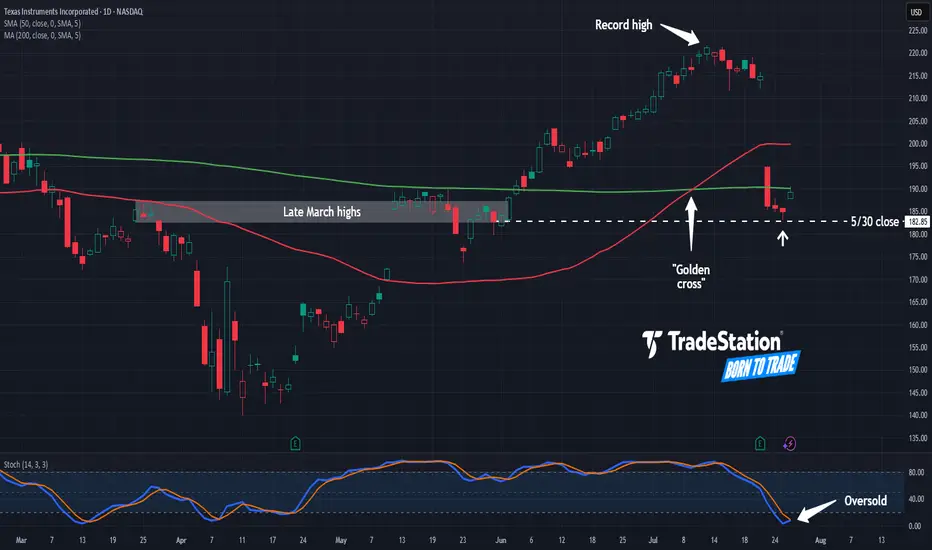
Texas Instruments May Be OversoldTexas Instruments fell sharply last week, and now it may be oversold.
The first pattern on today’s chart is the price zone on either side of $185. It’s near the peaks in late March and a consolidation zone in late May. (The May 30 weekly close is in a similar area.)
TXN held near that level last week, which may confirm old resistance has evolved into new support.
Next, stochastics are turning up from an oversold condition.
Third, the 50-day simple moving average (SMA) had a “golden cross” above the 200-day SMA earlier this month. That could indicate the semiconductor company’s longer-term trend has gotten more bullish.
TradeStation has, for decades, advanced the trading industry, providing access to stocks, options and futures. If you're born to trade, we could be for you. See our Overview for more.
Past performance, whether actual or indicated by historical tests of strategies, is no guarantee of future performance or success. There is a possibility that you may sustain a loss equal to or greater than your entire investment regardless of which asset class you trade (equities, options or futures); therefore, you should not invest or risk money that you cannot afford to lose. Online trading is not suitable for all investors. View the document titled Characteristics and Risks of Standardized Options at www.TradeStation.com . Before trading any asset class, customers must read the relevant risk disclosure statements on www.TradeStation.com . System access and trade placement and execution may be delayed or fail due to market volatility and volume, quote delays, system and software errors, Internet traffic, outages and other factors.
Securities and futures trading is offered to self-directed customers by TradeStation Securities, Inc., a broker-dealer registered with the Securities and Exchange Commission and a futures commission merchant licensed with the Commodity Futures Trading Commission). TradeStation Securities is a member of the Financial Industry Regulatory Authority, the National Futures Association, and a number of exchanges.
TradeStation Securities, Inc. and TradeStation Technologies, Inc. are each wholly owned subsidiaries of TradeStation Group, Inc., both operating, and providing products and services, under the TradeStation brand and trademark. When applying for, or purchasing, accounts, subscriptions, products and services, it is important that you know which company you will be dealing with. Visit www.TradeStation.com for further important information explaining what this means.
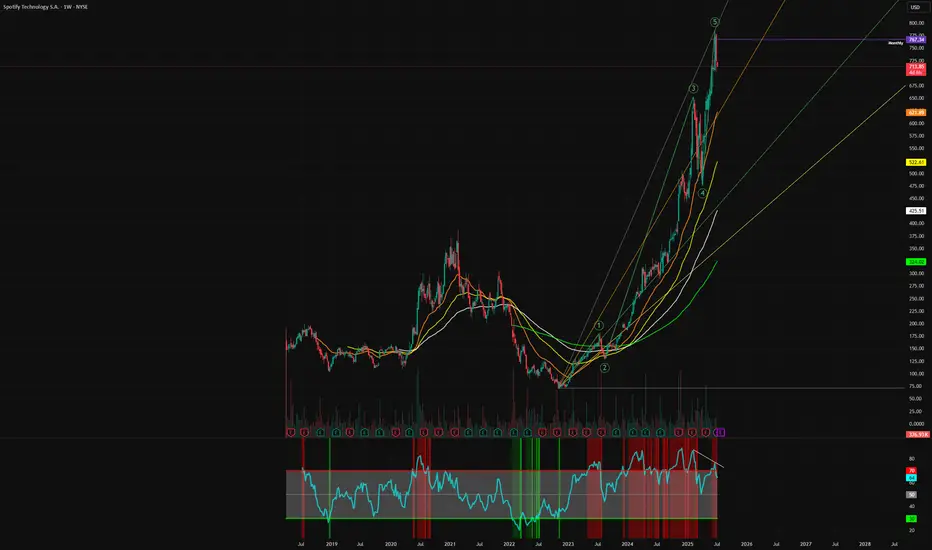
ShortifyI don't post all my trade ideas ahead of time but I will share another short position that I executed before posting, this time in Spotify.
Short entered at $770, stop lost at $790.
Added to my position when we lost the monthly level of support.
The end of the 5 Wave Supercycle.
Trailing stop loss, I don't like shorting solid companies but this one got overextended.
I am short several positions, including Palantir, DuoLingo and commodities like cocoa.
Not financial advice, do what's best for you
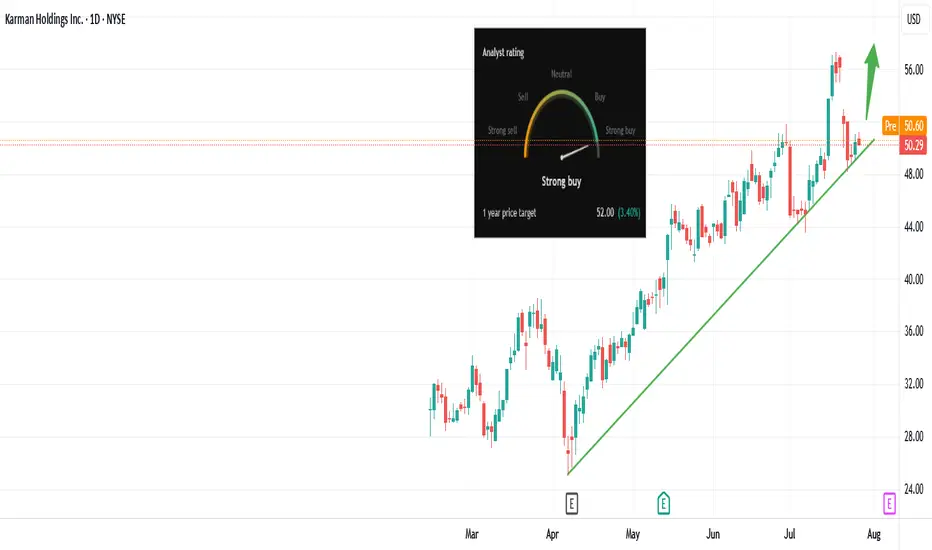
Bullish Momentum Building: KARMAN Eyes Powerful Upside Break!Trade Summary
Setup: Bullish trendline support + “Strong Buy” analyst rating + Eyeing breakout above recent high
Entry: Buy on breakout above $52.05 (Wednesday’s high)
Stop-loss: Below trendline support at $49.80
Targets: Gap fill at $55.00
Risk/Reward: ~1:1.9
Technical Rationale
📈 Uptrend Intact: Price holding higher lows above rising trendline since April
⭐ Strong Buy Rating: Analysts set 1-year target at $52.00 (+3.4%), signaling upside confidence
🔍 Pattern: Ascending triangle, breakout trigger at $52.05 on daily timeframe
Catalysts & Context
📰 “Strong Buy” consensus, price target upgrade by analysts
🔔 Sector strength in large-cap holding companies
📊 Macro backdrop: Market rotation into value/growth names, risk appetite rising
Trade Management Plan
Entry: Triggered on daily close above $52.05
Stop-loss: Hard stop at $49.80; trail to breakeven if price closes above $53
Scaling: Take 50% profit at $54.00, hold rest for full gap fill at $55.00
Poll
What’s your view? Are you watching KARMAN? Comment below or vote:
🔼 Bullish
🔽 Bearish
🔄 Waiting for confirmation
Follow us for more high-conviction trade ideas & daily setups! 🚨
Disclaimer: Not financial advice. Trade at your own risk.
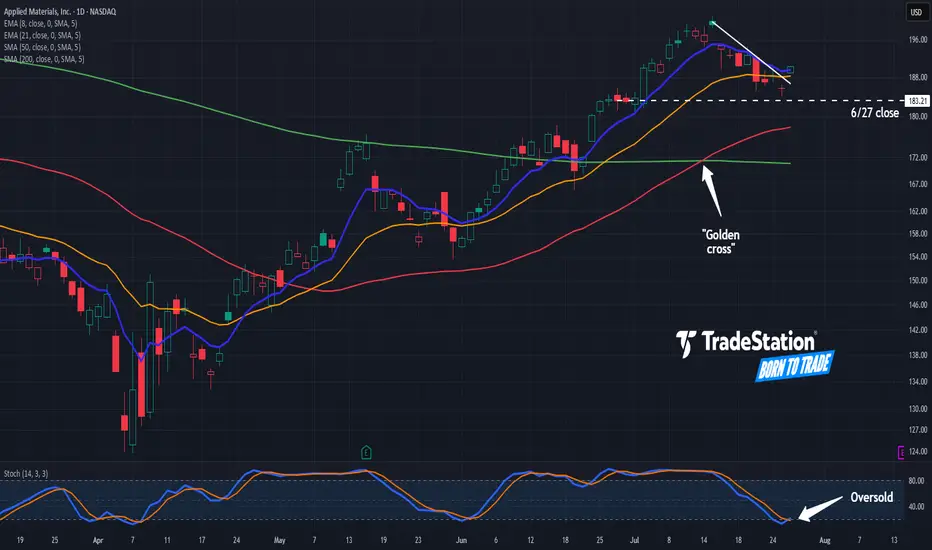
Applied Materials: Trendline Breakout?Applied Materials recently hit a nine-month high, and now it’s pulled back.
The first pattern on today’s chart is June 27's weekly close of $183.21. The chip-equipment company has bounced above that level, which may suggest new support is in place.
Second is the series of lower highs since mid-July. AMAT began this week by jumping above that trendline. Could the move be viewed as a breakout?
Third, stochastics are rebounding from an oversold condition.
Fourth, the 8-day exponential moving average (EMA) has remained above the 21-day EMA. The 50-day simple moving average (SMA) also had a “golden cross” above the 200-day SMA about two weeks ago. Those patterns may be consistent with bullish trends in the short and long terms.
TradeStation has, for decades, advanced the trading industry, providing access to stocks, options and futures. If you're born to trade, we could be for you. See our Overview for more.
Past performance, whether actual or indicated by historical tests of strategies, is no guarantee of future performance or success. There is a possibility that you may sustain a loss equal to or greater than your entire investment regardless of which asset class you trade (equities, options or futures); therefore, you should not invest or risk money that you cannot afford to lose. Online trading is not suitable for all investors. View the document titled Characteristics and Risks of Standardized Options at www.TradeStation.com . Before trading any asset class, customers must read the relevant risk disclosure statements on www.TradeStation.com . System access and trade placement and execution may be delayed or fail due to market volatility and volume, quote delays, system and software errors, Internet traffic, outages and other factors.
Securities and futures trading is offered to self-directed customers by TradeStation Securities, Inc., a broker-dealer registered with the Securities and Exchange Commission and a futures commission merchant licensed with the Commodity Futures Trading Commission). TradeStation Securities is a member of the Financial Industry Regulatory Authority, the National Futures Association, and a number of exchanges.
TradeStation Securities, Inc. and TradeStation Technologies, Inc. are each wholly owned subsidiaries of TradeStation Group, Inc., both operating, and providing products and services, under the TradeStation brand and trademark. When applying for, or purchasing, accounts, subscriptions, products and services, it is important that you know which company you will be dealing with. Visit www.TradeStation.com for further important information explaining what this means.
Mayville Engineering Company, Inc. (MEC) Thrives in FabricationMayville Engineering Company, Inc. (MEC) is a leading U.S.-based contract manufacturer that provides metal fabrication, coating, and assembly services for industries like agriculture, construction, military, and commercial vehicles. Known for its precision and quality, MEC partners with major OEMs to deliver complex, customized metal components. The company’s growth is fueled by strong manufacturing demand, long-term client relationships, and ongoing U.S. industrial expansion.
On the chart, a confirmation bar with rising volume signals bullish activity. The price has moved into the momentum zone by breaking above the .236 Fibonacci level. A trailing stop can be placed just below this Fibonacci level using the snap tool, offering protection while allowing the trade to capture further upside potential.

PYPL LOOKING BULLISH JULY 29 2025Pypl is lloking good to go long. Whenever I trade at current price rule is clear that you manage your risk and quantities properly. Dont blindly trade in a hope to make quick money. Pypl looking good to go to $85 soon

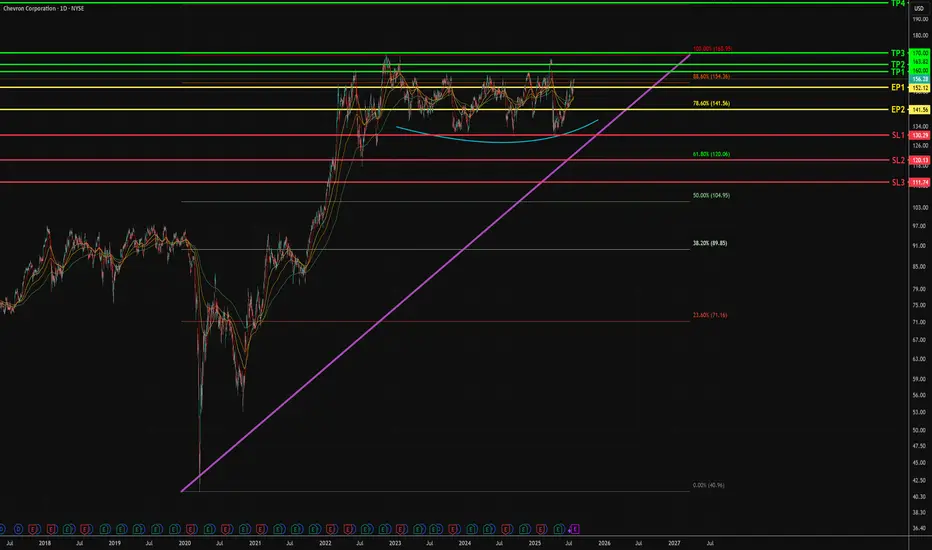
CVX - Potential Swing Upside - Mid TermTimeline - now to 3 months
1. Bullish flag pattern sustained, form during Oct 2021.
2. Rounding bottom above 1D resistance at $130
- Last close is above Fib 88.6% - $154.36
- In the 2 days, weak selling pressure is noticed.
3. More attempts to break 88.6% Fib level opposed to $130 support line
- Bullish angle upthrust stays above 45 degrees
- Concludes high change of breaking 88.6% fib level, towards previous high of $169.66
3. Entry points
EP 1 - buy spot with 1 or 0.5 size
EP 2 - Enter another 1 or 0.5 size if closing prices stay above Fib 78.6% at $141.56
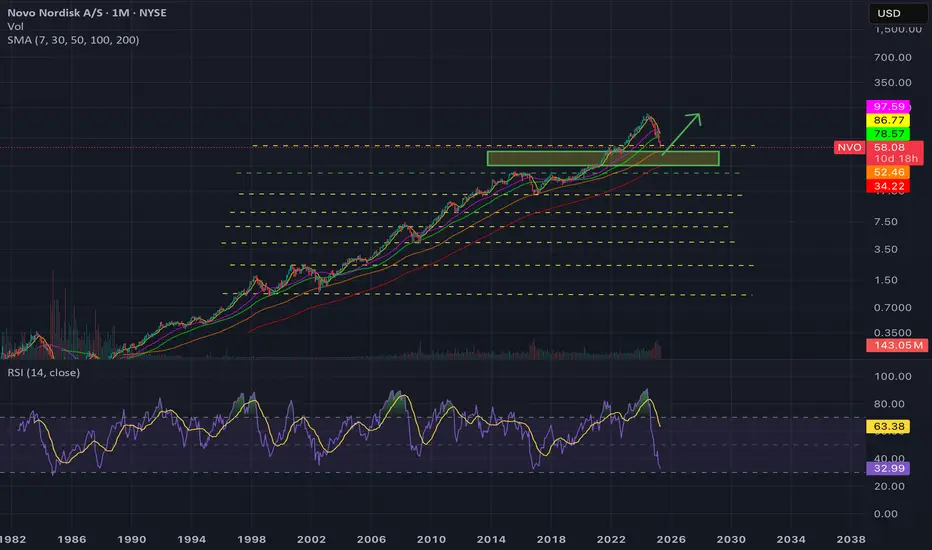
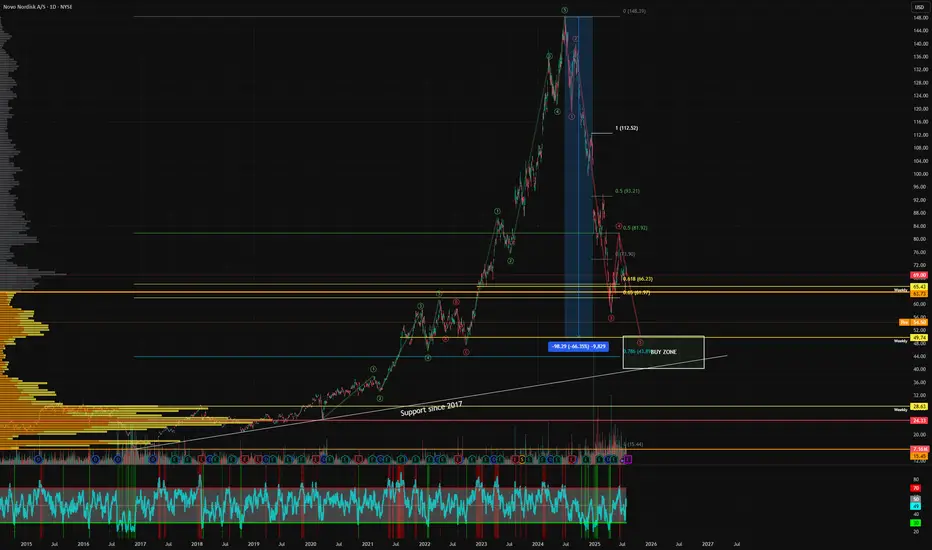
$NVO offers solid risk to reward for long term buyers! - I had previously called out that NYSE:NVO would have more pain to come when it was in $85-90s I have attached the link with this post for my reader's reference.
- Now, I am turning bullish on this name given these prices and compressed multiples for the growth prospects it offers.
Fundamentally,
Year | 2025 | 2026 | 2027 | 2028
EPS | 3.93 | 4.78 | 5.41 | 5.97
EPS growth% | 25.41% | 21.60% | 13.19% | 10.24%
For a quality name growing EPS > 20% deserves a fair forward multiple of 25.
| Year | Bear (fp/e = 15) | Cons. Base (f. p/e = 20) | Base (fpe = 25) | Bull Case (fpe=30)
| 2025 | $58.95 | $78 |. $98.25. |. $117.9
| 2026 | $71.7 | $95 |. $119. |. $143.4
| 2027 | $81.15 | $108 |. $135 | $162.3
| 2028 | $90 | $119 |. $149.25 | $179.1
As you can see, If you buy NYSE:NVO under $60 then you will be making money even if multiple remains compressed i.e bear case. Only thing you have to do is hold and returns would amplify once there is optimism back in the market which will lead to multiple expansion.
My fair value for NYSE:NVO for this year is $78 based on the conservative base case.
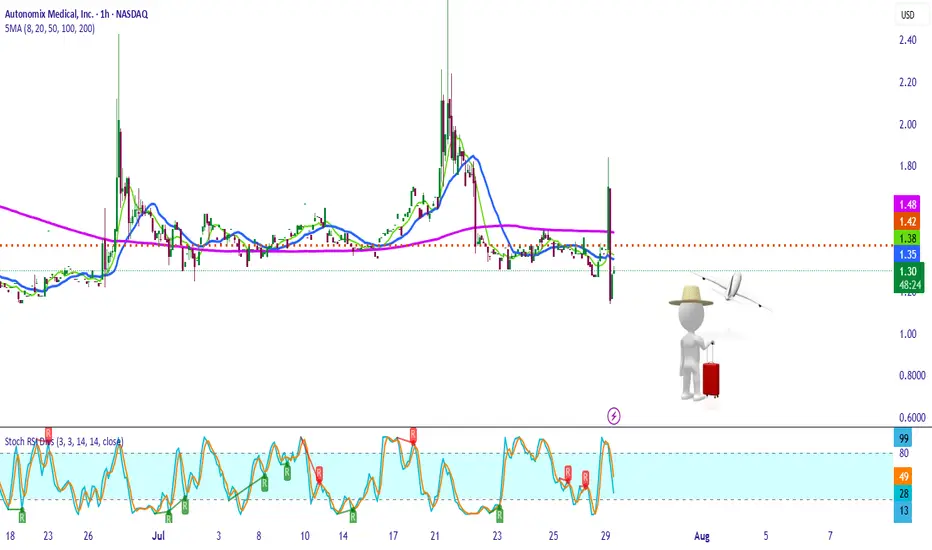
“Pack Your Bags… or Bail Out Fast”This is the “I’m just here for the pop” strategy — where we ride that violent engulfing candle like it owes us money… but keep one hand on the eject button. AMIX just flash-banged the chart with a surprise move from the graveyard, blowing past the 50MA like it saw its ex.
We’re targeting a scalp-to-swing depending on whether it holds above $1.36 (5MA) or rejects at $1.42–$1.48 (previous supply zone).
Tight stop under $1.29, because if this turns fake, you’ll be dragging that little red suitcase next to the cartoon dude — headed back to “Bagholder Island.”
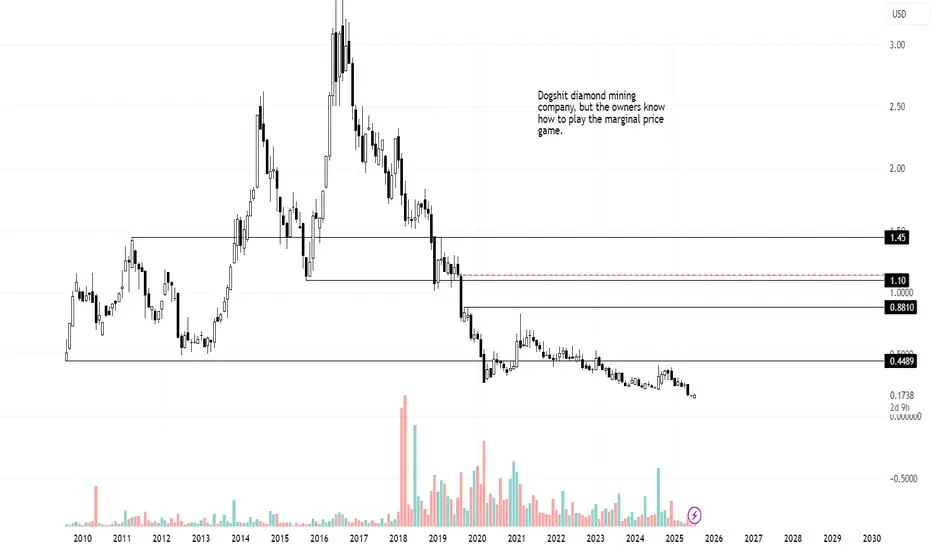
Lucara long Lucara is almost below the TSX lows made in 2008. If you bought equity in the company anywhere in the last 10 years you are losing money. The company is in debt to finance the construction of new mining facilities and has been taking their sweet time.
However, the owners are Lundin and they know how to play the game with equity, marginal pricing, debt, balance sheet shenanigans, and leverage. I would not at all be surprised if the debt in the company's balance sheet is mostly owned by the family and they are just taking out their pay in the form of debt repayments instead of in the form of dividends.
Diamonds are famous for being used in drilling, I'm not sure if Lucara sells diamonds for drilling, but Trump's policy is drill baby drill. Even if Lucara does not sell diamonds for drilling they should benefit from the news cycle and public perception.
This is a very speculative play and it depends of a series of factors, but I reckon there is a good chance it goes to 0.88 USD/share, 1.10, even 1.45.
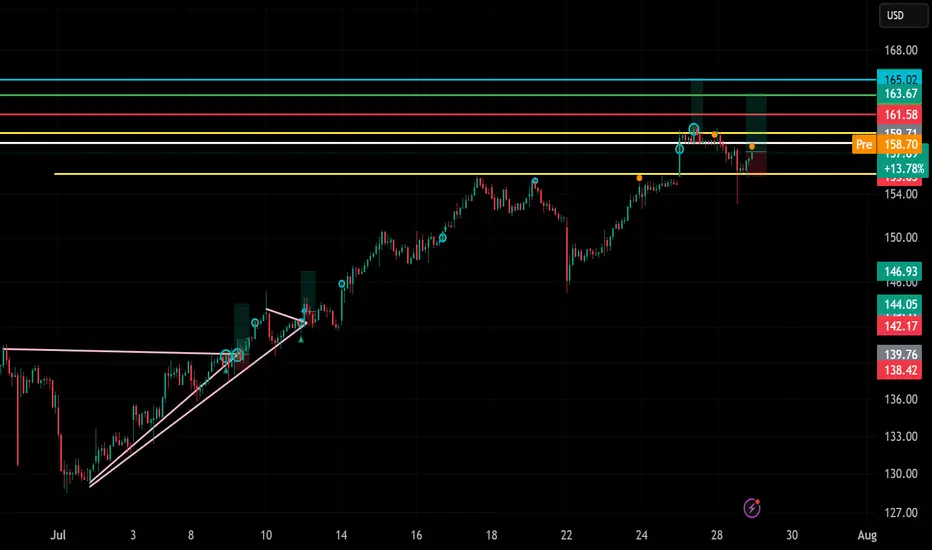
PLTR Long trade!🟢
You’re expecting price to move upward, and your chart reflects a breakout setup with multiple resistance levels marked.
🔍 Key Technical Elements Noted:
Ascending triangle breakout:
The pink trendlines show an ascending triangle (bullish pattern) that successfully broke out.
Support Zone:
Around 158.00 – 158.62 (highlighted by the yellow lines), showing a prior resistance turned into support.
Resistance Zones (Target Levels):
161.58
163.67
165.02
These cyan and red lines look like Fibonacci extensions or supply zones — ideal for profit targets.
Risk Level:
Likely below 158 or just under the recent wick — this acts as your stop-loss zone.
Volume/Breakout Candle:
Strong bullish candle visible near breakout level, confirming entry strength.
✅ Possible Long Trade Plan (Example):
Entry: Around $158.60 (current price)
Stop-Loss: Below $157.00 or candle low
Targets:
$161.58 (Target 1)
$163.67 (Target 2)
$165.02 (Final Target)
“Strike with confirmation. Stay nimble. Exit clean.”This scalp strategy focuses on spotting bullish or bearish engulfing candles on the 5–15 minute chart during high-volume moves. Entry is taken on confirmation of the pattern, with a tight 2–3% stop just below/above the engulfing candle. Ideal during trend continuations or fakeout reversals. Quick in, quick out — aim for 1.5–2x risk-to-reward and stay disciplined.
Imagine if this hit $1

Final Drop?This looks like the final puke of wave 5. It could end up anywhere between $40-50. I have taken a position at $50 and I intend to load up more if we retest the historical support trendline.
Not financial advice, do what's best for you
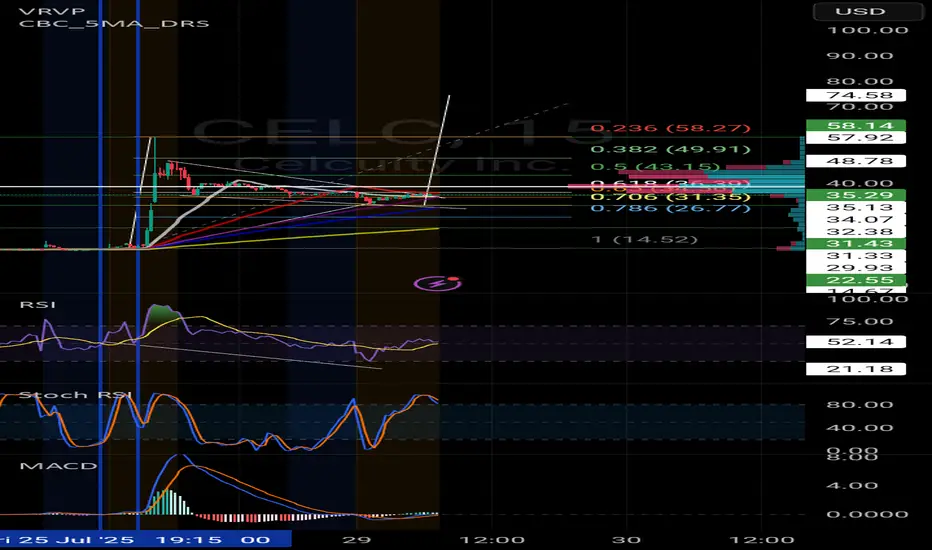
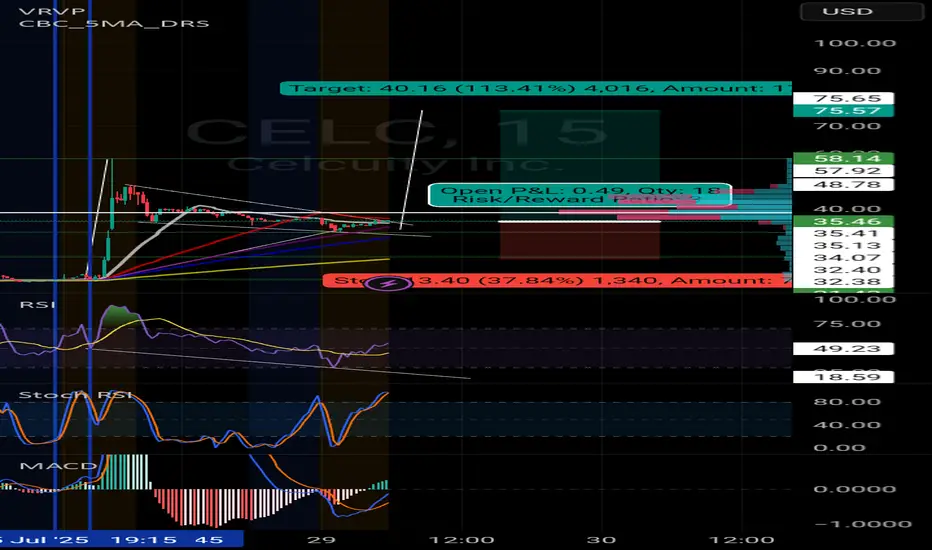
CelcCelc 15 minutes time frame shows me potential hidden bullish divergence
Falling wedge
Potential 100% gains here.
This is one to watch today
July 29th 2025
LONG NVAX"Novavax is the dark horse of the pharma race – while the market watches Pfizer and Moderna, NVAX is quietly strengthening its position with an improved protein-based vaccine. The approval of their combined COVID and flu shot might be just the beginning. And here’s the kicker – in every bull run, speculators return to classic high-volatility plays and biotech names with a big story. Novavax has a history of explosive moves, and it only takes one headline or a wave of FOMO to send the stock flying. That’s why it makes sense to buy before the hype starts again!"

Looking for $203Super meaningful description, chart explains itself and numbers behind in borrows and shorts are lined up, sooner than later gonna move... tgt 200-210

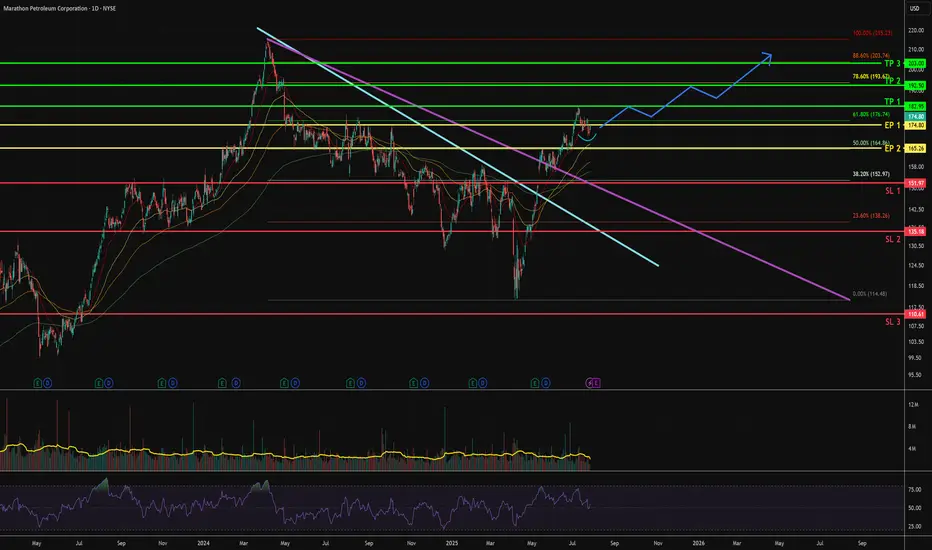
MPC - Upside swing [ 1 to 3 months ]1. Downtrend line of 11 months is broken
- Price gapped up, and sustained above Fib 38.2% and 50%.
- This concludes the end of bear trap and the switch from bear to bull trend.
2. In the last month, weak selling pressure is noticed.
- Rounding bottom above previous 1D resistance at $171.50
- Closes are creeping near to Fib 61.8%
- Flipping to bullish stance
3. Entry points
EP 1 - buy spot with 1 or 0.5 size
EP 2 - Enter another 1 or 0.5 size if closing prices stay above Fib 50% at $164.8
INTC: Intel turnaround will take timeAs we have Intel earnings report released on Thursday, it miss on on EPS, but beat on revenue.
as Intel lag the industry, we still waiting some confirmations of positive turnaround, once we get it, we may get it long from this competitive level since P/B below $1.
Disclaimer: This content is NOT a financial advise, it is for educational purpose only.

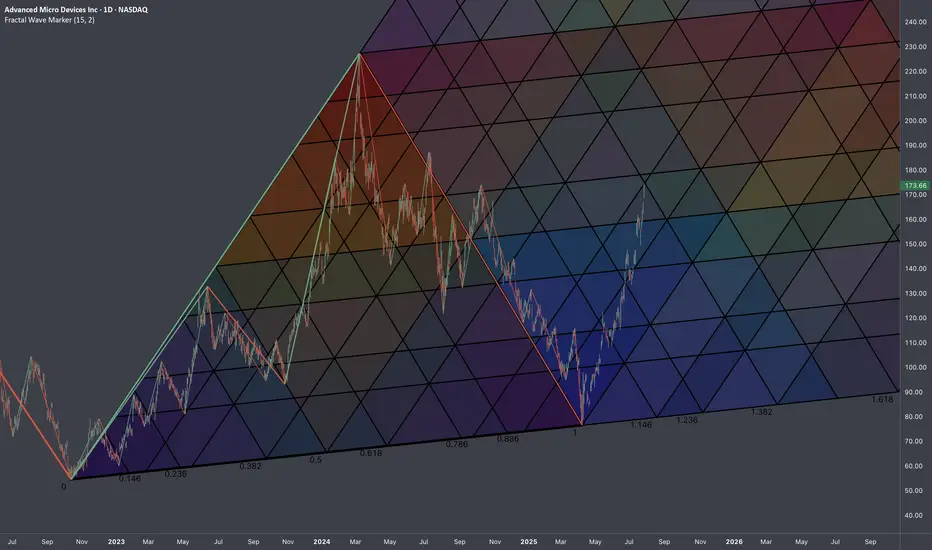
$AMD: Fractal Geometry (Cycle 2022-2025)🏛️ Research Notes
3 Coordinates used for base L-H-L
Fragmented with color spectrum fibs:
Extending structure with same scaling laws:
The chart intended to show objective structure covering unfolding progressions within cycles.
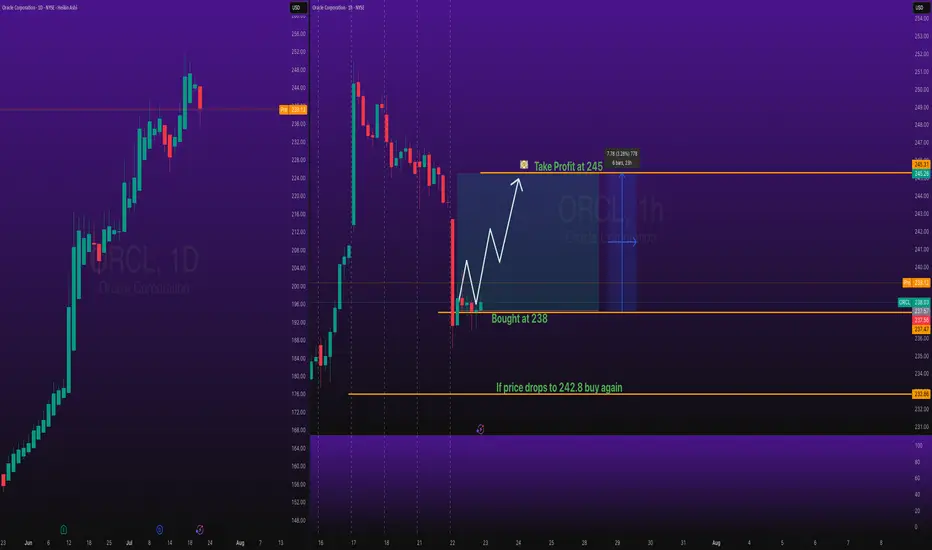
Oracle Buy Trade with Take Profit Stocks SPOT ACCOUNT:
NYSE:ORCL stocks my buy trade with take profit.
This is my SPOT Accounts for Stocks Portfolio.
Trade shows my Buying and Take Profit Level.
Spot account doesn't need SL because its stocks buying account