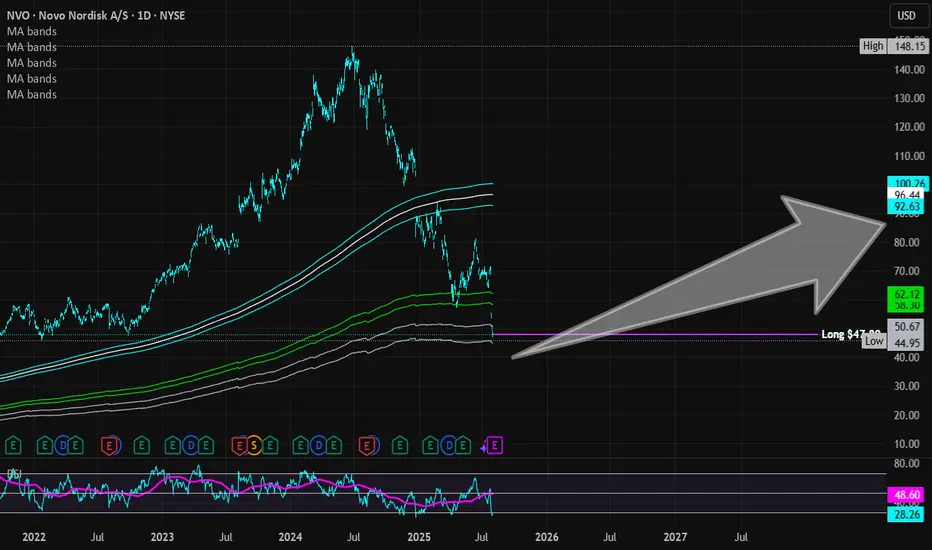
Novo Nordisk (Revised) | NVO | Long at $47.78**This is a revised analysis from February 5, 2025: I am still in that position, but added significantly more below $50**
Novo Nordisk NYSE:NVO is now trading at valuations before its release of Wegovy and Ozempic... From a technical analysis perspective, it's within my "major crash" simple moving average zone (gray lines). When a company's stock price enters this region (especially large and healthy companies) I always grab shares - either for a temporary future bounce or a long-term hold. While currently trading near $47 a share, I think worst case scenario here in 2025 is near $38-$39. Tariffs may cause a recession in the second half of 2025, so no company would be immune.
As mentioned above, I am still a holder at $86.74. However, I went in much heavier within my "major crash" simple moving average band and have a final entry planned near $38-$38 (if it drops there). My current cost average is near $55.00.
Why do I still have faith in NYSE:NVO ? Because no one else does right now, yet it generated $42 billion in revenue, $14 billion in profits, and has significant cash flow YoY. The company has a massive pipeline, despite Wegovy and Ozempic competition, and I think the market is undervaluing its position in the pharmaceutical industry.
Revised Targets in 2028:
$60.00 (+25.6%)
$70.00 (+46.5%)
$80.00 (+67.4%)
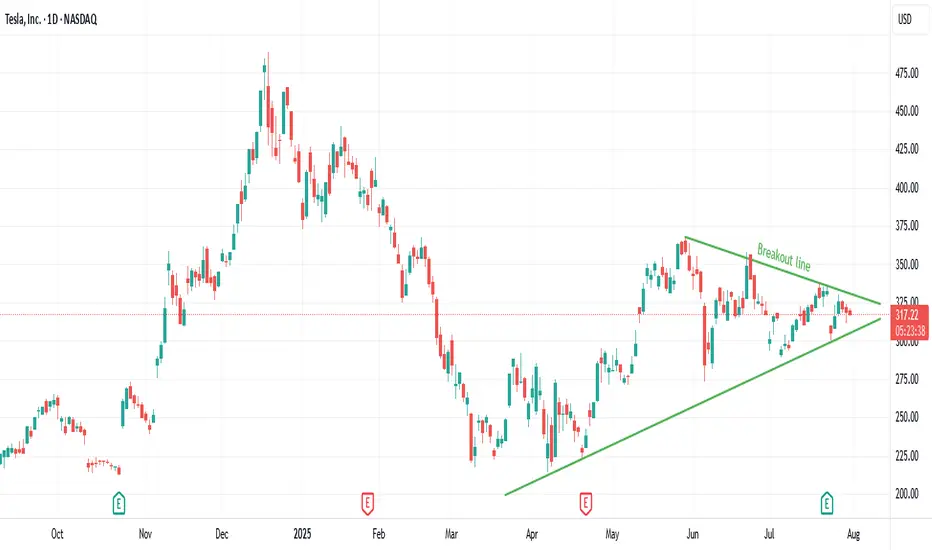
TSLA Breakout Watch: Symmetrical Triangle Squeeze!Trade Summary
Setup: Symmetrical triangle pattern tightening since March; volatility compression signals an imminent breakout.
Entry: On daily close above the triangle resistance (~$324)
Stop‑loss: Below triangle support (~$305)
Targets:
• Target 1: $375
• Long-term: $500+
Risk/Reward: ~2.5–3:1 (Initial target), higher for long-term hold
Technical Rationale
📈 Symmetrical triangle: Clear converging trendlines; price nearing apex after months of higher lows and lower highs
🔔 Volatility squeeze: Range compression increases odds of explosive move
⏳ Daily timeframe: Signals a swing/position trade opportunity with significant upside
Catalysts & Context
⚡️ Earnings season ahead could trigger a breakout
🌱 EV sector momentum and renewed tech leadership
🏦 Analyst upgrades and potential for macro rate cuts
Trade Management Plan
Entry: Wait for a daily close and volume confirmation above $324 resistance
Stop-loss: Tight initial stop below $305; trail to breakeven after breakout confirmation
Scaling: Partial profits at $375; let remainder run for $500+ if momentum continues
Poll
What’s your view? Are you watching TSLA? Comment below or vote:
🔼 Bullish
🔽 Bearish
🔄 Waiting for confirmation
Follow us for daily high-probability setups & real-time trade updates!
Disclaimer: Not financial advice. Trade at your own risk.
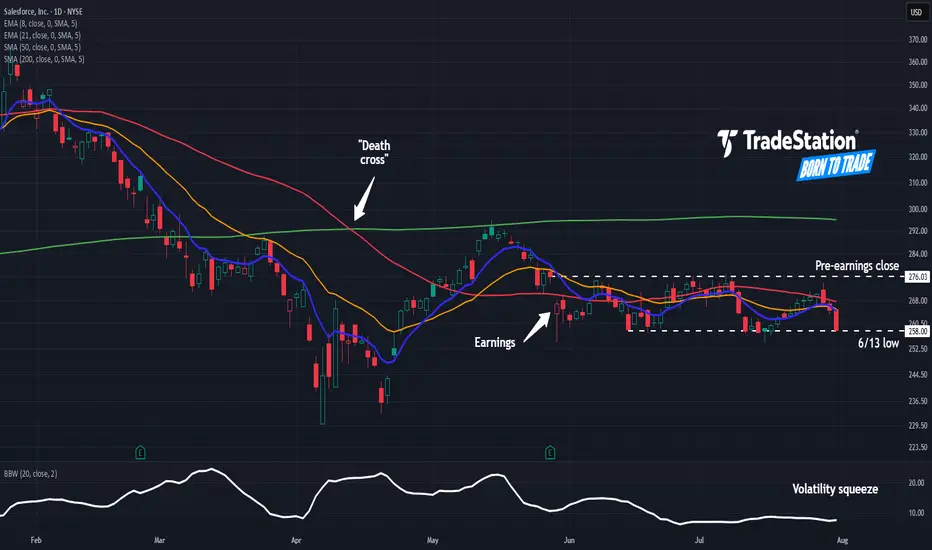
Salesforce May Face DistributionSalesforce has limped as other tech stocks hit new highs, and some traders may think it’s going into distribution.
The first pattern on today’s chart is the bearish price gap on May 29 despite better-than-expected quarterly results. That may reflect waning enthusiasm about the software company’s fundamentals.
Second is the pre-earnings closing price of $276.03. CRM has remained trapped below that level, which may suggest it’s become resistance.
Third is the June 13 low of $258. The stock bounced there in mid-July but may now be at risk of breaking it.
Next, Bollinger Bandwidth has narrowed as the stock formed a tight range between the two levels. Could price movement expand following that period of compression?
Last, the 50-day simple moving average (SMA) had a “death cross” below the 200-day SMA in April. The 8-day exponential moving average (EMA) is also below the 21-day EMA. Those patterns may be consistent with bearishness in the long and short terms.
TradeStation has, for decades, advanced the trading industry, providing access to stocks, options and futures. If you're born to trade, we could be for you. See our Overview for more.
Past performance, whether actual or indicated by historical tests of strategies, is no guarantee of future performance or success. There is a possibility that you may sustain a loss equal to or greater than your entire investment regardless of which asset class you trade (equities, options or futures); therefore, you should not invest or risk money that you cannot afford to lose. Online trading is not suitable for all investors. View the document titled Characteristics and Risks of Standardized Options at www.TradeStation.com . Before trading any asset class, customers must read the relevant risk disclosure statements on www.TradeStation.com . System access and trade placement and execution may be delayed or fail due to market volatility and volume, quote delays, system and software errors, Internet traffic, outages and other factors.
Securities and futures trading is offered to self-directed customers by TradeStation Securities, Inc., a broker-dealer registered with the Securities and Exchange Commission and a futures commission merchant licensed with the Commodity Futures Trading Commission). TradeStation Securities is a member of the Financial Industry Regulatory Authority, the National Futures Association, and a number of exchanges.
TradeStation Securities, Inc. and TradeStation Technologies, Inc. are each wholly owned subsidiaries of TradeStation Group, Inc., both operating, and providing products and services, under the TradeStation brand and trademark. When applying for, or purchasing, accounts, subscriptions, products and services, it is important that you know which company you will be dealing with. Visit www.TradeStation.com for further important information explaining what this means.
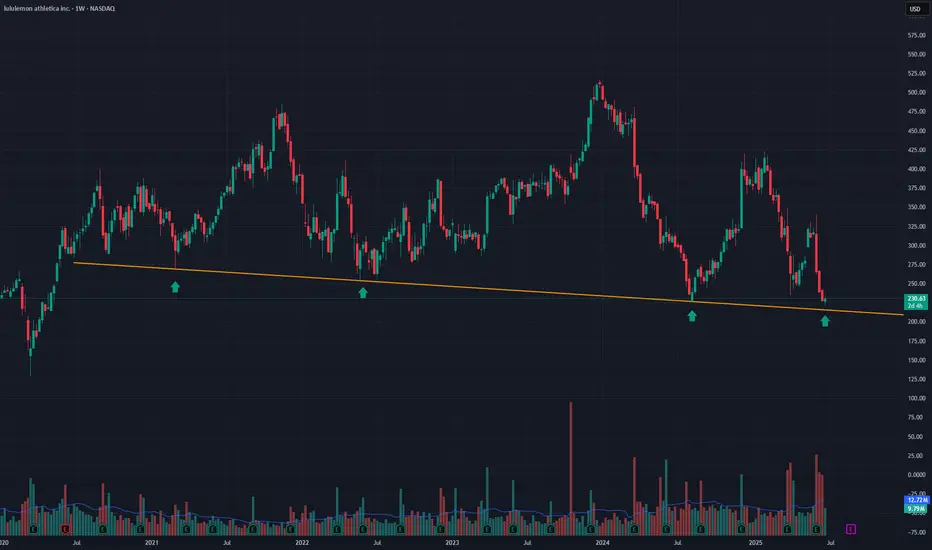
LULU into supportLulu is on sale as its just come into an area it has only sold at, 3 other times out of the past 5 years. As you can see by the Orange line, LULU has been holding this area of support for the past 5 years. This is a great buying opportunity. A close below the line on a weekly basis would stop out of the trade
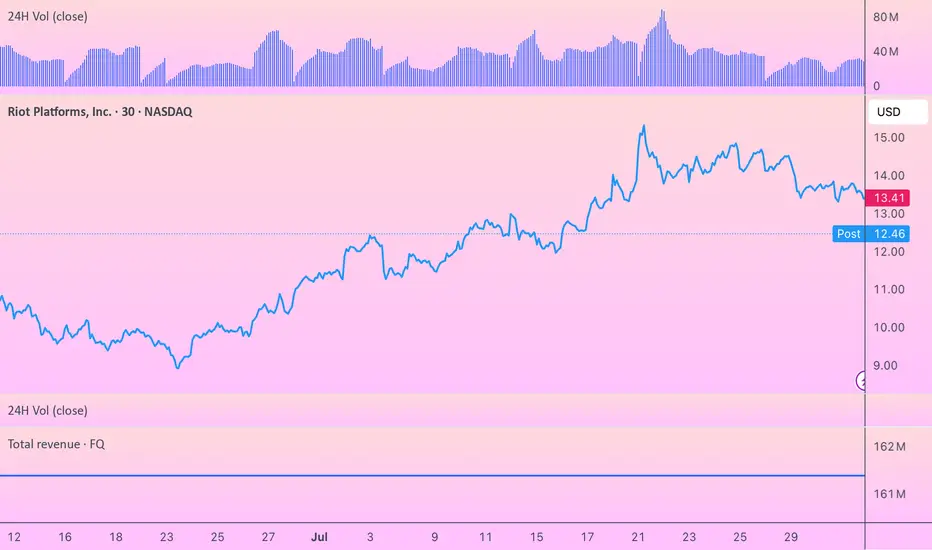
Why Riot Stock Dropped After Q2 Earnings Despite Good NumbersWhen I first saw Riot Platforms' Q2 2025 earnings report, the numbers looked impressive at first glance. The company posted net income of $219.5 million, a dramatic turnaround from recent quarters. But as I dug deeper into the details, it became clear why the stock sold off despite what appeared to be strong results.
The most immediate red flag for me was the revenue miss. While Riot reported $153.0 million in revenue against the FactSet consensus of $156.3 million. Given Riot's recent track record of disappointing investors, this miss reinforced concerns about management's ability to meet their own guidance.
What really caught my attention, though, was the composition of that $219.5 million in net income. The company benefited from a massive $470 million gain on changes in Bitcoin's fair value, which was partially offset by a $158 million loss on contract settlements. This tells me that the earnings quality is questionable at best. Strip away the mark-to-market accounting gains from Bitcoin appreciation, and the underlying operational performance looks far less impressive.
I'm particularly concerned about the deteriorating unit economics in Riot's core mining business. The cost to mine each Bitcoin has essentially doubled to around $49,000 compared to $25,300 in the same quarter last year. This dramatic increase stems from the Bitcoin halving event and rising network difficulty, but it fundamentally undermines the investment thesis for Bitcoin miners. Even with Bitcoin trading at elevated levels, these higher production costs are compressing margins and eating into what should be a period of strong profitability.
In the previous quarter, Riot missed earnings estimates by over 260%, posting a net loss of $296 million. The company has now missed consensus estimates in three of the last four quarters, creating a pattern that's hard for investors to ignore. This track record of disappointing execution has clearly eroded confidence in management's ability to deliver consistent results.
In terms of hashrate, Riot only ranked #6 among public miners, after Mara, IREN, Cleanspark, Cango, and BitFuFu.
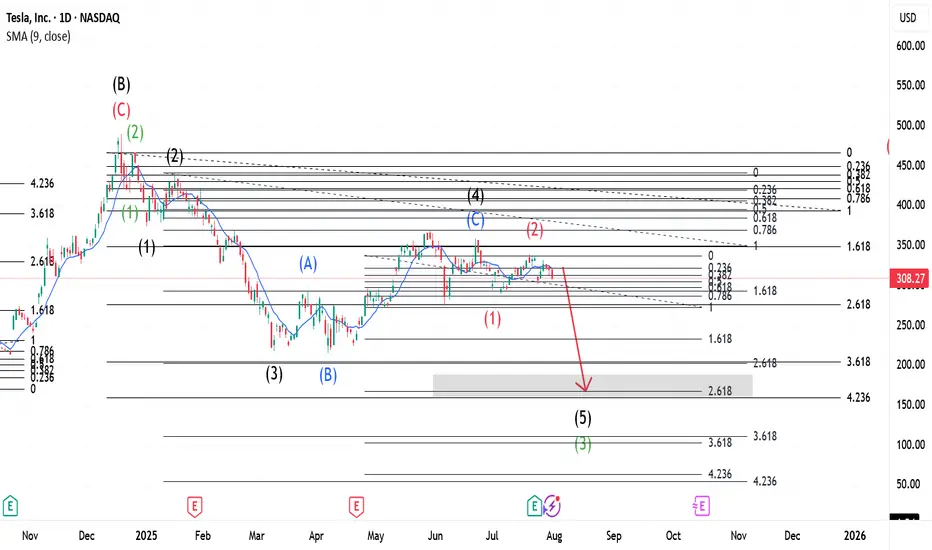
Tesla (TSLA) – VolanX Forecast: The Calm Before the Storm?📊 Tesla (TSLA) – VolanX Forecast: The Calm Before the Storm?
Wave structure analysis + liquidity map + roadmap to $513
🧩 The Story So Far – Compressed Potential
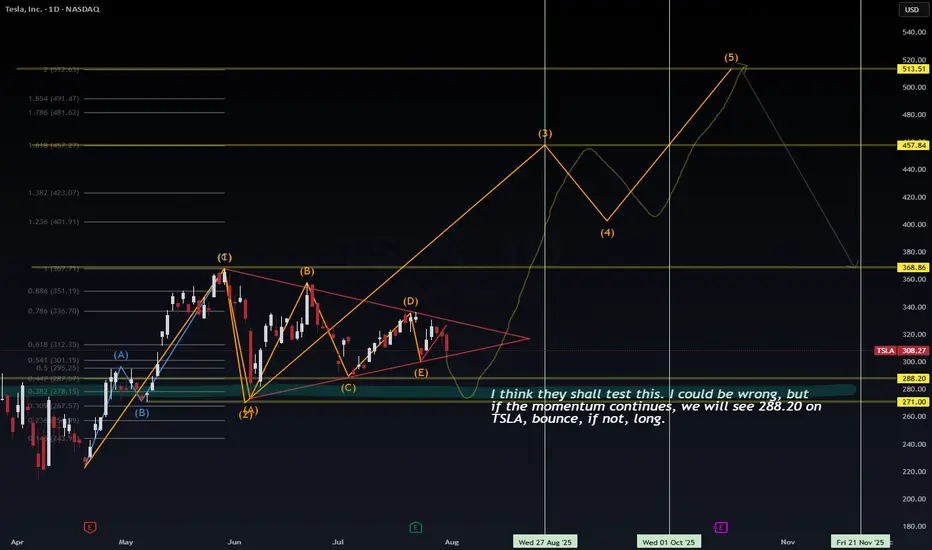
Tesla has spent the past three months inside a contracting triangle (ABCDE) — a classic Elliott Wave corrective pattern that signals energy compression before expansion. From the May high (Wave (1)), price has been coiling within tightening range boundaries, forming lower highs and higher lows. The triangle culminates with leg (E), now hovering near support.
🟠 VolanX flags this as a terminal wedge—an area where institutions test both sides of the book, hunting liquidity.
🌀 Wave Forecast – Impulse Awakening
If the triangle completes as expected, we enter Wave (3)—typically the most explosive wave in Elliott sequences.
Here's how the projected roadmap unfolds:
Wave (2) ends around $288.20–$271.00 (key demand/liquidity zone)
Wave (3) initiates from this springboard, aiming toward:
📈 1.0 Fib Extension at $367.71
📈 1.618 Extension at $457.84
Consolidation expected at that level forms Wave (4)
Final thrust into Wave (5) targets $513.51, aligning with extended Fib projection and historical order block
This sequence respects classical Elliott impulse structure: 5-wave motive into macro target zone.
🧪 Timing & Liquidity – Watch the Clock, Watch the Flow
🗓 Key Windows from chart verticals:
Aug 27–Sep 1, 2025: Liquidity test at $288.20 zone
Oct 1–15, 2025: Expansion toward Wave (3)
By mid-November 2025: Completion of Wave (5) → exhaustion at $513 zone before probable macro retracement
🔍 Liquidity Zones:
$288.20 – Institutional reaccumulation level (VolanX confirms large resting bids)
$271.00 – Final sweep zone. Break below would invalidate bullish count
Above, $336.70–$351.19 is the first liquidity magnet
Major stops above $457.84, then final cluster $513.51
🧠 VolanX Opinion – AI View on Risk & Opportunity
VolanX signals high-probability breakout setup, with confluence across:
Liquidity clusters
Fibonacci symmetry
Elliott sequencing
Gamma positioning (institutional hedging tilts long below $290)
📈 Current predictive bias: 68% probability of breakout from triangle resolving bullishly, conditional on $288 support holding.
If tested and respected, AI favors aggressive repositioning in long gamma, echoing historical TSLA breakout behavior.
📌 Strategy Summary:
“I think they shall test this… I could be wrong. But if momentum holds, $288.20 bounce is likely. If not, wait for structure to rebuild before long.”
🧭 Trade Setup (Not Financial Advice):
Watch zone: $288–271
Confirmation: Strong rejection wick + volume delta flip
Stop: Below $267.57
Targets: $367.71 → $457.84 → $513.51
🔻 Risk comes from invalidation below $271.
⚡ Reward stems from recognizing compression before expansion.
#TSLA #VolanX #ElliottWave #LiquiditySweep #WaveAnalysis #FibonacciLevels #SmartMoney #OptionsFlow #TeslaForecast #AITrading #WaverVanir
7/31/25 - $birk - PSA from a $DECK owner...7/31/25 :: VROCKSTAR :: NYSE:BIRK
PSA from a NYSE:DECK owner...
- not as close to this one as NYSE:DECK
- but it's hard enough to own names NYSE:DECK (reported nice beat and good indiation on 2H) and NASDAQ:LULU that reports end of aug with 6+% fcf yields and trading in the mid teens
- i "get" birkenstock is a great brand
- but should it trade high 20s when, honestly, it's not 2x-ish the quality of say "hoka" or "lululemon" brands? tough one
- it's more of a recent IPO too, which means still mkt (generally) has had less time to fully understand it... say over the period of time as it has NYSE:DECK and NASDAQ:LULU nevermind other stuff.
- i'm not suggesting this is a short
- but if i owned it, id probably swap it for one of the two above
- flagging this consideration for anyone before they FAFO
V

AMD WEEKLY TRADE SIGNAL (7/31/25)
### 🚀 AMD WEEKLY TRADE SIGNAL (7/31/25)
📈 **MARKET SNAPSHOT**
🟢 Daily RSI: **86.0** 🔥
🟢 Weekly RSI: **80.4**
📊 Volume: 🔺 1.5x (Institutional surge)
💬 Call/Put Ratio: **1.90**
🌪 Gamma Risk: **HIGH (1DTE)**
🧠 Sentiment: **Extremely Bullish** across all models
---
💥 **TRADE IDEA**
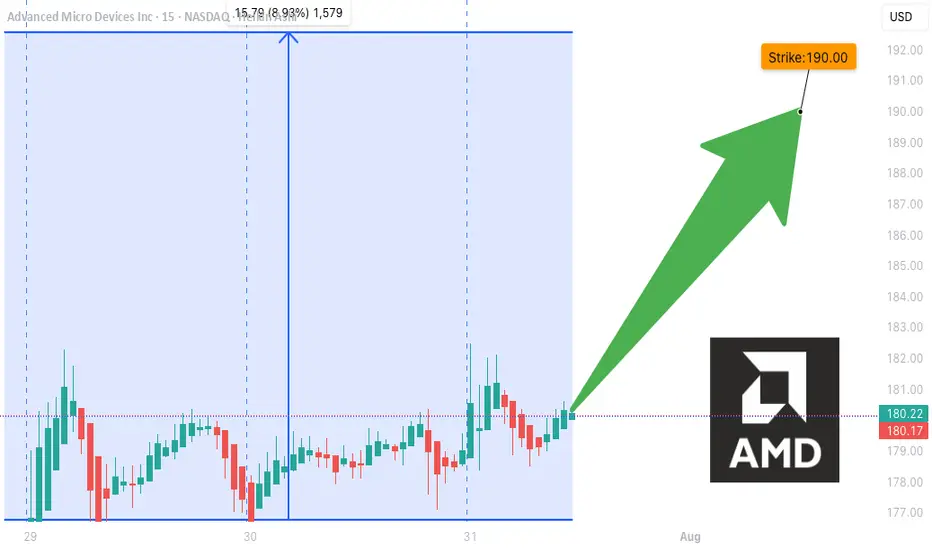
📍 Ticker: **\ NASDAQ:AMD **
📈 Direction: **CALL (LONG)**
🎯 Strike: **\$190.00**
💵 Entry: **\$0.51**
🎯 Target: **\$0.90** (+75%)
🛑 Stop Loss: **\$0.30**
📆 Expiry: **Aug 1 (Friday)**
📊 Confidence: **85%**
⏰ Entry: Market Open (Time-sensitive!)
---
🧠 **STRATEGY CONTEXT**
✅ Bullish momentum from AI sector hype
✅ Institutional call buying volume spiking
⚠️ 1DTE = High Gamma Risk = TRADE FAST OR DON’T TRADE
⚠️ Manage decay & exit early if momentum stalls
---
📌 Signal Posted: 2025-07-31 @ 12:17 PM ET
\#AMD #OptionsAlert #AITrade #WeeklyOptions #TradingViewViral #1DTE #GammaSqueeze
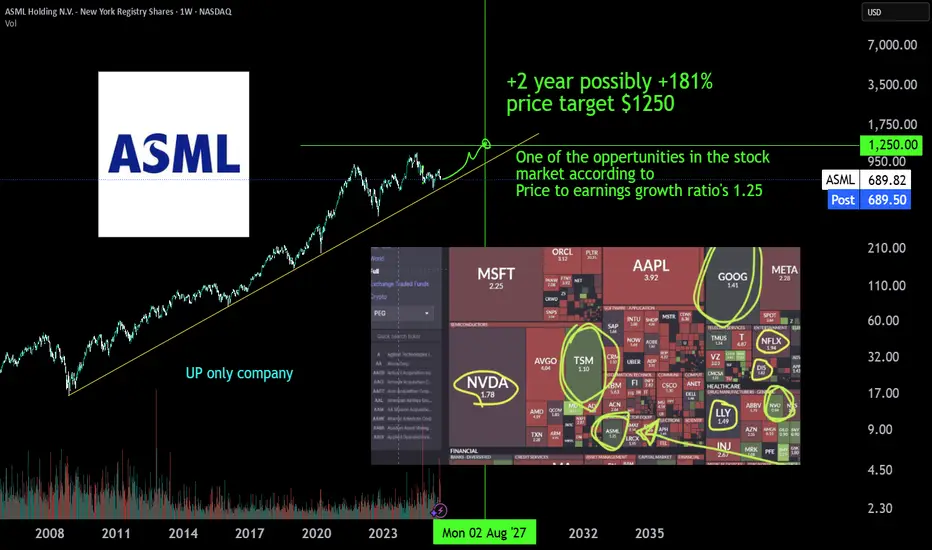
ASML monopolist, a +181% | 2Y oppertunityASML is the monopoly Extreme ultra violet machinery company. There is no one close to it's technology or there is no one investing enough to R&D a thing like it. The whole AI datacenter and cloud chip growth depends on EUV machinery of ASML developed in 2013 (>10y of PhD level R&D deveopment). The first new High-NA EUV systems have been deployed at Intel in July 2025 for research purposes and will scale just like the EUV already does to keep pace with moore's law. TSMC has stated it will not yet buy & depoly the newest machines jet, but has to expand with the 10 year older tech EUV machines just to get the AI chip demand going. AI chip demand at NVIDIA is growing harder than expected comfirmed by latest earnigns of alphabet, microsoft, meta and amazon. The whole AI data center growh depends on 2013 asml tech machines, and they already have a new tech High-NA EUV machine, just figure.
Also don't sleep on BESI a packing machinery wonder, due to hybrid bonding which makes stacking 3D chip structures possible.
#GoHighTechNetherlands
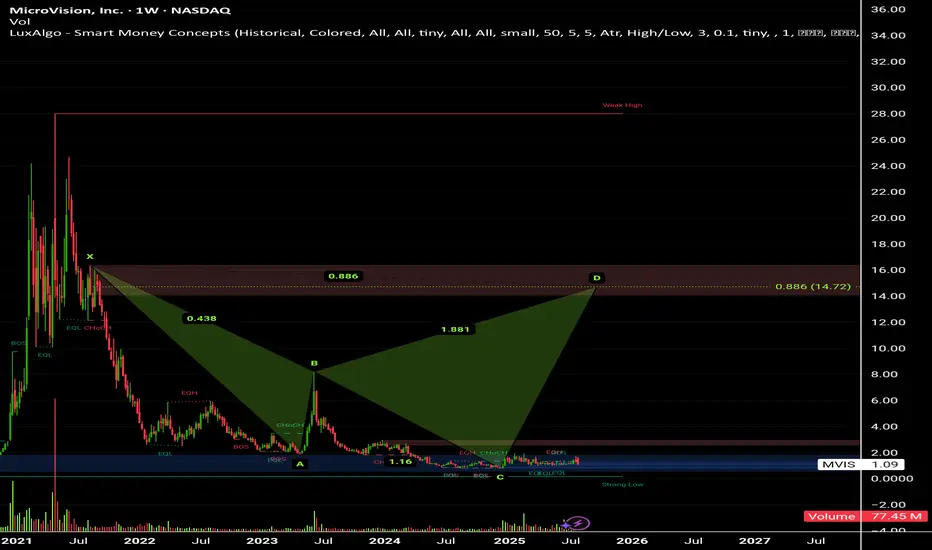
Microvision Inc (MVIS).Stock on triggering Explosive Level.
🦈 Shark Harmonic shap Target price above 14$ .
Any breaking up Resistance level 1.21$ , Buying signal triggering, Explosive level = 1.95$
Highly recommended for Buying now 👌
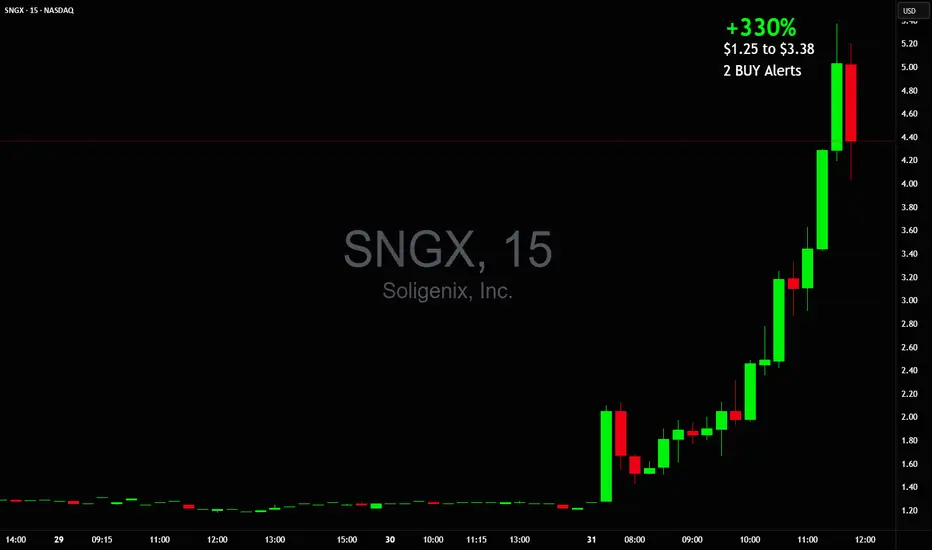
+330% this morning $1.25 to $5.38 on massive 270 million volume🚀 +330% this morning 💥 $1.25 to $5.38 on massive 270 million shares traded volume so far
NASDAQ:SNGX money maker of the day!
2 Buy Alerts sent out, also posted it in my premarket watchlist while it was still up only +30%!
Forget about NASDAQ:MSFT NASDAQ:META NASDAQ:AMZN NASDAQ:NVDA NASDAQ:AAPL AMEX:SPY NASDAQ:QQQ they will never be able to create such gains in a single day or should I say minutes
This isn't options trading either, it's a stock that went up that much this morning
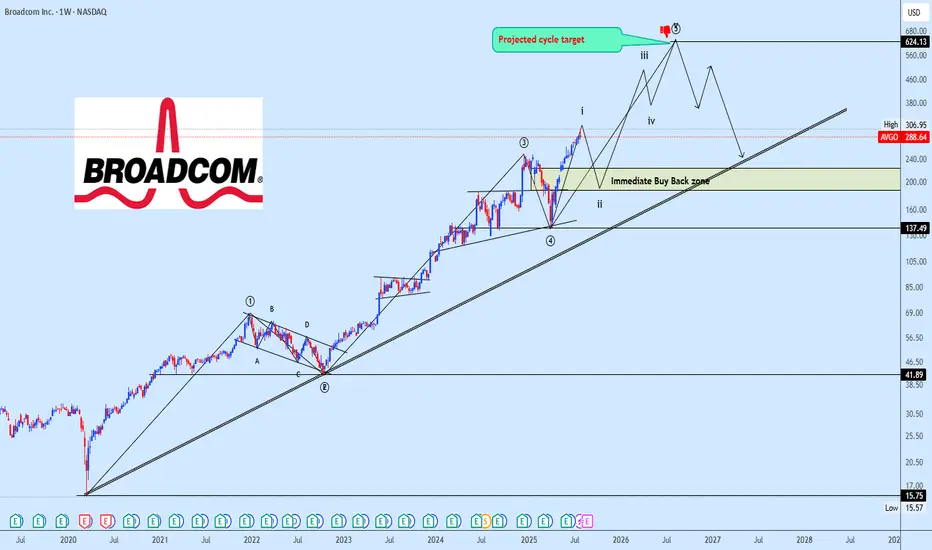
AVGO Bullish Impulse Wave Structure in ProgressAVGO continues its macro advance with a clear 5-wave impulse structure unfolding. The current price action marks the completion of subwave (i) of wave ⑤, setting the stage for a corrective pullback into subwave (ii).
We expect this corrective leg to reach into the 38.2%–50% Fibonacci retracement zone of subwave (i), which will serve as a potential re-accumulation area before the next bullish expansion.
The strategy remains to monitor the development of wave (ii) closely, waiting for key price reaction around the identified retracement zone to build positions in anticipation of subwave (iii) of ⑤ typically the strongest and most impulsive move in Elliott Wave structure.
Targets are shared on the chart for clarity. Patience here is key as we await the right entry zone aligned with technical confluence.
📌 Drop your stock requests in the comment section for quick chart updates — only equity-based assets will be accepted under this post.
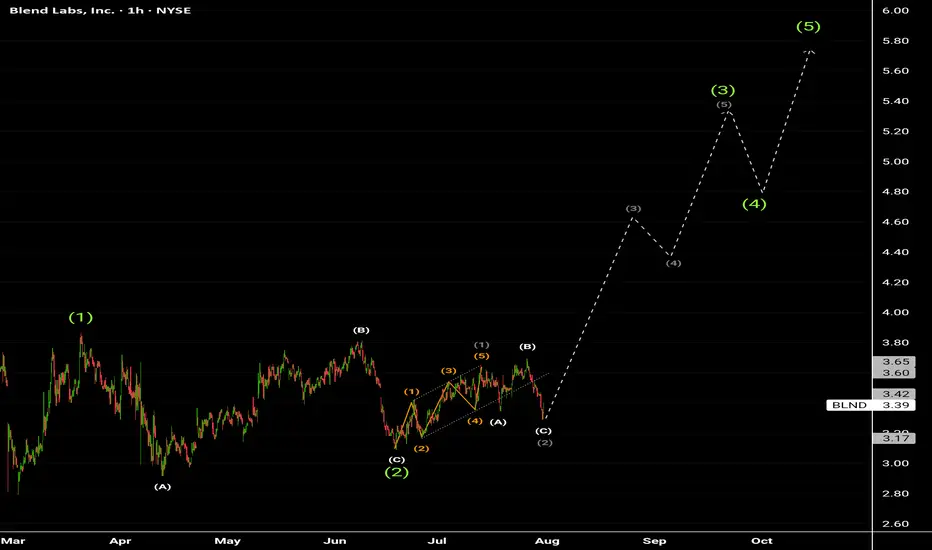
Blend labs inc. w1 completed of W3 , Rally expected to start to almost 4.60$ and above .
Target price 5.35$ and above shortly. 💥
It seems to me a great Earnings coming in August.
Highly recommended for Buying Now from present level.
Buy it ASAP 💣.
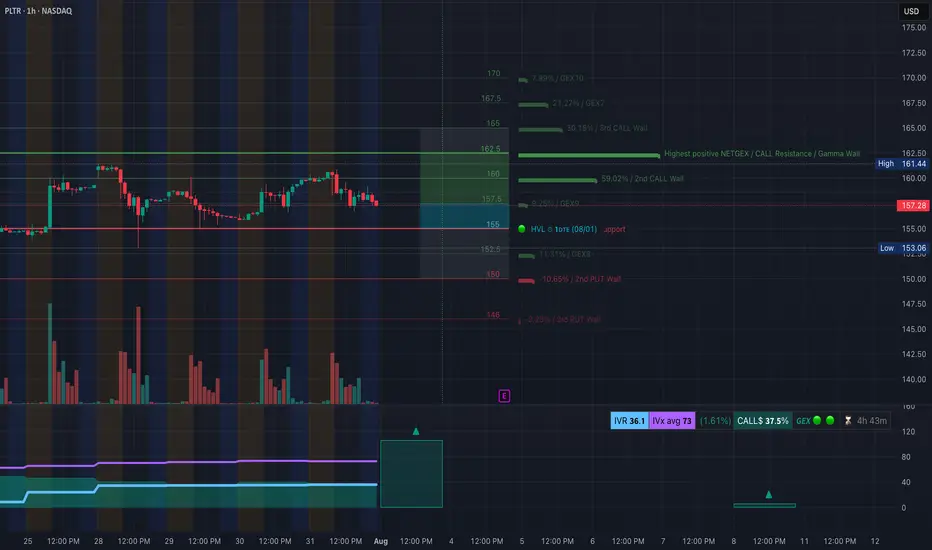
PLTR Pressured at Key Support — Can $155 Hold? 8/1PLTR Pressured at Key Support — Can $155 Hold or Is a Break to $150 Next?
🔍 GEX & Options Flow Insight (1st Image Analysis)
PLTR has been sliding after failing to hold its $160+ range and is now testing the $155–156 gamma support. The GEX profile still shows moderate call dominance, but support is thin below this level, meaning a break could bring swift downside.
* Call Walls & Resistance:
* 📍 $160.14 → 2nd Call Wall (59.02% GEX)
* 📍 $161.44 → Gamma Wall / Highest positive NET GEX
* 📍 $162.50 → 3rd Call Wall resistance
* Put Walls & Support Zones:
* 🛡️ $155.94 → Current gamma pivot and support
* 🚨 $153.06–$154.91 → 2nd Put Wall & HVL zone — break here risks slide to $150
* 📉 $146.00 → 3rd Put Wall & major downside target
* Volatility Insight:
* IVR 36.1, IVx Avg 73 → Elevated volatility
* Call flow 37.5% → Still skewed bullish, but waning
* GEX sentiment: 🟢🟡🟢 = Cautiously bullish gamma positioning but losing ground
✅ Option Trading Suggestion:
Bias: Bearish if $156 fails; bullish recovery possible only above $160
Strategy: Bear put spread if $156 breaks
* Entry Idea: Buy 155P / Sell 150P (Aug 2 or Aug 9 expiry)
* Invalidation: Strong reclaim above $160
* Target: $153 → $150
Why this works: PLTR is nearing a key gamma inflection. Below $156, dealers may need to hedge by selling, fueling a sharper drop. Bulls need to defend this pivot.
🧠 Technical Analysis (1H Chart) (2nd Image Analysis)
Market Structure & SMC:
* 🟥 CHoCH confirmed after rejection at $160+
* ❌ Broke out of ascending structure to the downside
* Sitting just above prior BOS zone at $155
Trendline Dynamics:
* Broken short-term uptrend now acting as resistance
* Downward-sloping structure points toward $153–150 retest
SMC Zones:
* 🟩 Demand Zone: $155–$153 → Current defense area
* 🟥 Supply Zone (Purple Box): $160–$162.5 → Strong resistance cluster
🔄 Price Action & Key Levels
* Support:
* ✅ $155.94 → Gamma pivot / current defense
* ✅ $153.06–$154.91 → Last key support before major drop
* 🚨 $146.00 → Next downside target
* Resistance:
* 🚩 $160.14 → First upside target if bounce
* 🚩 $161.44–$162.50 → Gamma & call wall zone
🧭 Scalping / Intraday Trade Setup
🟥 Bearish Setup (Preferred):
* Entry: Breakdown under $156
* Target 1: $153.50
* Target 2: $150
* Stop: Above $158
🟩 Bullish Reversal Setup:
* Entry: Reclaim of $160 with volume
* Target 1: $161.44
* Target 2: $162.50
* Stop: Below $158
🔁 Summary Thoughts
* PLTR is at a critical gamma support level.
* A failure here brings a quick shot to $153–150.
* Bulls must defend $156 and reclaim $160 to flip structure back bullish.
* Options positioning still leans bullish but is weakening, meaning downside acceleration risk is real.
🚨 Disclaimer:
This analysis is for educational purposes only and does not constitute financial advice. Always do your own research and manage your risk accordingly.
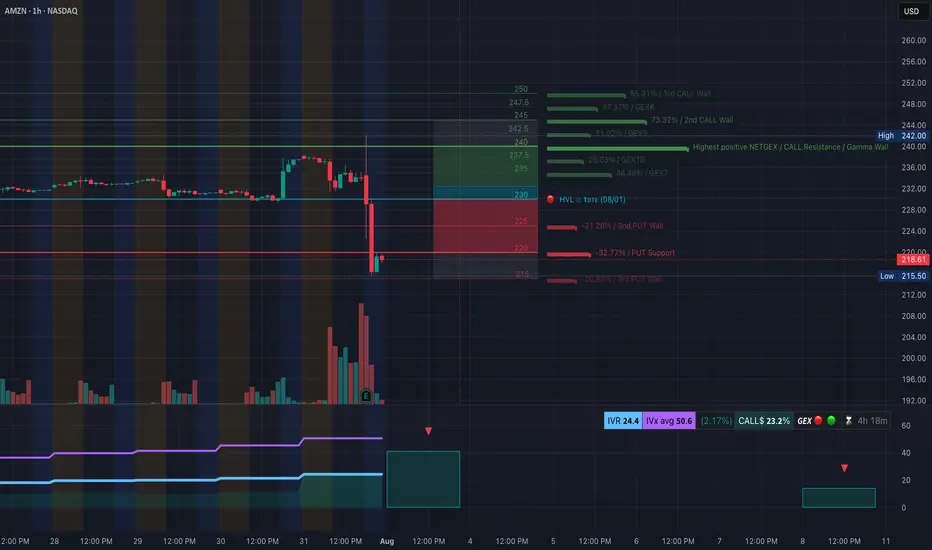
AMZN Earnings Flush — Gamma Flip to the Downside. 8/1AMZN Earnings Flush — Gamma Flip to the Downside, Eyes on $215 Support!
🔍 GEX & Options Flow Insight (1st Image Analysis)
AMZN collapsed post-earnings, breaking through major gamma support levels and flipping into a negative gamma environment. Price is now pressing against a critical $215–218 demand zone, with GEX showing heavy put concentration.
* Call Walls & Resistance:
* 📍 $230.00–$234.00 → Former gamma pivot now acting as strong resistance
* 📍 $237.50 → Prior support zone; now a sell wall
* 📍 $244.00 → Highest Positive NET GEX / Gamma Wall (too far for immediate recovery unless momentum shifts)
* Put Walls & Support Zones:
* 🛡️ $222.18 → 2nd Put Wall resistance-turned-support
* 🚨 $218.00 → Current price — key defense line
* 📉 $215.50 → Hard put wall support — losing this could accelerate selloff toward $210
* Volatility Insight:
* IVR 24.4, IVx Avg 50.6 → Elevated IV post-earnings
* Call flow 23.2% → Bearish options flow bias
* GEX sentiment: 🔴🟡🔴 = Negative gamma = higher volatility risk to downside
✅ Option Trading Suggestion:
Bias: Bearish unless AMZN reclaims $224+
Strategy: Bear put spread
* Entry Idea: Buy 220P / Sell 215P for Aug 2 or Aug 9 expiry
* Invalidation: Strong daily close above $224
* Target: $215 → $210
Why this works: Negative gamma positioning means market makers hedge by selling into weakness, accelerating downside moves. The inability to reclaim $224 confirms the bearish structure.
🧠 Technical Analysis (1H Chart) (2nd Image Analysis)
Market Structure & SMC:
* 🟥 CHoCH confirmed after earnings drop
* ❌ Lost all recent BOS levels in one sharp flush
* Price trapped under former OB resistance at $224–230
Trendline Dynamics:
* Broke out of prior bullish channel to the downside
* New descending channel forming with lower highs
SMC Zones:
* 🟩 Demand Zone: $215.50–$218.00 → Immediate defense
* 🟥 Supply Zone (Purple Box): $224–$230 → Sell wall
🔄 Price Action & Key Levels
* Support:
* ✅ $218.00 → Current defense
* ✅ $215.50 → Last line of gamma support
* 🚨 Below $215.50 → Sell momentum can accelerate to $210
* Resistance:
* 🚩 $224.00 → First reclaim needed for relief rally
* 🚩 $230.00–$234.00 → Heavy resistance
🧭 Scalping / Intraday Trade Setup
🟥 Bearish Setup (Preferred):
* Entry: Failed reclaim of $224
* Target 1: $218.00
* Target 2: $215.50
* Stop: Above $224
🟩 Bullish Reversal Setup:
* Entry: Strong reclaim of $224 with volume
* Target 1: $230.00
* Target 2: $234.00
* Stop: Back under $222
🔁 Summary Thoughts
* AMZN flipped from bullish gamma to negative gamma — puts are now driving price action.
* As long as price stays under $224, rallies are sell opportunities.
* Losing $215.50 risks an accelerated drop to $210 or lower.
* Bears remain in control unless buyers step in aggressively at support.
🚨 Disclaimer:
This analysis is for educational purposes only and does not constitute financial advice. Always do your own research and manage your risk accordingly.
BLACKBERRY BBBREAKOUT OF DESCENDING TRENDLINE COULD SEE 22$-24$
BlackBerry today is a Canadian technology company specializing in cybersecurity software and Internet of Things (IoT) services for enterprises and governments worldwide. Formerly renowned as a mobile device manufacturer, BlackBerry Limited (formerly Research In Motion, RIM) exited the smartphone business in 2016 and now focuses on secure communications, endpoint management, and embedded systems, especially for industries like automotive, healthcare, and government.
Company Profile & Business
Headquarters: Waterloo, Ontario, Canada
Core products: Cybersecurity solutions, BlackBerry Unified Endpoint Management (UEM), QNX operating systems, secure messaging (BlackBerry Messenger Enterprise, BBMe), and automotive software platforms.
Global presence: Products and services are sold worldwide across the Americas, Europe, Middle East, Africa, and Asia-Pacific.
Recent Financials & Stock
Stock ticker: NYSE/TSX: BB
Recent price: As of July 30, 2025, BlackBerry closed at $3.74 per share, reflecting a decline from earlier in the month. Price targets for the company now range from $2.71 to $4.75, with analysts citing positive revenue growth and the company's first positive cash flow in three years after its recent quarterly results.
Business momentum: The company recently posted about 10% higher revenue compared to forecasts for the third quarter fiscal year 2025, with a shift to positive earnings and cash flow—highlighting improvements in its cybersecurity and IoT software businesses.
Notable News & Developments
End of smartphones: BlackBerry-branded mobile devices are officially discontinued. The company fully exited the hardware business by 2018 and stopped supporting BlackBerry 10 in 2022.
Nostalgia revival: In 2025, a separate company (Zinwa Technologies) is reviving classic BlackBerry devices (like the BlackBerry Classic and Passport) by retrofitting them with modern Android internals. These are not officially affiliated with BlackBerry Limited, but appeal to enthusiasts for the classic design and QWERTY keyboard, albeit with privacy caveats due to non-BlackBerry software.
Enterprise focus: BlackBerry remains a leader in secure software for businesses, including automotive OS (QNX), endpoint security, and secure messaging. Major clients include automotive OEMs, financial corporations, and government agencies.
Quick Facts Table
Aspect Details
Industry Cybersecurity, IoT software, enterprise services
Founded 1984 (as Research In Motion, Canada)
Consumer Phones Discontinued; brand revived unofficially by others
Current Stock Price $3.74 (July 30, 2025)
Latest Product Focus Automotive software, secure endpoint management
BlackBerry is no longer a phone maker, but remains a significant player in secure enterprise and automotive software, with stock prices and business outlook reflecting its transition into these fields.
Zinwa Technologies is a Chinese technology company that has gained attention in 2025 for its project to revive classic BlackBerry smartphones, specifically the BlackBerry Classic (also known as the Q20), under its own branding. Unlike BlackBerry Limited (which no longer makes hardware), Zinwa has purchased batches of old BlackBerry Q20 devices—both new-old-stock and used units from supply chains in Hong Kong—and is refurbishing them with entirely new internal components while retaining the iconic design features such as the physical QWERTY keyboard and 720x720 touchscreen.
Key Details on Zinwa Technologies’ BlackBerry Revival:
Project Name/Models: The updated phone is called the Zinwa Q25 (2025 is referenced in the model name). Zinwa is also planning to modernize other BlackBerry devices, including the KEYone (“K25”) and the Passport (“P25” or “P26”).
What’s Modernized?: The original shell, keyboard, notification LED, and display remain, but Zinwa installs a new motherboard with a MediaTek Helio G99 processor, 12GB RAM, 256GB storage (expandable), a 50MP rear camera, 8MP front camera, a new 3,000mAh battery, and global 4G LTE support. There is a USB-C port, headphone jack, microSD support, and the phone runs Android 13 (with no confirmed plans for updates to later Android versions).
How It’s Sold: Two options are offered—a fully assembled Zinwa Q25 smartphone for $400, or a $300 conversion kit for those who already own a BlackBerry Classic and want to upgrade themselves. Both are expected to ship in August 2025.
Nostalgia Meets Modern Tech: The initiative targets fans of physical keyboards and retro gadgets as well as a new wave of Gen Z users seeking “digital detox” devices. The device is positioned as a niche product for enthusiasts rather than a mass-market flagship.
No Connection to BlackBerry Limited: Zinwa Technologies has not acquired the BlackBerry brand or company; its project is independent and relies on recycling and upgrading old BlackBerry hardware.
Future Plans: Zinwa has stated it may refresh additional BlackBerry models based on demand and feedback, following the Q25 release.
In sum, Zinwa Technologies is bringing back the BlackBerry Classic as a refreshed, Android-powered device for technology enthusiasts and nostalgia seekers, reflecting a trendy intersection of retro design and modern smartphone capabilities in 2025.
#BB

META’s Monster Gap — Gamma Ceiling. 8/1META’s Monster Gap — Gamma Ceiling at $785 or Room to Run Past $800?
🔍 GEX & Options Flow Insight (1st Image Analysis)
META ripped higher on earnings momentum, gapping from the $690s into the $770s, and is now stalling just under the Gamma Wall / Highest Positive NET GEX at $784.69. Options positioning shows bullish gamma support but overhead resistance could trigger a stall or pullback before another leg up.
* Call Walls & Resistance:
* 📍 $784.69 → Highest positive NET GEX / Gamma Wall
* 📍 $800.00 → GEX10 & GEX9 ceiling = ultimate squeeze target if momentum continues
* Put Support Zones:
* 🛡️ $750.00 → Key 2nd Call Wall zone now acting as gamma support
* 📉 $700.00 / $691.30 → HVL zone + hard put support
* 🚨 Breakdown below $691 opens the door to a deep retracement
* Volatility Insight:
* IVR 5.6, IVx Avg 31.6 → Low IV = cheaper premium for directional plays
* Call flow 11.6% = Not euphoric, but bullish sentiment
* GEX sentiment: 🟢🟢🟢 = Long gamma environment, supportive of dips
✅ Option Trading Suggestion:
Bias: Bullish but extended — watch for consolidation before breakout
Strategy: Debit call spread (protects from IV crush)
* Entry Idea: Buy 780C / Sell 800C for Aug 2 or Aug 9 expiry
* Invalidation: Breakdown under 750 with volume
* Target: 785 → 800 on continuation
Why this works: META is riding strong bullish gamma positioning. As long as it holds above $750, dealer hedging supports price. Break above $785 could trigger short gamma acceleration to $800. But extended after earnings, so controlled size is key.
🧠 Technical Analysis (1H Chart) (2nd Image Analysis)
Market Structure & SMC:
* ✅ BOS + CHoCH sequence with a massive impulsive move from liquidity grab under $700
* 📈 Price is currently in the supply zone (purple box $768–$784) from historical resistance alignment
* 📊 First consolidation post-gap — watching for either breakout or gap-fill attempts
Trendline Dynamics:
* Strong bullish breakout from long consolidation
* Price is riding the upper slope of a sharp post-gap channel
SMC Zones:
* 🟩 Demand / OB Zone: $750–$724 → Ideal dip buy zone if retested
* 🟥 Supply Zone (Purple Box): $768–$784 → Current battle zone
🔄 Price Action & Key Levels
* Support:
* ✅ $750 → Former resistance, now key support
* ✅ $724 → Fib retracement confluence
* 🚨 $700 / $691.30 → HVL & hard gamma put wall
* Resistance:
* 🚩 $784.69 → Gamma Wall + supply top
* 🧨 $800 → Ultimate squeeze ceiling
🧭 Scalping / Intraday Trade Setup
🟩 Bullish Setup:
* Entry: $770–$772 dip reclaim
* Target 1: $784.69
* Target 2: $800 extension
* Stop: Close under $750
🟥 Bearish Pullback Setup:
* Entry: Rejection at $784.69
* Target 1: $760
* Target 2: $750
* Stop: Breakout above $785
🔁 Summary Thoughts
* META just printed a post-earnings breakout that could keep running into $785–$800 if gamma fuel continues.
* First consolidation after the gap is critical — if bulls defend $750, breakout setups remain strong.
* Caution chasing highs; better reward/risk comes from pullback buys into $750–$760.
* Dealers are long gamma, which supports range-bound chop with bullish bias.
🚨 Disclaimer:
This analysis is for educational purposes only and does not constitute financial advice. Always do your own research and manage your risk accordingly.

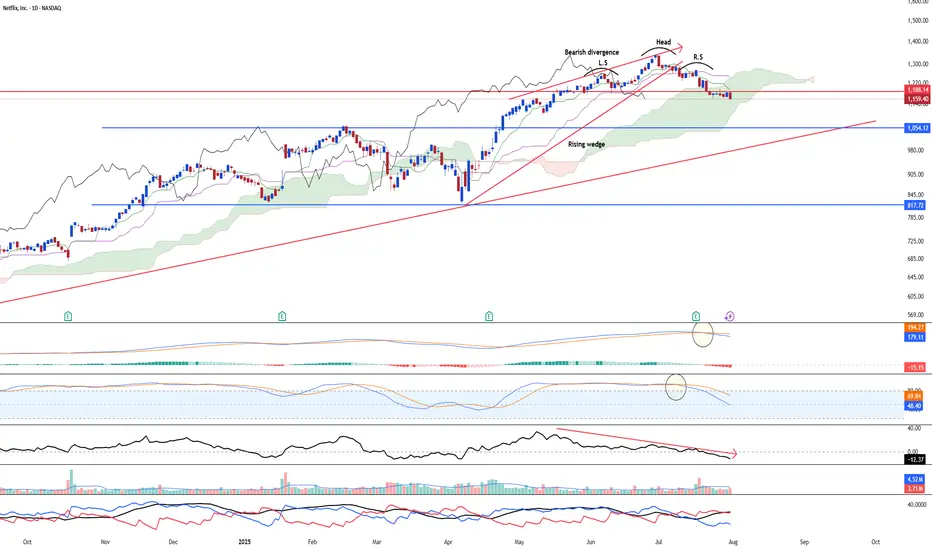
Turning the side for NetflixNetflix NASDAQ:NFLX may go through some serious correction soon after the stock rallied a lot till the high of 1337. Furthermore, the stock has confirmed the head and shoulder reversal with the latest bearish candle rejecting the neckline resistance @ 1188.14. Furthermore, the bearish divergence has been on since 19 May 2025.
Long-term MACD has performed a bearish crossover at the top and histogram is negative.
Stochastic Oscillator has confirmed the overbought signal.
23-period ROC turns negative and forms a bearish divergence. Directional movement index saw increased bearish trend strength signal.
Target is at 1054 in the near-term
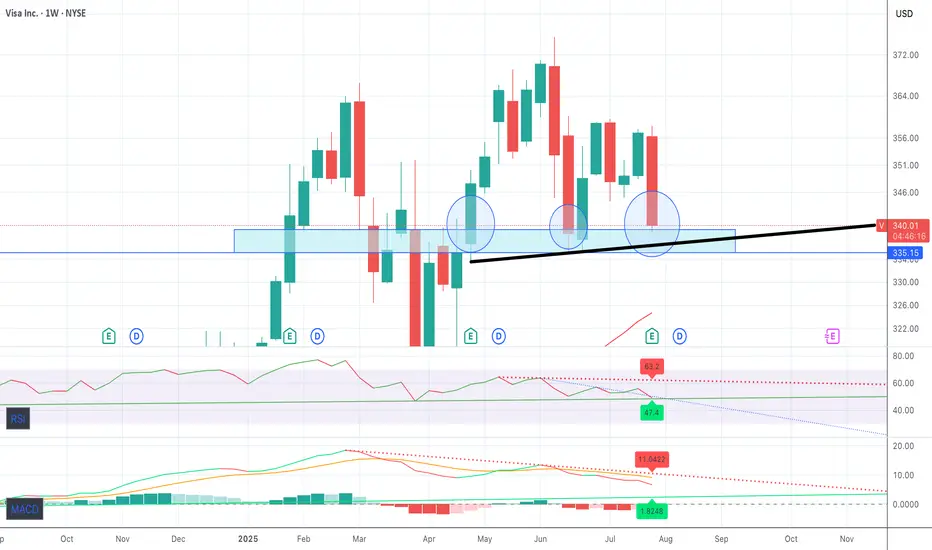
Visa UpsideWe're approaching what I believe is max pain at $435 after impressive earnings from Visa. I think the upside is very much on here
$TSLA ~ Elliott Wave Updates.This whole wave is Wave C(Black) that started when Wave B(Black) was completed. This Wave C(Black) expresses itself in 5 main waves shown in Green. Wave 2(Green) was a Zigzag and a Flat should be expected for 4(Green). Meanwhile, Wave 3(Green) expresses itself in a 5 wave move shown in Black- with Wave 2(Black) being a Zigzag, our 4 was a Flat. This Flat is shown as Blue ABC. When Wave 4(Black) completed, our Wave 5 began which upon completion, would be Wave 3(Green) of the main wave. Wave 2(Red) is a Flat and a Zigzag should be expected after 3(Red).
Go to for more information of the same.
GOOGL Slips into Bearish Gamma Territory. 8/1GOOGL Slips into Bearish Gamma Territory — Eyes on $190 Defense or Slide to $187.50
🔍 GEX & Options Flow Insight (1st Image Analysis)
GOOGL has broken down from its recent consolidation and is now testing the $190–$192 gamma support band. The GEX profile shows heavy negative gamma just below current price, increasing the risk of accelerated selling if $190 fails.
* Call Walls & Resistance:
* 📍 $194.91–$196.53 → First resistance zone
* 📍 $197.85 → Highest positive NET GEX / Gamma Wall
* 📍 $202.50+ → Out of immediate range unless a strong reversal occurs
* Put Walls & Support Zones:
* 🛡️ $190.50 → Current gamma pivot
* 🚨 $187.50 → 2nd Put Wall / Hard gamma floor
* 📉 Below $187.50 opens the door to $185–$182
* Volatility Insight:
* IVR 18.9, IVx Avg 32.5 → Slightly elevated IV
* Call flow 11.2% → Bearish leaning
* GEX sentiment: 🔴🔴🔴 = Negative gamma environment → more volatility to downside
✅ Option Trading Suggestion:
Bias: Bearish unless reclaiming $194+
Strategy: Bear put spread
* Entry Idea: Buy 190P / Sell 185P for Aug 2 or Aug 9 expiry
* Invalidation: Close above $194.91
* Target: $187.50 → $185
Why this works: Dealers in negative gamma hedge by selling into weakness, which can accelerate moves lower. Losing $190 likely brings $187.50 quickly into play.
🧠 Technical Analysis (1H Chart) (2nd Image Analysis)
Market Structure & SMC:
* 🟥 CHoCH confirmed after rejection from $197.85 supply
* ❌ Price broke BOS support from $194.91 area
* Trading in a descending structure toward $190 support
Trendline Dynamics:
* Broke short-term uptrend
* Now respecting a lower parallel channel toward $187.50
SMC Zones:
* 🟩 Demand Zone: $190.50–$187.50 → First defense zone
* 🟥 Supply Zone (Purple Box): $194.91–$197.85 → Immediate resistance
🔄 Price Action & Key Levels
* Support:
* ✅ $190.50 → Current hold line
* ✅ $187.50 → Gamma floor
* 🚨 Below $187.50 → $185 → $182
* Resistance:
* 🚩 $194.91 → First reclaim level for relief rally
* 🚩 $196.53–$197.85 → Supply + Gamma Wall
🧭 Scalping / Intraday Trade Setup
🟥 Bearish Setup (Preferred):
* Entry: Failed bounce at $194–$195
* Target 1: $190.50
* Target 2: $187.50
* Stop: Above $196
🟩 Bullish Reversal Setup:
* Entry: Strong reclaim of $196.50 with volume
* Target 1: $197.85
* Target 2: $200+
* Stop: Back under $194
🔁 Summary Thoughts
* GOOGL has shifted from neutral to negative gamma, favoring continued downside pressure.
* $190.50 is the short-term line in the sand — losing it risks a swift trip to $187.50.
* Any bounce into $194–$196 is likely to face selling pressure unless backed by volume and a gamma flip.
🚨 Disclaimer:
This analysis is for educational purposes only and does not constitute financial advice. Always do your own research and manage your risk accordingly.

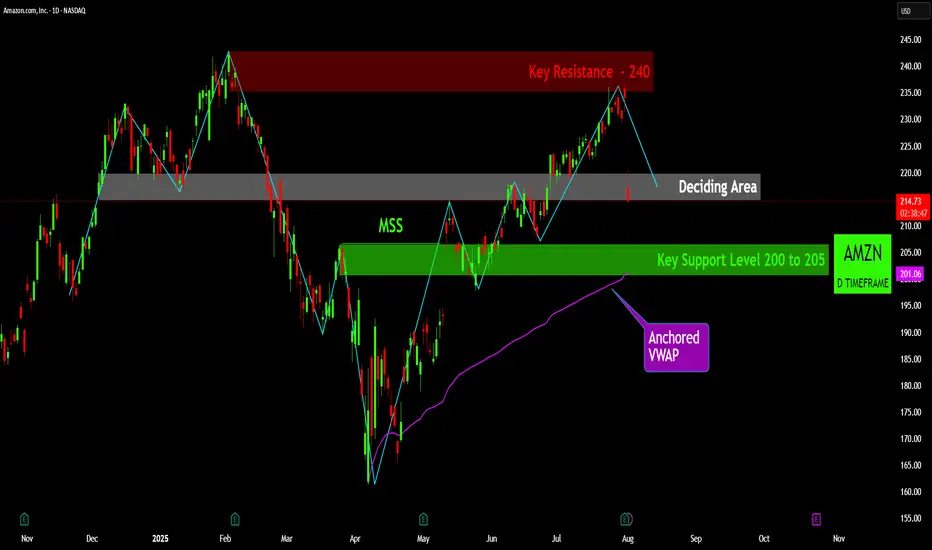
AMZN: The Battle for Direction at a Critical JunctureThe recent price action for Amazon (AMZN) is currently navigating a critical juncture, having pulled back from a significant resistance level and now consolidating within a pivotal "Deciding Area." A detailed review of the key technical levels reveals the following insights:
Key Resistance ($240): A formidable resistance zone is established around the $240 price point. This level represents a major overhead supply area, where prior selling pressure has been strong enough to halt upward price movements on multiple occasions. A decisive breach of this level on strong volume would be a highly bullish development, signaling a potential move to new highs.
Key Support Level ($200 to $205): A robust support zone is identified between $200 and $205. This level has historically served as a strong price floor, absorbing selling pressure and providing a foundation for subsequent rallies. The integrity of the current uptrend is heavily dependent on the price holding above this critical area.
Market Structure Shift (MSS): The formation of a "Market Structure Shift" earlier in the year was a pivotal technical event. This change in market dynamics marked a significant transition, signaling a potential reversal from a prevailing downtrend to the current bullish phase. The subsequent rally from the lows validates this structural change.
Anchored VWAP: The Anchored Volume-Weighted Average Price (VWAP), anchored from the most recent major low, is serving as a dynamic and trend-defining support level. This indicator reflects the average price paid by investors since the start of the current trend. A sustained close below this line would be an early warning sign of weakening momentum.
Deciding Area: The stock is presently trading within a "Deciding Area" situated just below a previous swing high. This zone represents a period of consolidation and indecision as the market digests the recent pullback from resistance. The outcome of this consolidation will likely dictate the short-term directional bias. A break to the upside would suggest a renewed attempt to challenge the $240 resistance, while a breakdown would likely lead to a retest of the primary support level at $200-$205.
Summary of Outlook: The overall technical picture for AMZN indicates that the stock is at a critical inflection point. The health of the underlying uptrend remains intact as long as the price holds above the key support levels and the Anchored VWAP. A definitive move out of the "Deciding Area" will provide the next clear signal for either a renewed push toward resistance or a deeper pullback to test established support.
Disclaimer:
The information provided in this chart is for educational and informational purposes only and should not be considered as investment advice. Trading and investing involve substantial risk and are not suitable for every investor. You should carefully consider your financial situation and consult with a financial advisor before making any investment decisions. The creator of this chart does not guarantee any specific outcome or profit and is not responsible for any losses incurred as a result of using this information. Past performance is not indicative of future results. Use this information at your own risk. This chart has been created for my own improvement in Trading and Investment Analysis. Please do your own analysis before any investments.
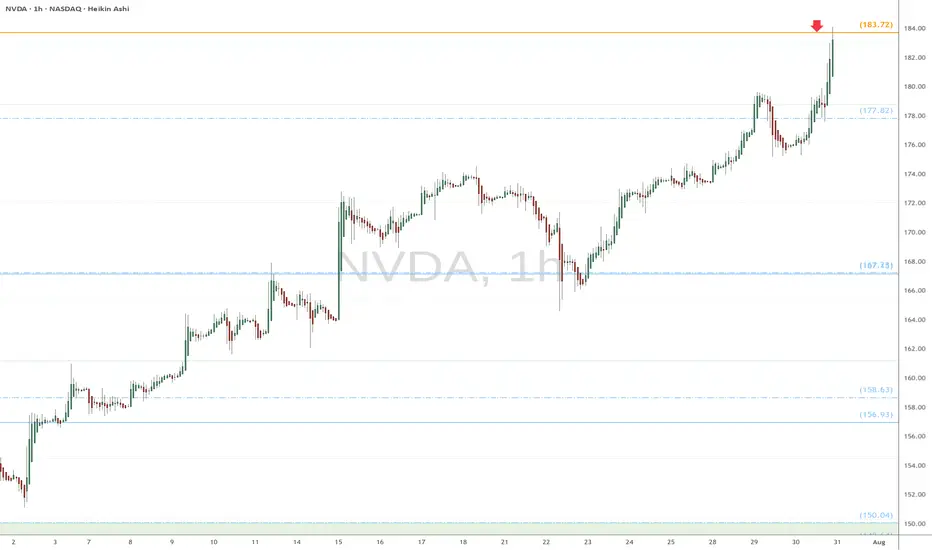
NVDA heads up at $183.72: Golden Genesis fib to mark a TOP?Chips have been flying high since the April lows.
NVDA has just hit a Golden Genesis fib at $183.72
This is a "very high gravity" fib so expect a reaction.
It is PROBABLE that we "orbit" this fib a few times.
It is POSSIBLE that we reject to form a major top.
It is PLAUSIBLE that we Break-n -Retest to continue.\
.
See "Related Publications" for previous EXACT plots ------>>>>>>>>
Such as this post at the last Golden Genesis:
Hit the BOOST and FOLLOW for more such PRECISE and TIMELY charts
============================================================
.